
When we publish any application, it is important that it is bug free. This does not mean that bugs are free but that the application is carefully designed, developed, and tested so that all the found bugs are fixed.
We should take all the required time and effort to find and fix the bugs in the application. To do that, we should profile and test the application continuously and address all the edge cases.
In this chapter, we will explore key features of debugging, profiling, and testing Xamarin.Forms projects.
Debugging is a common part of the development process to remove unexpected behaviours from code files.
Both Xamarin Studio and Visual Studio have great tools to make it easy to detect and fix bugs (the bug is unexpected behaviour itself).
The Xamarin framework is built and run on top of Mono Runtime and implements Mono Soft Debugger. Both IDEs use the Mono Soft Debugger to debug managed code in all Xamarin applications.
We'll create a sample project to learn the debugging process of an Xamarin.Forms project.
Let's open up Xamarin Studio and click on the New Solution button at the top of the Solution Pane, as shown in the following screenshot:

- Select Multiplatform | App from the list on the left-hand side, and Xamarin.Forms | Forms App from the list on the right-hand side.
- Click on the Next button.
- Type
DebuggingXamarinSampleinto the App Name. - Click on the Next button.
- Review the summary of the project.
- Click on the Create button:

Now we have a new project and we can start to learn the basics of debugging.
To set a breakpoint, click on the margin area of Xamarin Studio, next to the line number of the code.
The line will turn to a red background and a red circle will appear on the left, as shown in the following screenshot.
When we start the project in Debug Mode, the execution will pause on breakpoints:

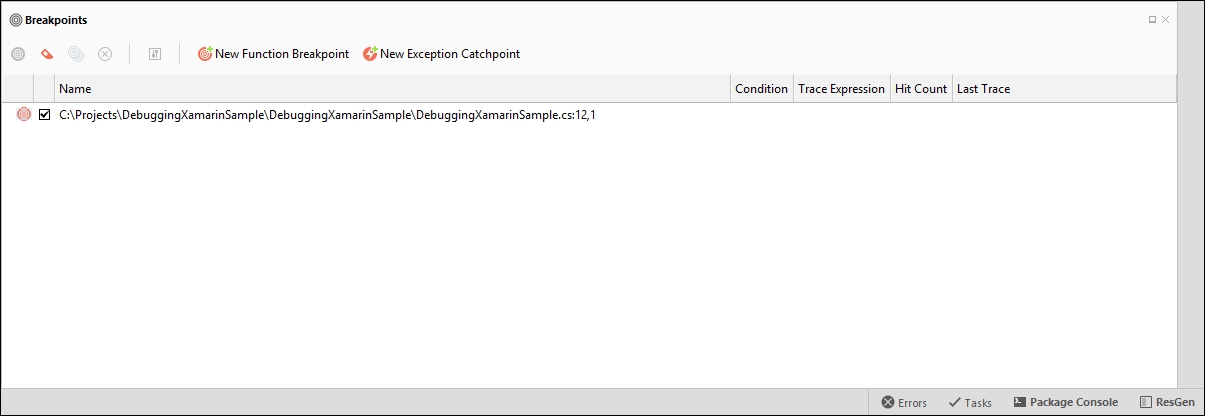
We can view all the breakpoints that have been set in the code file by going to the Breakpoints Pad.
If the Breakpoints Pad isn't visible, we can make it visible by navigating to View | Debug Windows | Breakpoints:
Now that we have breakpoints set, we can easily start a debug session.
To start debugging, we need to select the Debug option in Configuration Combo and click the Run button:

When projects start to run in the emulator and reach the breakpoint, it pauses and gives control to Xamarin Studio.
We can view and change variables' values and control executions step by step, or continue to run at this point.
We can use log panels to view execution logs from the running application.
Sometimes we don't want to stop execution and investigate all the variables, or, we can't do that. For example, if there is a loop in a method that iterates hundreds of times and we just want to watch a variables value, we don't want to stop the execution inside the loop.
In this situation, we may use the Application Output Window Log panel. Sometimes we want to watch the device's log outputs that our application runs on. In this situation, we may use the Device Log panel.
When we need to view a variables' values but don't want to pause execution, we can simply use the Log Window of Xamarin Studio.
Simply, we can use the Console class' WriteLine method and log a variable to the Application Output panel:
var i = 5;
Console.WriteLine("i is " + i);

We can attach to a device and view OS and application level logs in this panel:

We can even add our own logs to this panel by using the log class and its methods:
- Debug
- Error
- Info
- Warn
- Wtf (What a Terrible Failure)
If we need to add a log on a specific condition, we can write a code like this:
var i = 5;
Log.Error("MainWindow", "i = " + i);
This code block writes a line inside the Android Device Log with a red background, because it's an Error Log:
