
Chapter 16: Testing Code with Instruments
In This Chapter
Beginning with Instruments
Exploring the Instruments UI
Using instrument templates
Profiling a live application
Comparing runs
Creating custom templates and instruments
Debugging is ideal for low-level line-by-line fault finding. But it's often useful to take a wider view of application performance—for example, to identify performance bottlenecks, monitor processor loading, and check for memory leaks.
The Xcode toolchain includes a powerful and comprehensive helper application called Instruments, used for general testing and profiling. Instruments is a general purpose time line–based test rig that supports a selection of instruments—plug-in test probes that monitor some feature or performance metric.
![]() NOTE
NOTE
The name of the test application is Instruments, with a capital I. The individual test plug-ins are instruments, with a small i.
You can combine multiple instruments to create a custom test rig, save the rig for use with other applications, and save the results of every test run for comparison with other runs. Instruments supports both iOS and OS X applications, but each OS supports a slightly different selection of instruments.
These are the key benefits of Instruments:
![]() A time line: You can graph and compare the output of multiple instruments simultaneously and watch supporting charts and tables.
A time line: You can graph and compare the output of multiple instruments simultaneously and watch supporting charts and tables.
![]() Live testing: You can interact with an application and monitor how user events affect its performance.
Live testing: You can interact with an application and monitor how user events affect its performance.
![]() Overall system profiling: Some instruments monitor how an application affects system resources as a whole and how other applications or processes compete with it.
Overall system profiling: Some instruments monitor how an application affects system resources as a whole and how other applications or processes compete with it.
![]() A comprehensive library of instruments: You can monitor performance in almost every possible way.
A comprehensive library of instruments: You can monitor performance in almost every possible way.
![]() Automated testing: You can play back scripted events to drive your application.
Automated testing: You can play back scripted events to drive your application.
![]() Simultaneous parallel testing: You can track and monitor multiple instruments in the same application; on OS X, you can monitor multiple applications simultaneously.
Simultaneous parallel testing: You can track and monitor multiple instruments in the same application; on OS X, you can monitor multiple applications simultaneously.
![]() Test recording: Instruments creates a record of each run on separate tracks. You can save the record and reload it to compare it with other runs.
Test recording: Instruments creates a record of each run on separate tracks. You can save the record and reload it to compare it with other runs.
![]() Customized instruments: Advanced developers can create their own instruments.
Customized instruments: Advanced developers can create their own instruments.
Beginning with Instruments
Instruments runs in an independent window, as shown in Figure 16.1. You can launch it intwo ways:
![]() Select Product⇒Profile in the main Xcode menu to build a project and load it into Instruments. By default, Instruments is automatically attached to (set up to profile) the current project. The monitored application is called the target.
Select Product⇒Profile in the main Xcode menu to build a project and load it into Instruments. By default, Instruments is automatically attached to (set up to profile) the current project. The monitored application is called the target.
![]() Launch Instruments independently from Finder or the Dock. Instruments is in the main Xcode
Launch Instruments independently from Finder or the Dock. Instruments is in the main Xcode /Developer/Applications directory. When you launch Instruments manually, you must attach it to a target yourself. Usually, the target is your project, but you can monitor any running process, with some limitations, described later in this chapter.
Figure 16.1
A first view of Instruments, showing one instrument out of the many that are available

Understanding Instruments
Instruments is a multi-track recorder for system events and statistics, similar to a music or video recorder.
Each instrument records data of one type—object allocations, processor load, user events, and so on—on a separate lane, or data track. When you start a test run, Instruments initializes each lane and begins to fill it with statistics collected from the target. Instruments remembers the results of each test run, and you can review each recording while Instruments is paused.
Many instruments include filters, and you can use them to include or exclude certain event sub-types. For example, when monitoring object and memory allocations, you can exclude all low-level malloc events to simplify the display and make it easier to monitor object-level events of interest.
In addition to the time line view, most instruments display various statistics as they're collected. Statistics may appear as tables, charts, lists, or other summaries.
![]() NOTE
NOTE
Instruments is huge and complex, almost as complex as Xcode. A detailed breakdown of every element would fill this book. Most features can be understood with educated guesswork and experimentation. This chapter doesn't list every feature, but it does outline how you can get started with Instruments so you can begin to explore it for yourself and start working with the tools that you're most likely to find useful.
Exploring the Instruments UI
Figure 16.2 shows a more typical working view of the Instruments UI, this time showing the Allocations instruments, which monitors objects in memory. The design follows the standard OS X guidelines, with a selection area at the top left, an active area in the middle, and a view at the right that can display supporting information. The active area is split into a time line view at the top and a detail pane the bottom. A toolbar at the top of the window controls the main application features.
The selection area is called the instruments pane and includes a list of all instruments used in a trace. Each instrument has a reveal triangle that shows the results of previous runs and an information icon that reveals extra options for fine-tuning a recording.
The time line view is called the track pane. You can use a slider at the bottom of the instruments pane to expand the scale of the track pane.
The detail pane fills the bottom of the display. It includes a selection area at the left that can fine-tune and filter the information that's displayed and a display pane in the bottom middle that displays the information that has been selected.
The extended detail pane at the right shows optional further detail that supports the information in the detail pane. In the figure, the extended detail pane shows a stack trace.
Figure 16.2
Looking in more detail at the Allocations instrument
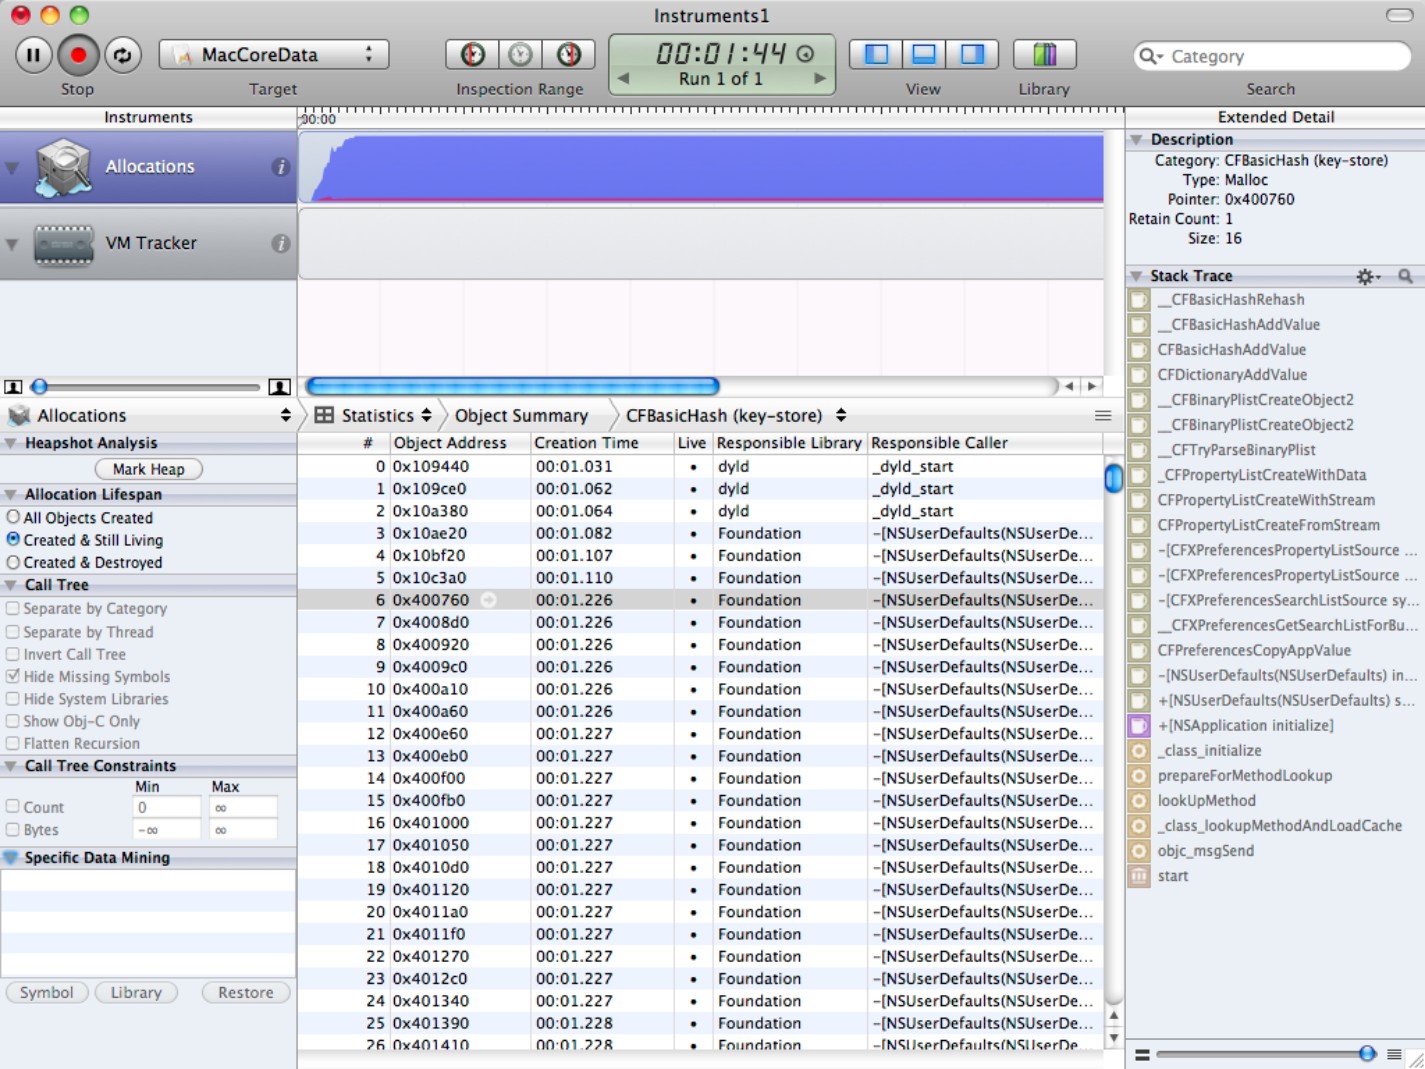
You can see there's an immense amount of detail in the display. The Allocations instrument (refer to Figure 16.2) literally lists every object in memory. You can monitor the creation and destruction of specific class instances and view stack traces for each creation event. You can also get more general statistics about created and destroyed objects, the total memory footprint of the application, and so on. Not all instruments display this much detail; others are simpler summaries of less complex application states.
![]() CAUTION
CAUTION
Some features work at a low level, so you need a basic understanding of Cocoa and OS X/iOS internals to get the most from certain instruments. You can use Instruments without this knowledge, but you will miss the more powerful and productive features.
![]() NOTE
NOTE
Because some instruments literally modify the OS kernel as it's running, you may be asked for your OS X username and password before they grant low-level access. The kernel changes are transparent and temporary.
Introducing the toolbar
The toolbar includes the most important controls and is visible unless you hide it using the button at the top right. The features in the toolbar are described in the following sections.
Record, pause, and loop control
The large Record button begins and ends recording. While recording, the label changes from Record to Stop. If you're recording an instrument that manages UI events, the label changes to Drive and Record.
![]() CAUTION
CAUTION
When you profile an application, you first select one or more instruments for a run, as described later in this chapter. Instruments then pauses while the instruments are loaded, and eventually it begins recording automatically. If you're profiling your project from Xcode, don't click the Record button while nothing seems to be happening. Instruments begins recording when it's ready. If you're profiling some other existing process, you need to start the recording manually.
The Pause button pauses recording. The timer shown in the main time indicator stops, and Instruments stops collecting data. In fact, the timer continues to run, and if you click the pause button again, you see that a gap has appeared in the recording, as shown in Figure 16.3. This isn't an essential feature, and typically you can ignore it. But occasionally, you may want to change application settings or interact with the application without recording the results.
Figure 16.3
Creating gaps in the recording with the Pause button

The Loop button toggles between playing a track once and repeating it. You can use this feature with recordings of UI events to create multiple test runs from the same user actions.
The target menu
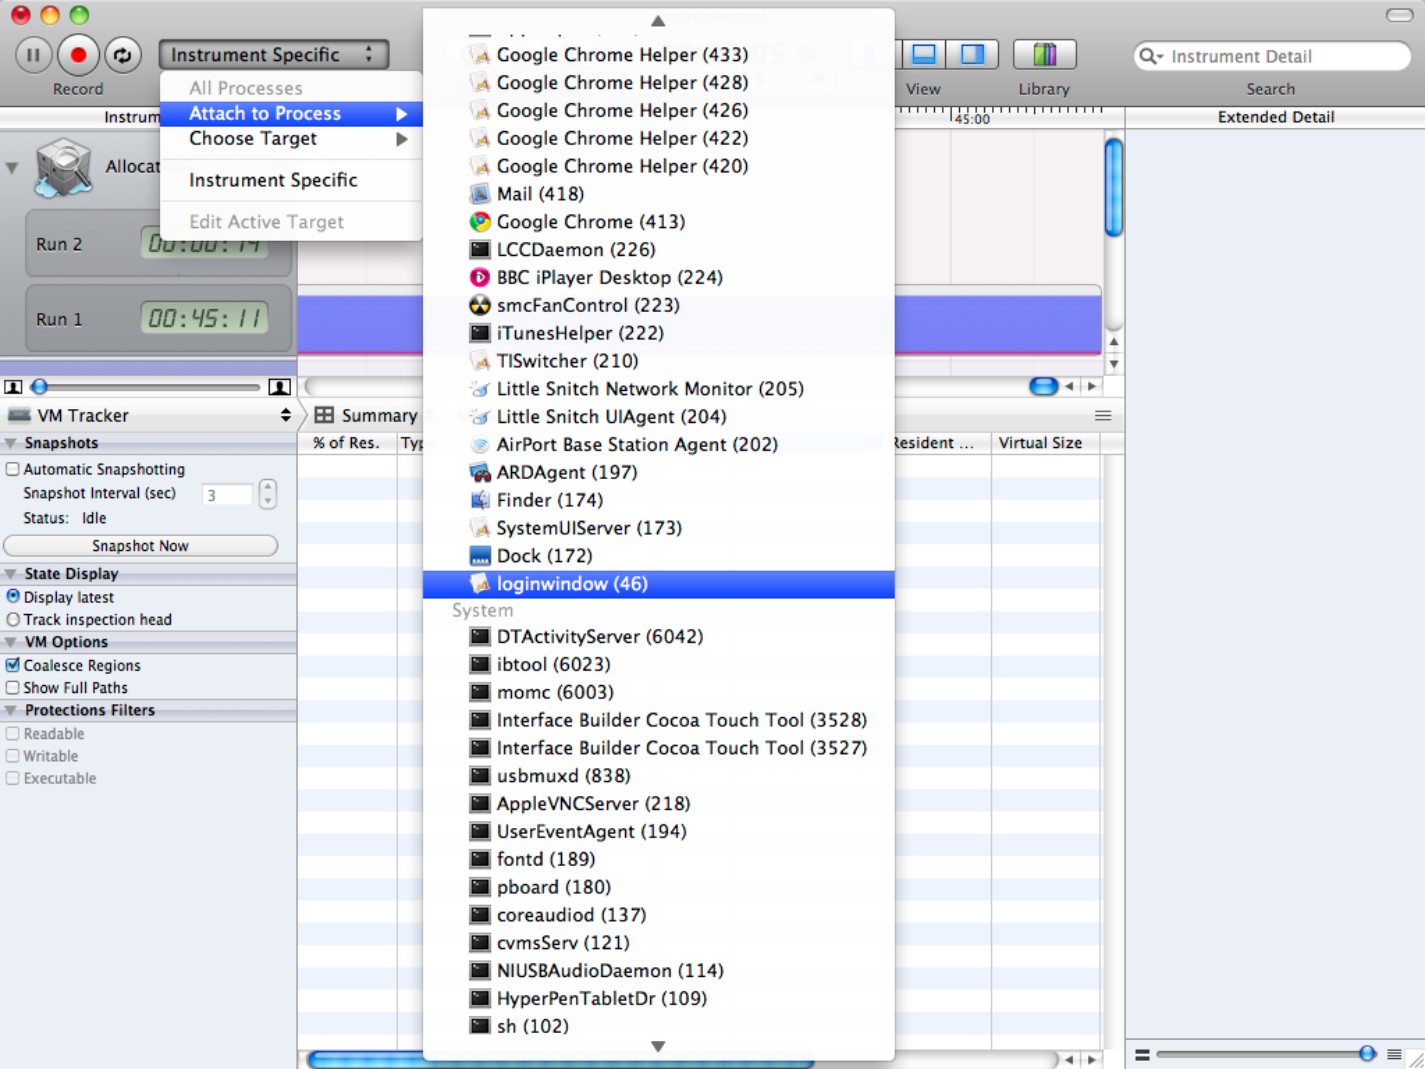
Use the target pop-up to select the process or processes to be recorded. When you profile a project from Xcode, your project is pre-selected for you here. But you can profile any running process by attaching Instruments to it, as shown in Figure 16.4.
Manual attaching is more limited than project profiling. For example, system applications such as iTunes, Front Row, DVD Player, and QuickTime are deliberately cloaked from Instruments, and you can't collect data from them. Some instruments rely on debug symbol tables. Most applications don't include these, so you can't profile or test them at a low level.
Figure 16.4
When you are attaching to a process, the pop-up shows all running processes, including ones you won't usually want to profile.
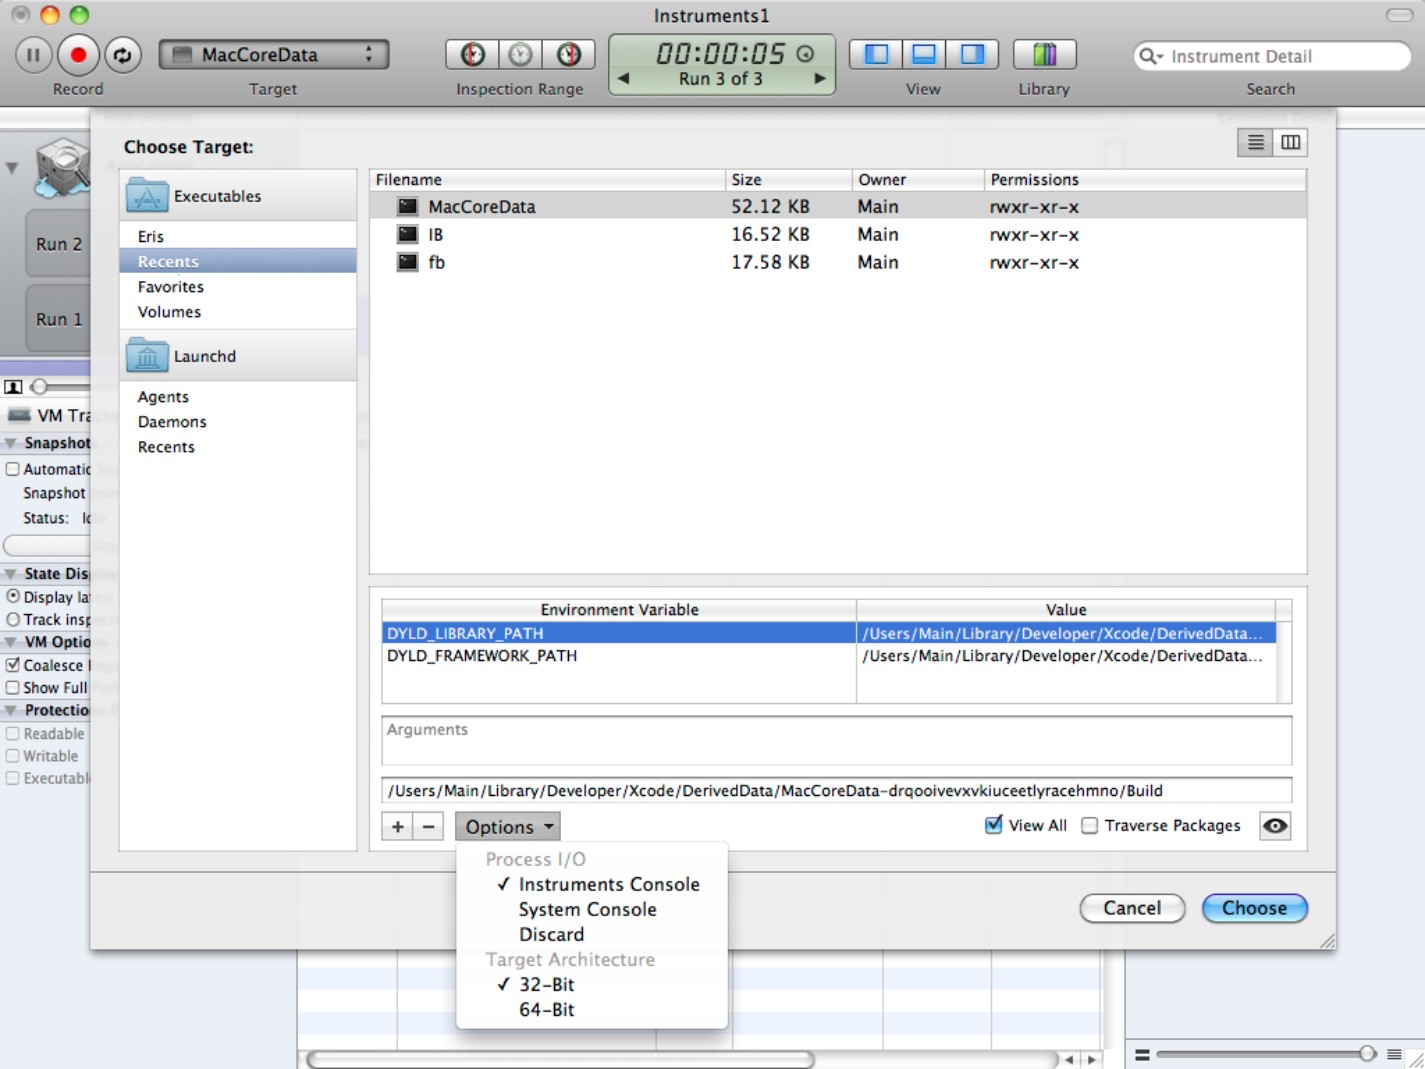
Like many features in Instruments, the target menu has hidden depths, and you can make very specific selections. Figure 16.5 shows the Edit Active Target sub-option in the target menu. You can define the environment variables for the target, add new variables and launch arguments, and select one of the possible consoles for the application.
Figure 16.5
Working with target settings
![]() TIP
TIP
The Agents and Daemons views are useful because they collect default plists for each system item in a single, easily accessible location. To view the defaults, select a daemon or agent from the list and click the eye icon at the bottom right of the dialog box. You see a text XML dump of the plist, with the keys and values in the dictionary. To edit the plist, double-click it. Xcode opens a new plist editor window. For more about editing plists, see Appendix B.
The inspection range
Use the three inspection range buttons to set the start and end time of the display. To set the start time, drag the position cursor in the time line (described later) to your chosen start point and click the leftmost range button. To set the end time, repeat for the rightmost button. To clear the range, click the middle button.
The inspection range doesn't affect the time line. It doesn't zoom to fill the screen, and it doesn't modify the position cursor. However, it sometimes affects the statistics that are chosen and displayed elsewhere in Instruments.
The time/run control
This shows the elapsed time in a recording. You can use the arrows under the time display to select different runs. The clock/run icon to the right of the time digits toggles the display between the current recording position and the current cursor time.
The view selector
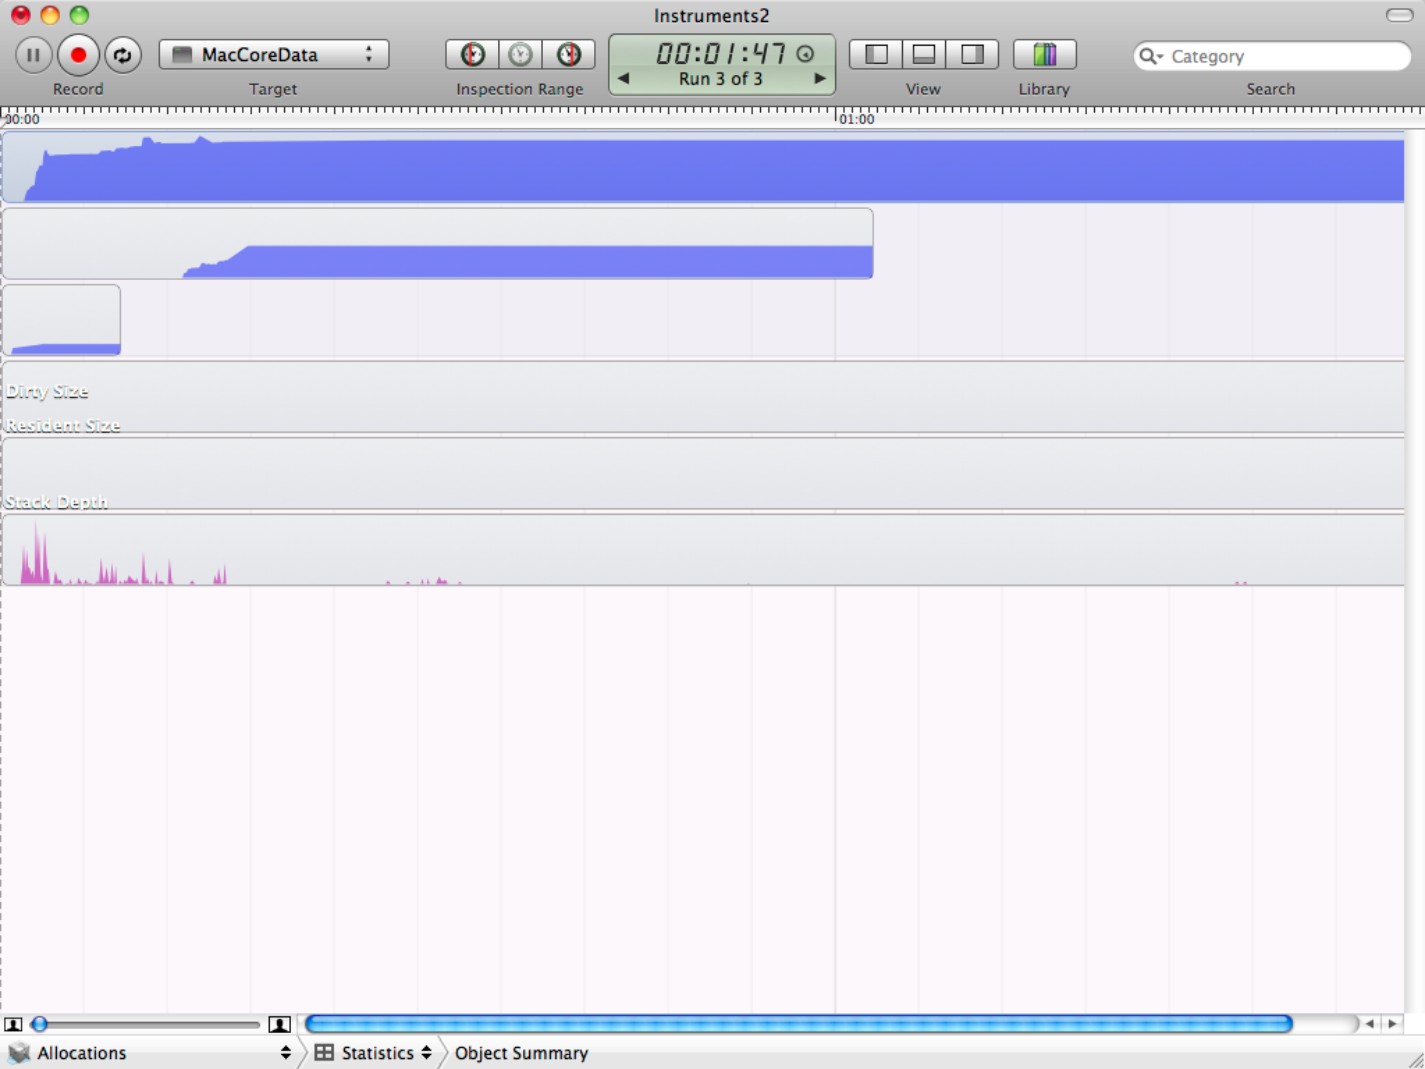
The three view buttons display and hide the various possible panes. You can view as much detail as possible, or you can hide everything except the time line display, as shown in Figure 16.6. It's more usual to run Instruments with the left and lower panes showing.
Figure 16.6
Use the view selector to hide all information except the track lanes. This isn't often useful, but occasionally you may want to maximize the number of visible tracks, to simplify multiple comparisons.
The library button
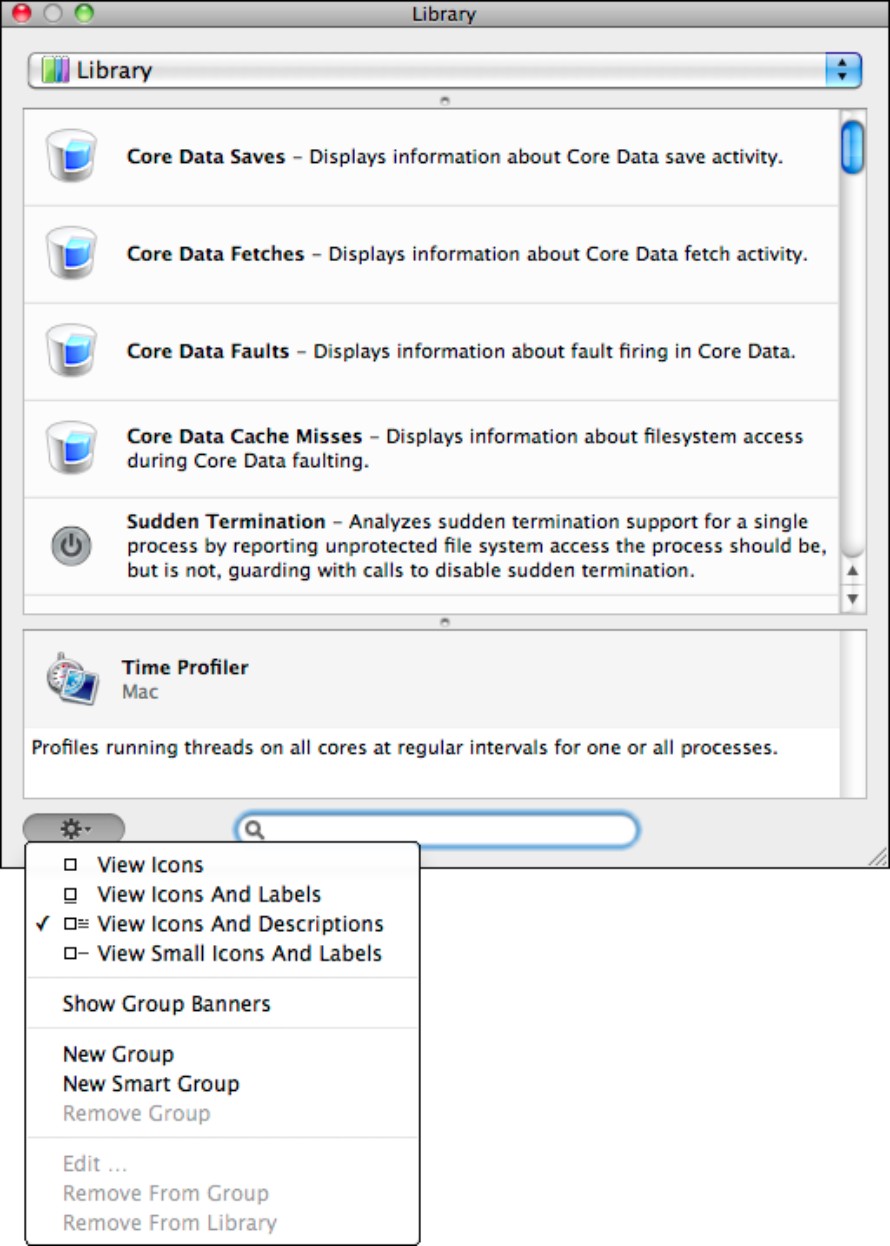
This button toggles display of the instrument library—a floating window that lists all available instruments, as shown in Figure 16.7. You can use the gear icon at the bottom left of the window to show a menu with various display options. The Library menu at the top of the window displays a list of instrument groups. You can use the library to create your own instrument collections, saving them as templates—instrument collections that profile related application elements.
Figure 16.7
Use the Library's view options to save space on smaller monitors. The large icons are impressively detailed, but they waste space on a smaller monitor.
![]() NOTE
NOTE
Only instruments that match the current project platform are shown; in other words, only Mac-compatible instruments appear for an OS X project, and only iOS compatible instruments appear for an iOS project. There are significant differences between the instruments supported on each.
The search field
You can use the search field to add another set of filters to the information in the detail pane. Search operations depend on the data produced by an instrument, so searches are context-dependent.
Figure 16.8 shows how you can filter the output of the allocations instrument to show only CFArray items. In your own projects, you can use this feature to monitor your own custom objects while hiding all other activity. It's easy to overlook the search field, but it can be a very powerful way to filter a flood of data to a trickle of precisely targeted useful statistics.
Figure 16.8
Use the search field to filter the output of the allocations instrument, reducing hundreds of items to just two.

Getting Started with Instruments
Instruments has some quirks, and the easiest way to become familiar with them is to experiment with a practical profiling project—one that monitors memory events in an iOS app.
Memory management in iOS can be challenging, and Instruments includes tools that can monitor memory and report on crashes. Although Instruments has many possible applications, memory profiling is one of the most useful. If you develop for iOS, Instruments can save you time and help you create apps that are robust and don't leak memory.
Creating a leaky test app
To demonstrate this in practice, you need to create an app that deliberately leaks memory. Instruments monitors the leak so you can see how allocations and leaks are graphed and summarized as statistics. Follow these steps:
1. Create a new Window-based iOS project in Xcode with File⇒New Project.
Don't include unit tests or Core Data.
2. Save the project as MemoryLeak.
3. Modify the start of MemoryLeakAppDelegate.m so it matches the following listing:
@implementation MemoryLeakAppDelegate
@synthesize window;
- (BOOL)application:(UIApplication *)application didFinishLaunchingWithOptions:(NSDictionary *)launchOptions
{
// Override point for customization after application launch.
[self.window makeKeyAndVisible];
NSTimer *theTimer =
[NSTimer scheduledTimerWithTimeInterval:1.0
target:self
selector:@selector(timerDo)
userInfo:nil
repeats:YES];
return YES;
}
- (void) timerDo {
NSObject *theLeak = [[NSObject alloc] init];
}
This code creates a timer that repeats once per second. The timerDo timer handler method creates a new object called theLeak, which is never released. When the pointer is overwritten, the memory is lost and becomes a leak.
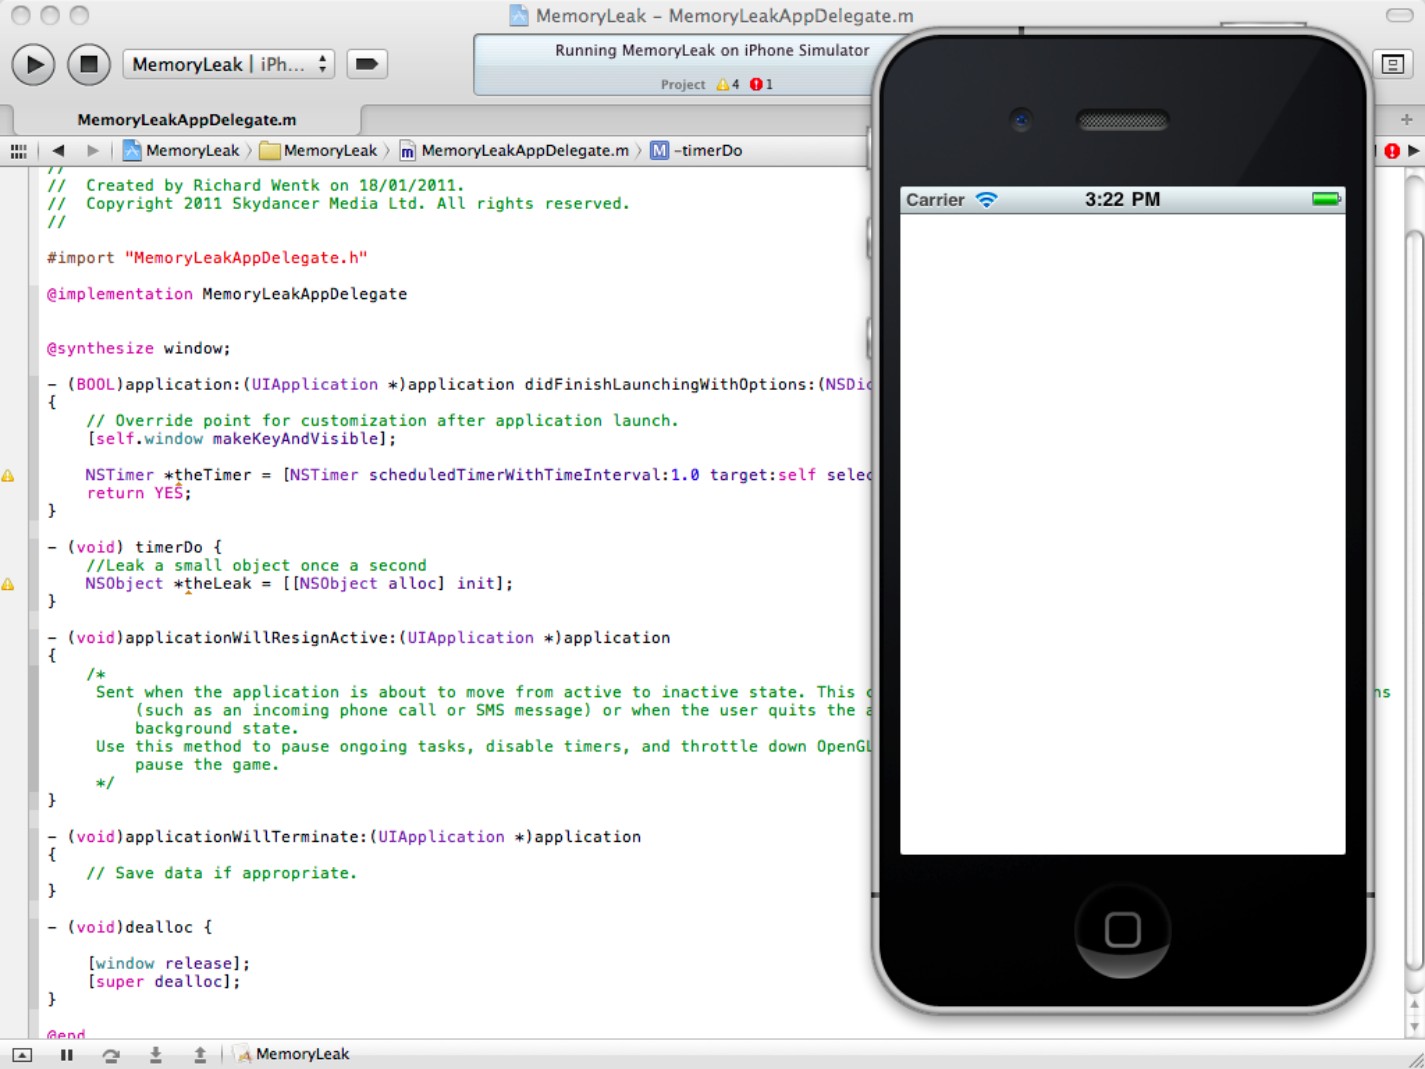
If you build and run the project, as shown in Figure 16.9, the app appears to work. The window has no UI elements and does nothing. But the app doesn't crash, and there's no indication that it's leaking memory. If you leave it running for long enough, it eventually causes an iOS memory error. But because theLeak is a small object, it's difficult to distinguish the leak from other possible crash events, unless you monitor memory directly.
Figure 16.9
There's no way to tell from the Simulator or from the build messages in the editor that this app is leaking memory.
Profiling an app with Instruments
Loading a project into Instruments is known as profiling. The process is the same for OS X and iOS projects. The simplest version has the following steps:
1. Make sure the project builds with no errors.
2. Select the Product⇒Profile option in the main Xcode menu.
3. Wait while Xcode creates a special profiling build.
You see the usual Build Succeeded message at the end of this step.
4. Wait again while Xcode loads and launches Instruments automatically.
You don't need to launch Instruments manually when profiling.
5. Select a trace template.
A template includes one or more instruments with predefined settings, and it's designed to collect and display information about specific issues or runtime values.
6. Wait while Instruments initializes the instrument.
7. Optionally, authenticate with your standard OS X user password if asked to.
Not all instruments require this step.
8. Wait again while Instruments completes its initialization.
This can take a few seconds. Instruments appears to do nothing, and your Mac may become slow or unresponsive until initialization completes.
9. Begin monitoring the app, using the instrument you selected.
The time line begins scrolling with a graphical display, and the details pane shows dynamic statistics. Depending on the instrument, you can modify the display to zoom in or out, select or hide certain statistics, reveal further details, and so on.
10. At the end of a run, select the Stop button at the top left.
You can now scroll through the time line to review the graph.
This process seems simple, but there are a few hidden complications. Not all templates are available on all platforms. When Instruments launches, it offers a slightly different selection for OS X, iOS Simulator, and iOS hardware projects.
Note also that the startup delay is variable and inconsistent. When you load Instruments for the first time, it can take up to a minute before the time line displays useful information. iOS projects usually take longer than OS X projects, because it can take a while for the Simulator or a device to load and run an app. Instruments needs extra initialization time on top of this delay. Generally, startup isn't an instant process, and there's an ambiguous period after launch where it may not be clear if everything is running correctly. (It usually is.)
![]() TIP
TIP
You can delay recording and time line updates by selecting File⇒Record Options in the main Instruments menu. The options dialog box includes a start delay option, a time limit option, and a deferred display check box that disables data processing and display until the end of a run, minimizing the live processing overhead. Delay times can be set in seconds, milliseconds, microseconds, or nanoseconds. (You won't often use the last option.)
![]() CAUTION
CAUTION
In the first release of Xcode, Instruments sometimes fails to attach itself automatically to the iOS Simulator if you select Product⇒Profile. If this happens, attach manually instead.
Note that although you can scroll along the time line graph manually, Instruments doesn't necessarily keep a record of the statistics gathered at every point. Typically, the statistics remain frozen with the values they had at the end of the run. Although it would be useful to replay statistics manually, Instruments doesn't support this.
Selecting a trace template
To explore this process in practice, select the Project⇒Profile menu option in Xcode to create a profile build and launch Instruments.
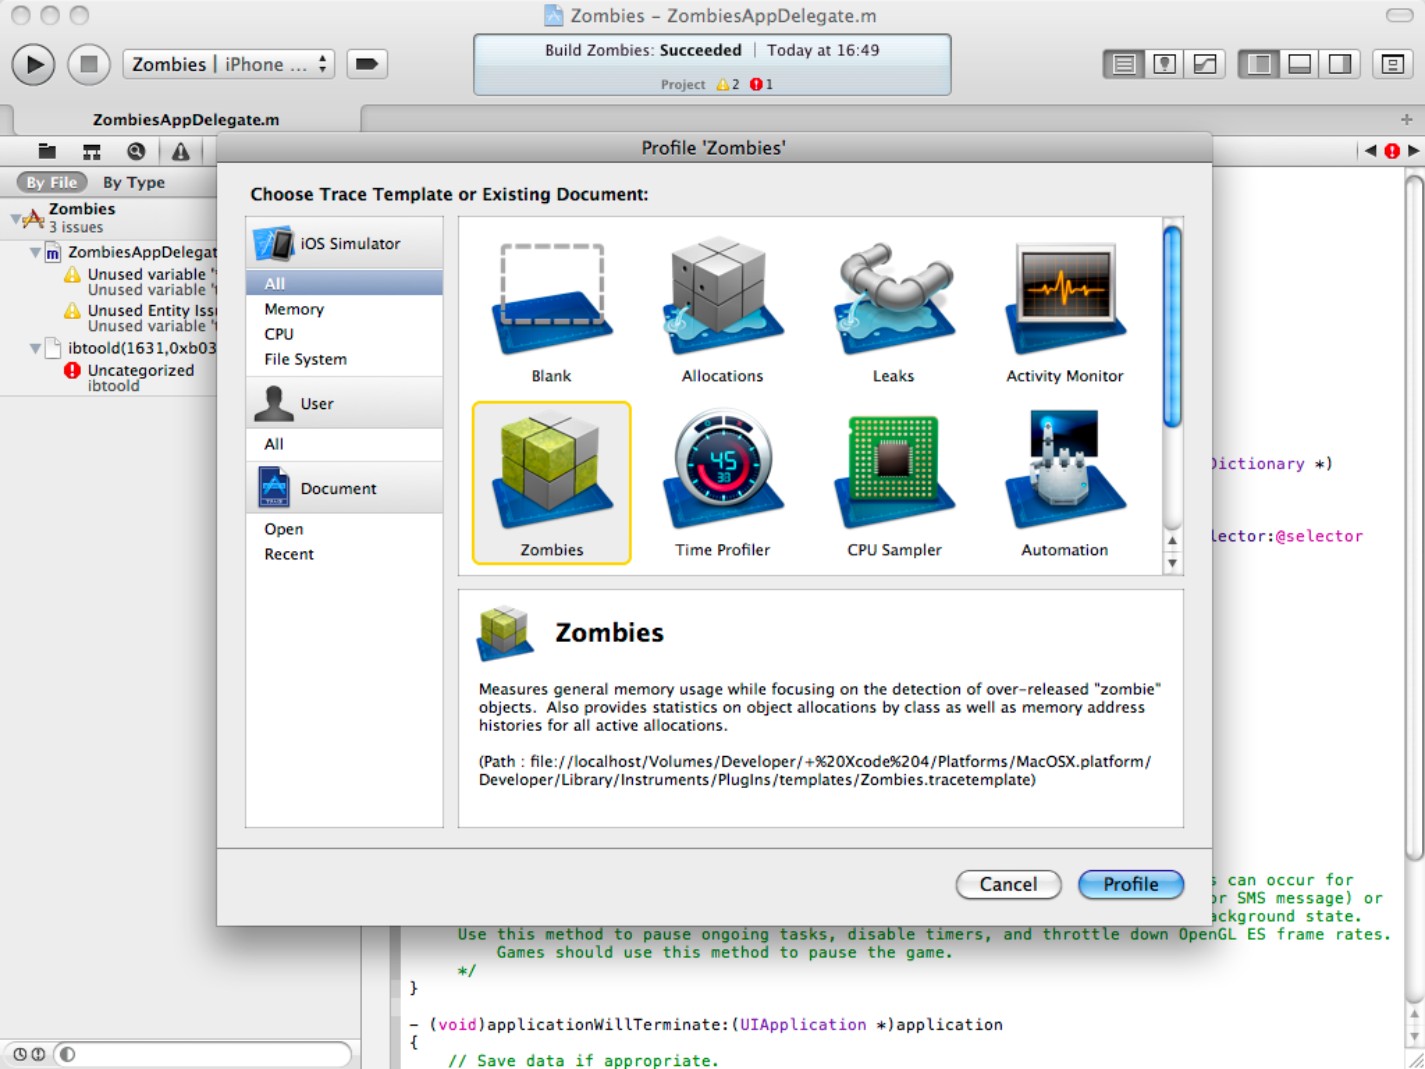
Figure 16.10 shows the Trace Template selection dialog box. Because this project is running in the iOS Simulator, Instruments has pre-selected the relevant iOS Simulator Instruments. The All option at the top left displays all available templates. You can filter them by selecting the Memory, CPU, and File System groups.
Figure 16.10
Selecting a template from the standard list

For this example, select the Leaks template. Click Profile. Wait while Instruments launches and initializes. Eventually, you see the display in Figure 16.11. The Leaks template includes two instruments: Allocations and Leaks.
Figure 16.11
A first look at the Leaks template

Understanding the time line
After the display is updating regularly, you can begin reviewing the output to see how it offers insights into the behavior of the app.
There are two areas of activity. The time line area shows an initial flurry of allocation events when the app launches and a steadily increasing series of events in the Leaks lane. The statistics show a much more comprehensive—and difficult to understand—list of information, which is described in more detail later.
The Leaks graph provides a clear indication that the app is leaking. But note that the graph doesn't exactly mirror the leak activity. You might expect the leak count to grow steadily, but by default, the graph is sampled every 10 seconds, so the leaks time line displays a summary view.
![]() TIP
TIP
In fact, you can change the sampling time to force the graph to update more frequently. For smaller apps the cost is a small performance hit. Select the Leaks instrument, and change the value in the box in the Sampling Options configuration under the Instruments list. The initial 10 second default is excessively long for many applications. As apps use more memory, the performance hit becomes more obvious, so use this feature with care.
Generally, the time line is best used for quick broad-brush overviews of app activity. It's not a precise diagnostic tool, but it does give you enough information to check whether more detailed investigation is necessary.
Getting started with the statistics
The statistics in the detail pane are the key to using Instruments productively. Where the time line provides an overview, the statistics provide extremely detailed information.
At first sight, the Allocations statistics may look complex, but the display is simply a list of all objects created by your app, with an associated instance count, and the instrument is literally monitoring and counting every object in memory.
A combined All Allocations summary at the top of the list counts the total number of objects and lists the total memory used. You can click each column header (Category, Live Bytes, # Living, and so on) to sort the list in various ways and to highlight aspects of the data.
![]() NOTE
NOTE
If you can't see the display shown in Figure 16.11, select the Allocations instrument at the top left of the time line pane and select Statistics and Object Summary using the menus under the time line.
![]() NOTE
NOTE
Allocations displays all objects and all low-level memory allocations. Many of the objects in the list aren't documented, because they are internal to the OS and are created and released at a low level. Typically, when you create a standard Cocoa object, the allocation code runs a number of low-level allocations and creates various other low-level structures and objects. Allocations lists them all separately.
As the app runs, you see that both the # Living and the # Overall counts for the All Allocations summary increase by one every second. The # Living column counts objects that are allocated and active. The # Overall column is a running total for the app, and it includes objects that have been released. Because our leaky app doesn't release any objects, the two numbers are identical. In a real project, the two numbers diverge almost immediately.
![]() CAUTION
CAUTION
Occasionally, you find that Apple's own iOS and OS X objects are leaking memory. When this happens, Instruments shows it clearly. But don't forget that in the application, the objects are organized in a hierarchy and not a linear list, and OS objects may leak memory at the malloc level. If your code is doing nothing while memory allocations are increasing, you're likely dealing with a genuine OS bug. You may not be able to see which object is causing the problem, because Allocations is reporting the problem as a low-level leak.
Monitoring specific objects
The unfiltered object list includes objects created behind the scenes by the OS. You don't usually need to monitor these, so instruments includes a powerful selection of filtering options that can help you focus on some objects while hiding others.
Use these options to show objects with specific names. Functionally, the various filters overlap, and there's usually more than one way to pick out individual objects from the list. It's up to you to choose the approach that works for you.
Selecting objects with the category list
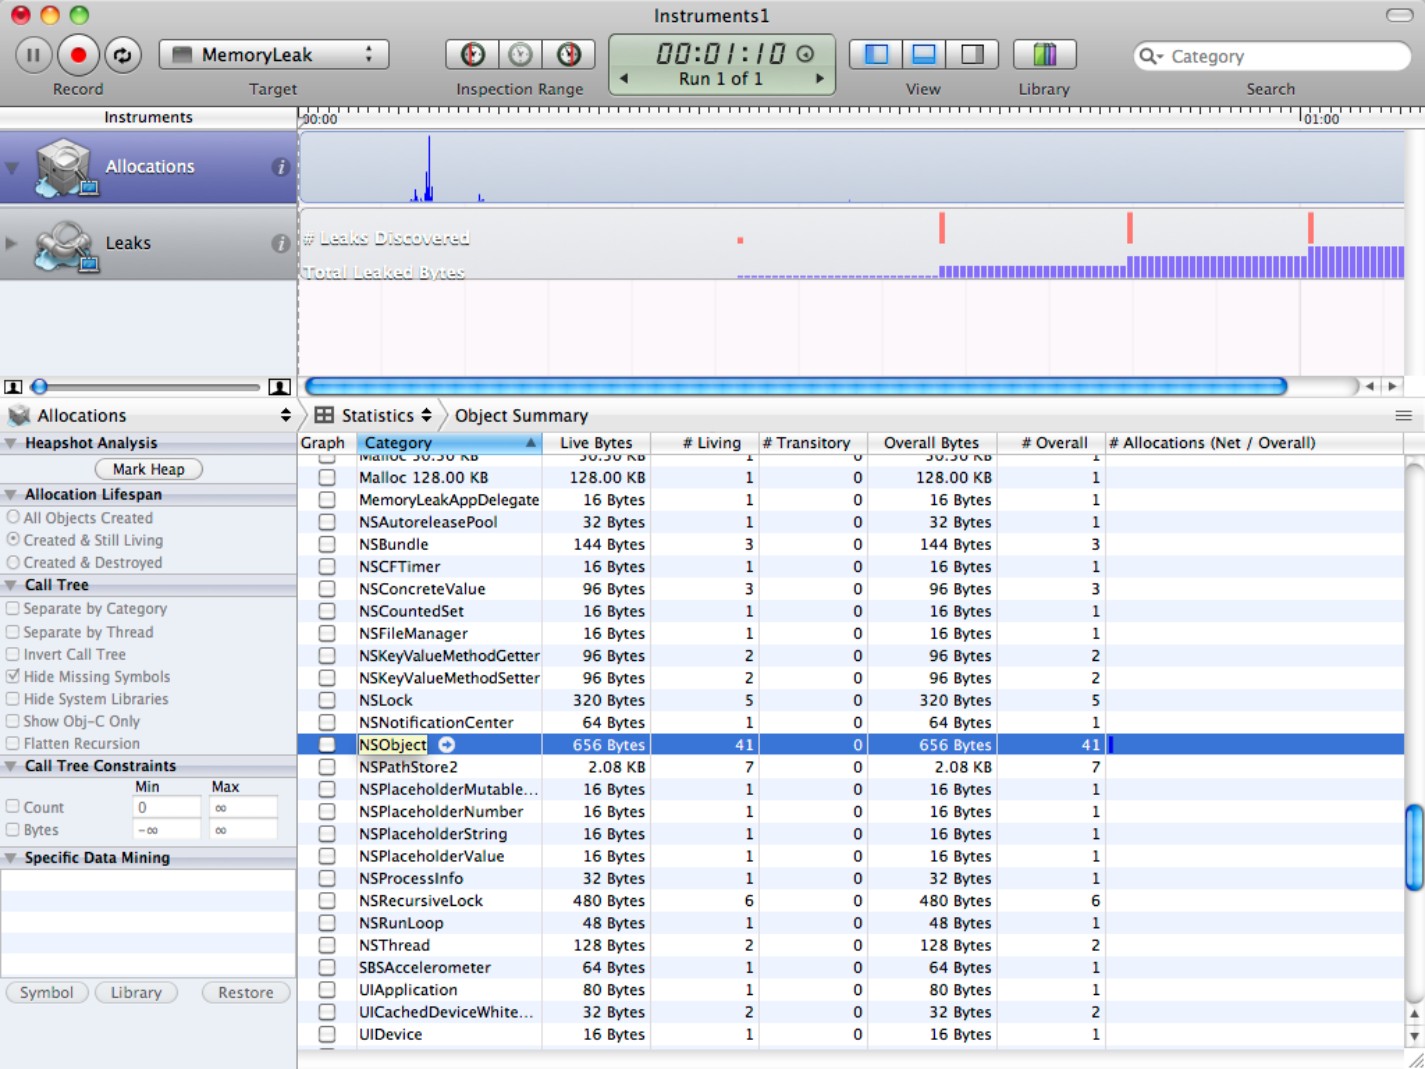
Select the Category column header to sort the object list alphabetically. Scroll down to find the NSObject entry, as shown in Figure 16.12. If you monitor this entry while the app is running, you see that its # Living and # Overall count both increase steadily.
Figure 16.12
Using the Category column to list objects alphabetically
Selecting objects with the search field
Figure 16.13 shows an alternative solution. Type one or more class names into the search field at the top right of the Instruments window, select the magnifying glass icon, and choose Matches Any. The main list is filtered to show the object names you entered. Use this approach when you want to monitor a small number of related objects.
Figure 16.13
Selecting objects with the search field

![]() CAUTION
CAUTION
There may be a difference between internal system object names and official documented object names. In Figure 16.13, you can see that searching for NSArray displays two related internal system objects that implement NSArray internally. These objects aren't mentioned in the documentation, but ideally you should know enough about Cocoa to understand what they do from the search context. This applies only when you're monitoring Cocoa and other system objects. Your own custom objects should have unique and unambiguous searchable names.
Listing object allocation events
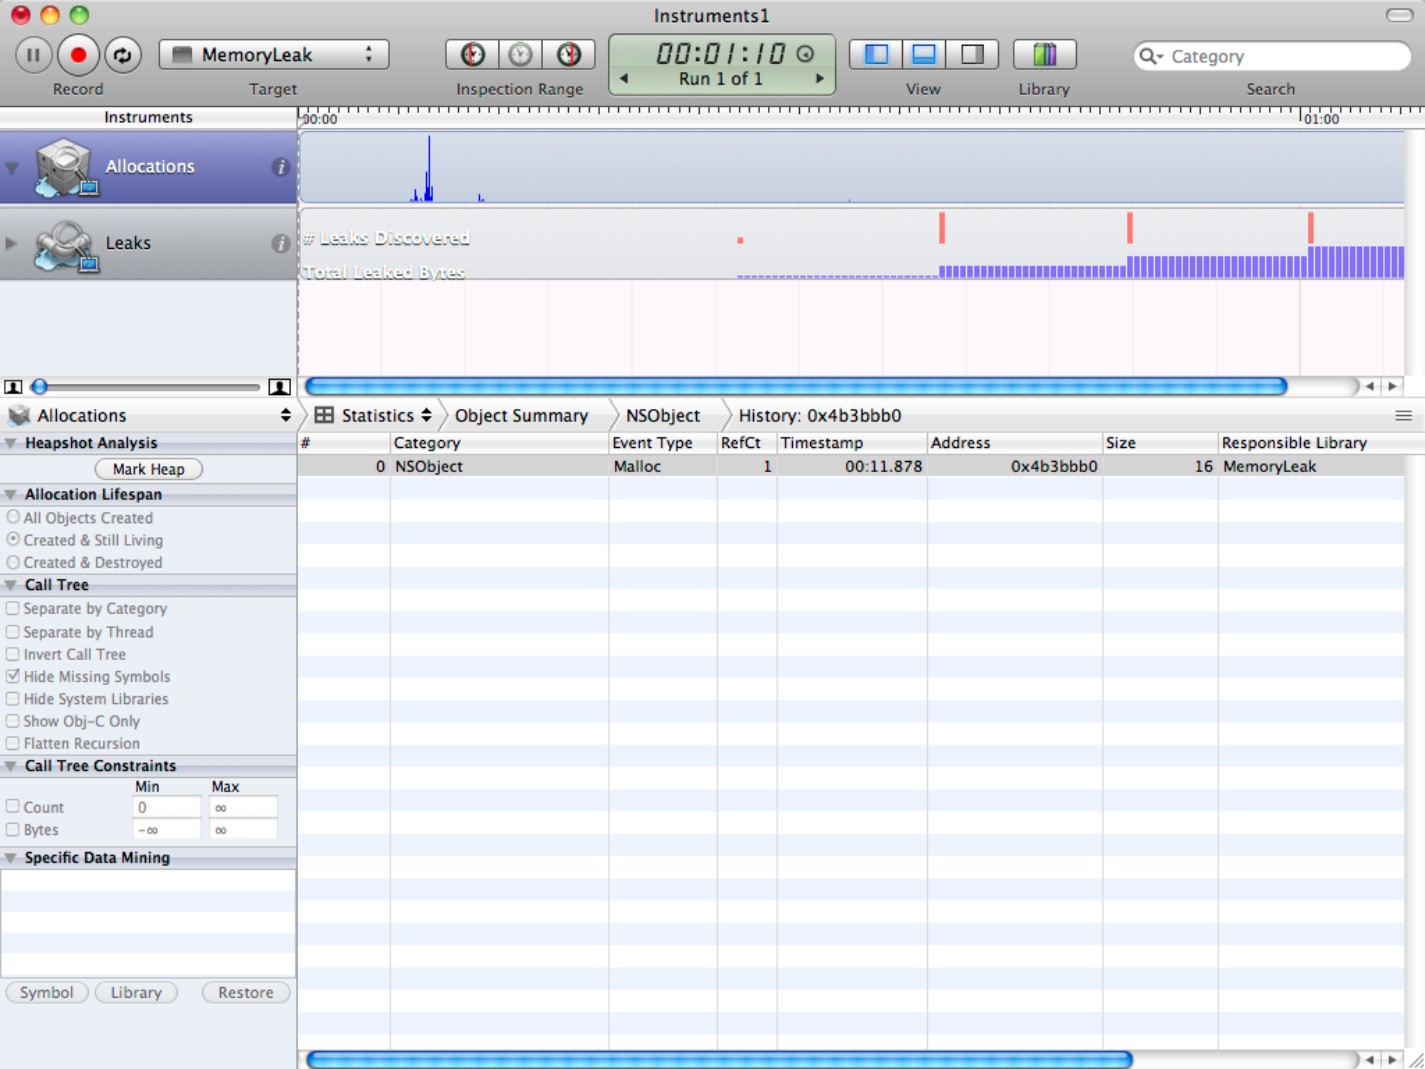
When you select an object, you can click the detail arrow that appears to its right to reveal a list of allocation events, as shown in Figure 16.14. The list includes an address, time stamp, and context for every allocation.
You can see from this list that the app is generating multiple NSObject allocations. Because all of them are live, it's not releasing them. Most of them are created in the timerDo method in the app delegate.
Figure 16.14
Listing objects of a single class with their associated allocation times, addresses, and the application/library and method in which the allocation occurred

In a real project, this kind of information can give you useful debugging hints, but even more detail is available. If you select the detail triangle next to an allocation event, you see the display shown in Figure 16.15. The critical column here is RefCt, which is the object's reference count.
The object view in the Allocations instrument is the only way to get a reliable reference count. Conveniently, you can view the counts of multiple objects simultaneously. This can be a lifesaver on projects with memory issues, because it gives you an X-ray of the app's memory events. You can interact with the app while it's running and monitor an object to check whether it's being allocated and released correctly.
![]() CAUTION
CAUTION
Don't forget that Cocoa may not release objects immediately after they receive a release or autorelease message. Depending on the context, some other object may be retaining your target object. Or it may simply take Cocoa a short while to run the release or autorelease code. However Cocoa handles an object, you can monitor it with Instruments.
Figure 16.15
Looking at a single object allocation to view the reference count
Viewing an allocation event stack trace
A related powerful option gives you precise information about the event that created an object. Select an allocation event, and click the extended detail icon in the toolbar—the one at the right of the group of three labeled View.
You should see the display in Figure 16.16. The stack trace lists the events that preceded the allocation. You can display further information in the trace; for example, you can list the Cocoa and OS libraries by name, highlight user and system events with different icons, and display file links to your source code.
The latter is an extremely useful option, but because it's buried so deeply, it's easy to overlook. Use the menu (refer to Figure 16.16) to enable every display option. Scroll down to item 5—the item that lists the allocation event in your code, marked with the head-and-shoulders user icon. Double-click the file link to the left of the icon.
Figure 16.16
Viewing an allocation stack trace

Viewing code from a stack trace
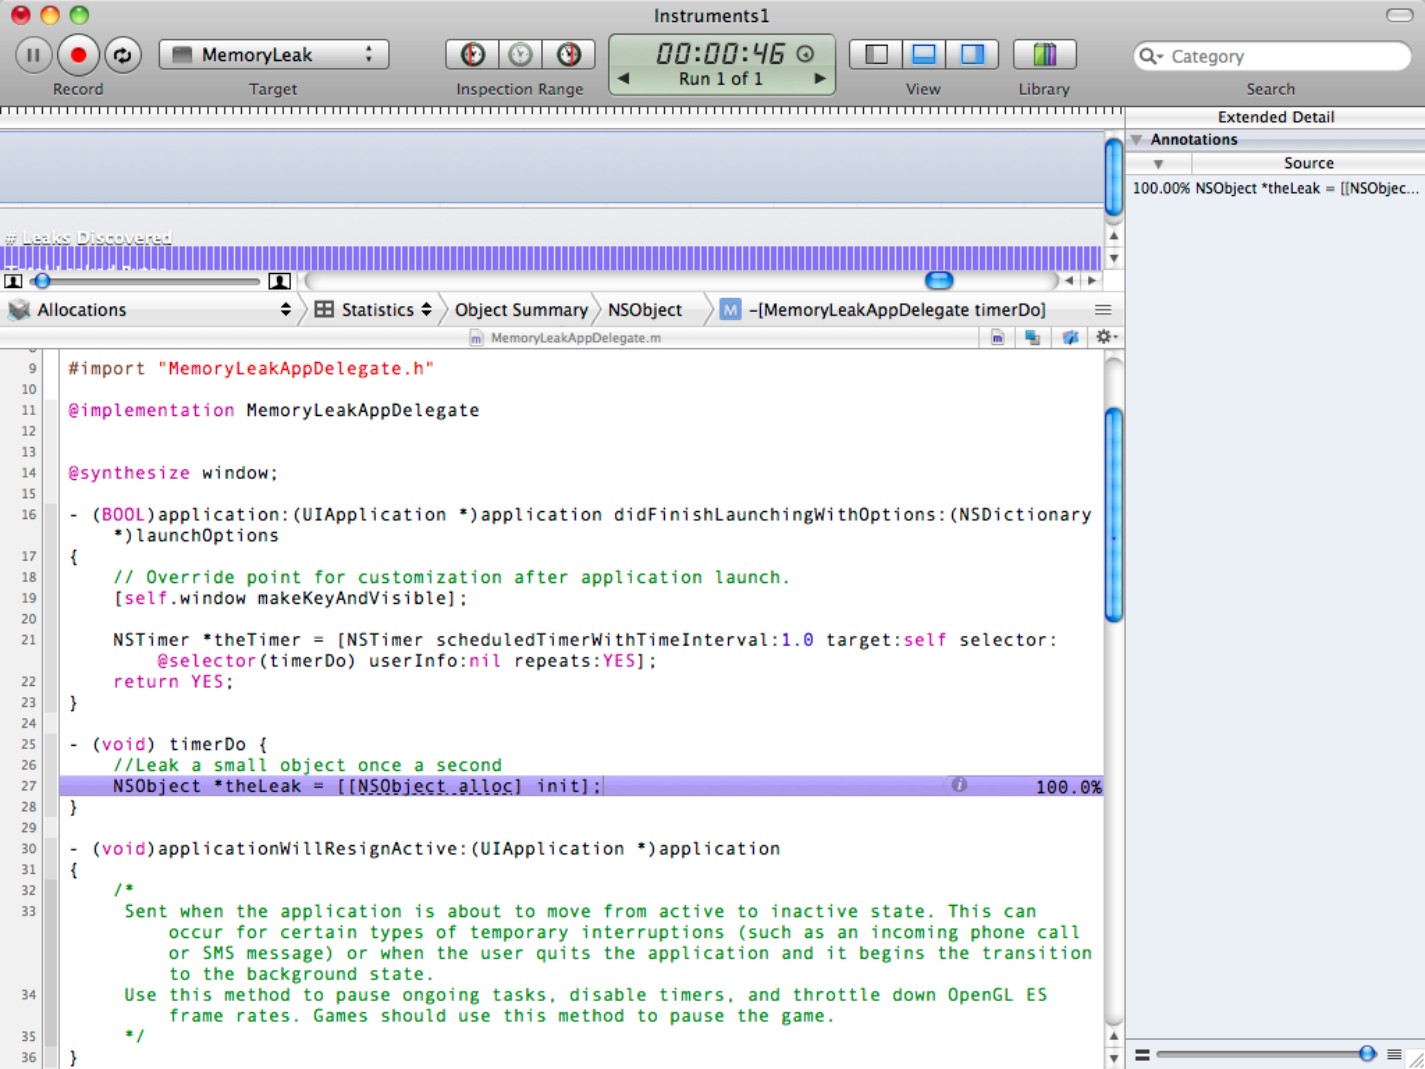
Instruments loads the source code and highlights the line associated with the event, as shown in Figure 16.17. You can immediately see where the object was allocated.
For an object that's still active—one with a retain count greater than zero and that hasn't been released from memory—the reference count display in Figure 16.15 shows the most recent memory management event. You can use the source code link feature in Figure 16.17 to find the code associated with that event.
![]() NOTE
NOTE
You can use this feature to monitor system objects. But if you try to jump into the source code, you see a short assembly listing, because naturally you cannot view or change the original system files.
Figure 16.17
Bringing it back to the source code
Using the Leaks instrument
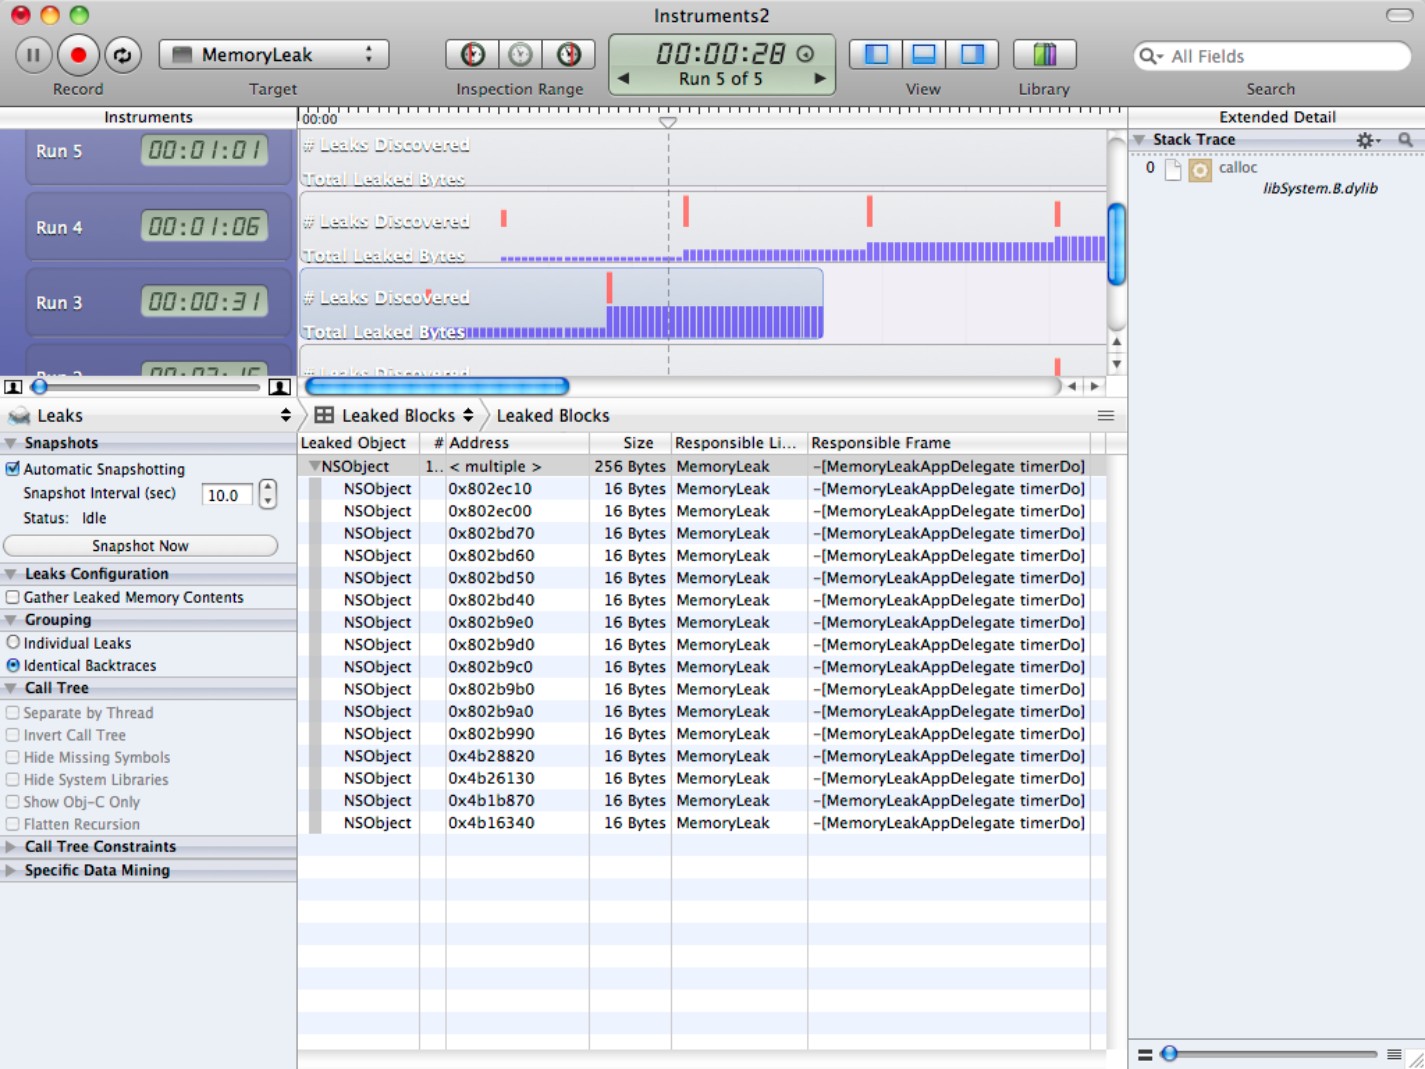
The Leaks instrument, shown in Figure 16.18, is a version of Allocations designed to display leak events only. The UI and features are similar—you can drill down to show source code in the same way—but only leak events are listed.
You can use either Allocations or Leaks to find leaky code. But because Leaks displays leaks without the clutter of surrounding allocations, it's a more efficient way to find and debug leak events.
Figure 16.18
Using Leaks to view leak events without other allocations
Managing zombies
Unfortunately, there's no way to view objects that have been freed; after they're gone, they're gone, and they no longer appear in any of the statistics. When you release an event and send a message to it, it becomes a zombie—an undead object that haunts memory and tries to eat your Mac or iPhone's brain. Because manual memory management is so tricky, Instruments include a special zombie monitoring tool to help you capture zombies before they get out of hand.
To illustrate this, the next example uses bad code to deliberately create a zombie and demonstrate how Instruments can highlight its location. Create a new Window-based iOS application, or modify the one you made earlier, changing the code in the app delegate to this listing:
#import “ZombiesAppDelegate.h”
@implementation ZombiesAppDelegate
NSObject *theZombie;
@synthesize window;
- (BOOL)application:(UIApplication *)application didFinishLaunchingWithOptions:(NSDictionary *)launchOptions
{
[self.window makeKeyAndVisible];
NSTimer *theTimer =
[NSTimer scheduledTimerWithTimeInterval:1.0
target:self
selector:@selector(timerDo)
userInfo:nil
repeats:YES];
theZombie = [[NSObject alloc] init];
[theZombie release];
return YES;
}
- (void) timerDo {
NSLog (@”Tick”);
[theZombie release];
}
The code creates an instance of NSObject and releases it immediately. The timer handler includes a duplicate release event. If you build and run this app without profiling it in Instruments, it crashes because the second release creates a zombie.
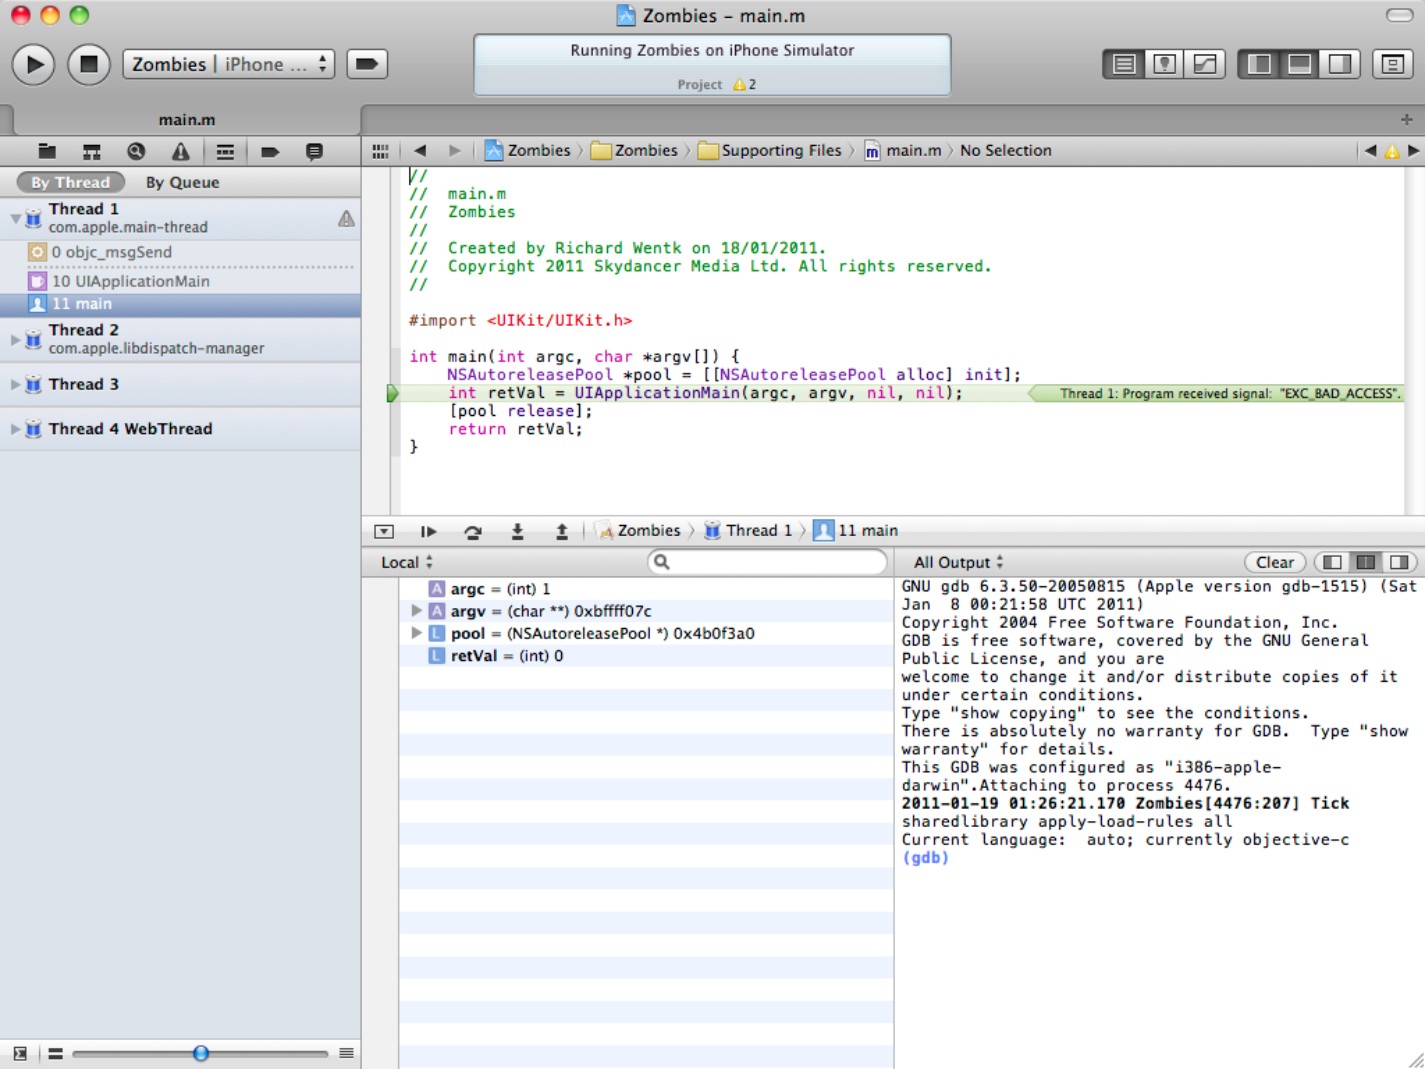
Figure 16.19 shows the result. You can see that the app crashed. But other than the EXC_BAD_ACCESS, which can be caused by various issues, there's nothing to suggest why it crashed.
![]() NOTE
NOTE
If you have some experience with iOS, you may know that the absence of a stack trace or console report often suggests a memory error. But there's nothing here to tell you where the error is located.
Figure 16.19
In this unhelpful crash report, Xcode doesn't give anything away about the cause of the crash.
To use the zombies feature, follow these steps:
1. Select Product⇒Profile in the main Xcode menu.
2. Choose the Zombies instrument, as shown in Figure 16.20.
![]() CAUTION
CAUTION
In iOS, the Zombies instrument is available only in the Simulator. It isn't included in the templates for an iOS device.
3. Wait for Instruments to load, and begin recording.
4. Authenticate when asked to.
The test app crashes almost immediately, and it can take a while for Instruments to catch up. Don't worry if you see the spinning beach ball while this happens; Instruments is working toward a useful display.
Figure 16.20
Selecting the Zombies instrument
Eventually, you see the display in Figure 16.21. The zombie event is tagged with a small red flag at the top of the time line and a floating pop-up that includes a short summary of the zombie event. The detail pane shows the history of the object and the reference count history of the history. In this example, the reference count history is very simple: The object is created, released, and released again. In a practical project, this history can be longer and more complex.
If you open the extended detail pane, you can see a stack trace for each event, as shown in the figure. Note that the Responsible Library and Responsible Caller fields are blank in the history table and that the stack trace doesn't include source code links. It would be useful if this information were available, but unfortunately it disappears when an object is released, and the zombies display doesn't include it. Instead, you have to work back from the hints you're given. For example, you might search the code for NSObject release events and monitor each event with a breakpoint.
Usually, there's just a single zombie event, because the app crashes immediately after it encounters one. It's possible, under special circumstances, to have more than one, and the Zombies instrument displays multiple red flags on the time line. You can view the contents of each by clicking it and using the Done button to hide the pop-up dialog box when finished.
Figure 16.21
Catching a zombie

Exploring the detail pane
When you've finished exploring zombies, note that the Allocations instrument can display even more information in the detail pane. The default view in the detail pane is called the Statistics view. But the pane can display allocation data in other ways. You can select the other options, described later, using the menu above the detail pane, as shown in Figure 16.22. Here's what's available:
![]() Call Trees: This displays a complete list of nested function and method calls. Use it with the Mark Heap feature, described later, to display a calling context for an active method. You also can view the complete call tree of the entire application. This gives you a very detailed view of the events in your app, but it's so detailed that it's rarely useful.
Call Trees: This displays a complete list of nested function and method calls. Use it with the Mark Heap feature, described later, to display a calling context for an active method. You also can view the complete call tree of the entire application. This gives you a very detailed view of the events in your app, but it's so detailed that it's rarely useful.
![]() Object List: This is a simple linear list of objects that can be sorted by memory address, category (name, for example), creation time, size, library, and calling context. It's identical to the object list introduced earlier.
Object List: This is a simple linear list of objects that can be sorted by memory address, category (name, for example), creation time, size, library, and calling context. It's identical to the object list introduced earlier.
![]() Heapshots: This creates a simple summary snapshot of heap (total memory) use. Click the Mark Heap button at the left to measure the heap. The Heap Growth column displays the difference between the current and previous heap sizes.
Heapshots: This creates a simple summary snapshot of heap (total memory) use. Click the Mark Heap button at the left to measure the heap. The Heap Growth column displays the difference between the current and previous heap sizes.
![]() Console: This displays a console window to monitor text output. You can select the application console or the main system console.
Console: This displays a console window to monitor text output. You can select the application console or the main system console.
Figure 16.22
Selecting other types of displays in the detail pane

Modifying instrument settings
When you load a template, the instruments it contains are initialized with default settings. You can modify these settings before or after a run by clicking the small information (i) icon at the right of the instrument to show an Inspector dialog box, as shown in Figure 16.23. Each instrument displays a different set of options. Some options are available for many instruments.
The settings inspector is easy to overlook, but it includes powerful features. Some common settings include the following:
![]() Target: By default, this matches the process or thread that Instruments is monitoring. Some instruments allow you to select a different process or thread with this menu, to enable simultaneous monitoring across multiple applications.
Target: By default, this matches the process or thread that Instruments is monitoring. Some instruments allow you to select a different process or thread with this menu, to enable simultaneous monitoring across multiple applications.
![]() Launch Configuration: These are general settings for the instrument.
Launch Configuration: These are general settings for the instrument.
![]() Track Display - Zoom: The Zoom option changes the vertical height of the time line. You can use it to emphasize the data from one instrument or to highlight activity at the lower scale of the display.
Track Display - Zoom: The Zoom option changes the vertical height of the time line. You can use it to emphasize the data from one instrument or to highlight activity at the lower scale of the display.
![]() Track Display - Style and Type: The Style and Type options can show cumulative or activity-summary views of the data. The Overlay type displays different runs on a single graph, while the Stacked type (which is preferred) displays a series of strips with the same vertical scale.
Track Display - Style and Type: The Style and Type options can show cumulative or activity-summary views of the data. The Overlay type displays different runs on a single graph, while the Stacked type (which is preferred) displays a series of strips with the same vertical scale.
Figure 16.23
Changing instrument settings with the inspector
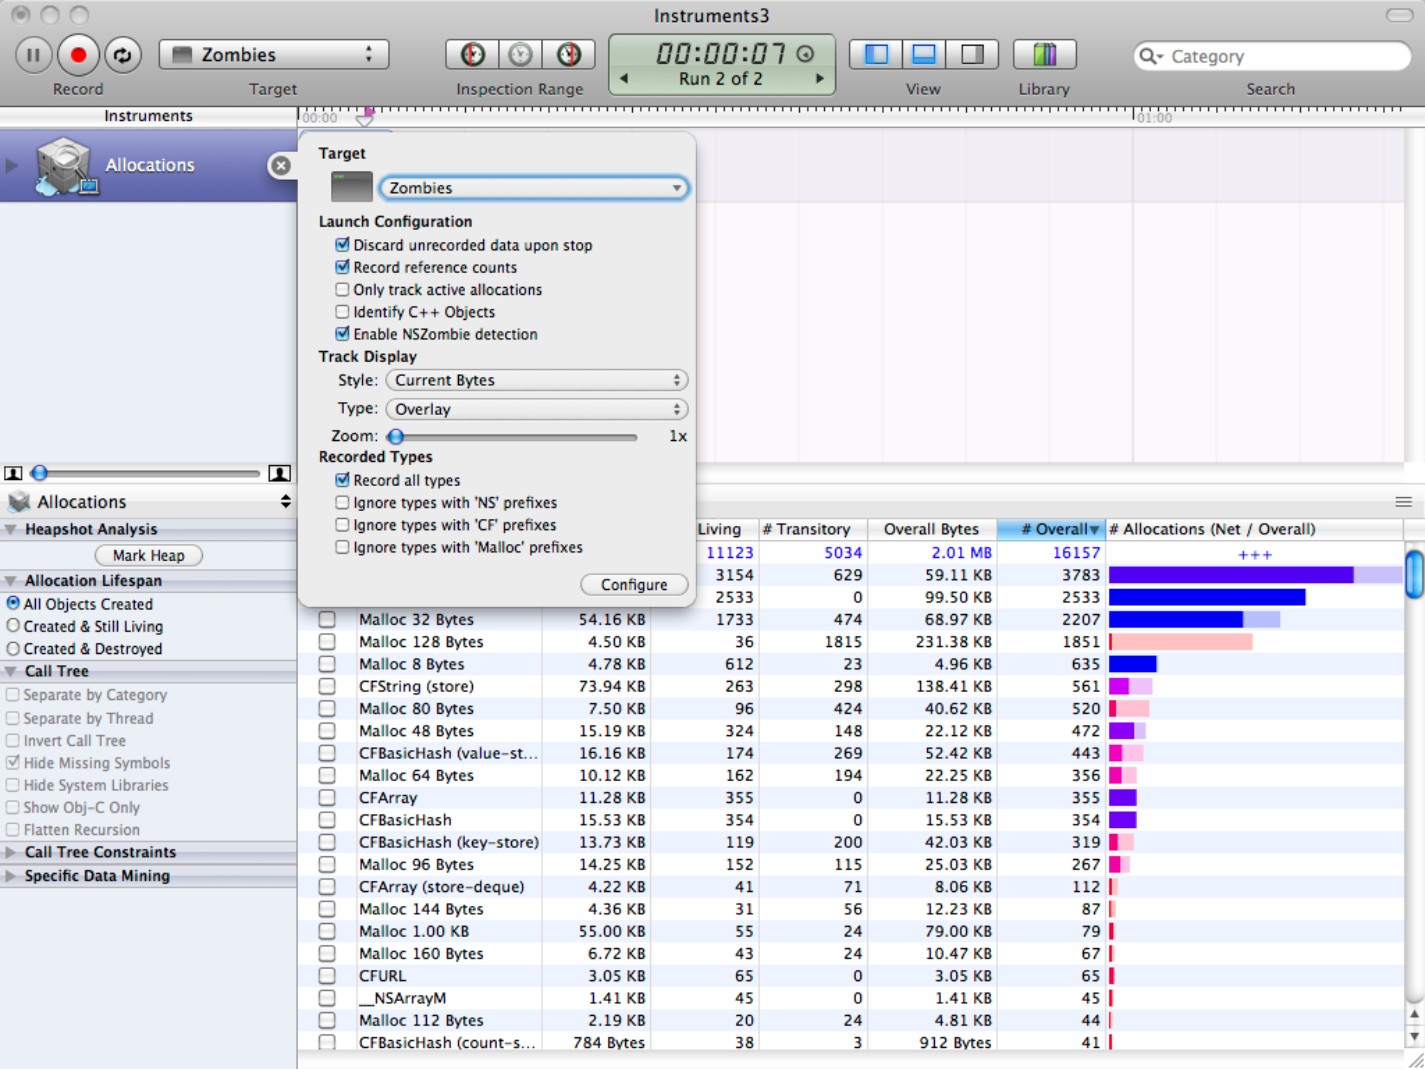
For the Allocations instrument, the remaining settings are unique. The Launch Configuration options for the Allocations instrument include a selection of check boxes. Most are self-explanatory. For example, the Record reference counts option does what you'd expect it to; if you uncheck the box, the instrument doesn't record reference counts.
![]() TIP
TIP
Note that Enable NSZombie detection turns on the zombie monitoring feature introduced earlier. There is no separate Zombies instrument; zombie detection is built into the Allocations instrument, and you can enable or disable it here. It's important to remember this if you create your own templates; otherwise, you'll look for a Zombies instrument and wonder why there isn't one.
The Recorded Types option enables crude but useful filtering of the objects list in the detail pane. Events tagged with Malloc are typically low-level system events, and they can clutter up the display, so it's often useful to ignore them. CF (Core Foundation) objects are slightly more complex, but they're still relatively low level. NS objects are Cocoa objects.
![]() CAUTION
CAUTION
Your custom objects are considered Cocoa objects. If you don't record NS objects, Instruments ignores them, even though their names may not begin with NS. But on iOS, objects that begin with UI aren't ignored. Also, you can set the Recorded Types options to filter out everything. If you do this, you'll see an empty yellow time line with a warning message.
If you click the Configure button at the bottom right of the inspector, it spins around to show the view in Figure 16.24. By default, this dialog box repeats the record/ignore options from the previous view, but you can use the add/remove icons under the table to add your own prefix strings for customized filtering. Most instruments include the Configure option, but as with the main settings, every instrument displays a different set of features on the flip view.
Figure 16.24
The other side of the inspector. Not all instruments implement this flip view feature. Each instrument displays different options.

Comparing different runs
To monitor a new run, click the Record button to stop a run, and click it again to begin recording. By default, you see a new set of tracks in the time line, and the description string under the main time counter changes to “Run N of N”, where N is the total number of runs.
To compare different runs, click the reveal triangle at the left of an instrument. The time line displays each run on a different track, as shown in Figure 16.25. Selecting each run in the time line displays its final statistics in the detail view. You can also select runs by clicking the forward/back arrows on each side of the “Run N of N” text in the time counter.
Figure 16.25
Comparing different runs

![]() CAUTION
CAUTION
Although each run in this example is identical because they all use the same zombies test app, you can see from the graphs how different the timing can be. Instruments must share Mac resources with other applications, including Xcode and the Simulator. The time taken to launch an app and begin recording events can vary dramatically. Generally, you can't rely on profiling for interactive time-critical monitoring, at least not for the first minute or so of each run.
Saving and loading runs
To save a run, select File⇒Save As from the Instruments menu. The current run is saved to a .trace file, with all the current settings and data. You can reload a trace with File⇒Open. After loading, you can record further runs. They're added to the data in the usual way. The original runs aren't deleted or modified. You can then resave the new file with a new name or overwrite the original.
Working with Instruments and Templates
You can use the templates to get started with Instruments. But to customize the testing with your own preferred mix of instruments, you must understand the difference between instruments, documents, and templates.
Understanding templates
The standard templates have three elements:
![]() One or more instruments
One or more instruments
![]() Default settings for each instrument
Default settings for each instrument
![]() An appealing graphic that appears in the standard template list on launch
An appealing graphic that appears in the standard template list on launch
The default templates are designed to create a selection of standard useful profiles. But you can create custom templates, with your own selection of instruments and settings. When you save a template, it's added to the user library. You can select one of the standard icons for the template when you save it.
Creating a template
To create a new template, select File⇒New in Instruments and select the Blank template. Click the Library button, and drag and drop one or more instruments from the list onto the Instruments column at the left of the Instruments window, as shown in Figure 16.26.
Go through each instrument, and change the settings to useful defaults. You can add multiple copies of the same instrument to the template with different settings. For example, you might add two copies of the CPU Monitor instrument and use the Configure options to display two different statistics in the time line, such as PhysicalMemoryUsed and PhysicalMemoryFree.
![]() CAUTION
CAUTION
Make sure you select only the instruments that match your target platform.
Figure 16.26
Creating a custom template

If you want to monitor different threads and processes in each track, set the Target menu in the toolbar to Instrument Specific. You can then select the targets for each instrument when the template loads.
Finally, use the File⇒Save as Template option in the main Instruments menu to save the new template. Click the triangle at the bottom right of the Icon box to select one of the standard icons. Give the template a memorable name.
As shown in Figure 16.27, when you create a new Instruments document, the saved template appears in the User section of the template list. To delete a custom template from the list, navigate to the path shown in the template description in Finder, and delete the file by hand.
![]() TIP
TIP
The Library window includes a terse description for each instrument in the list. You can find more information about each instrument, with selected extra details about parameters and settings, in the documentation under Tools & Languages⇒Performance Analysis Tools⇒Instruments User Guide⇒Built-in Instruments.
Figure 16.27
Loading a custom template

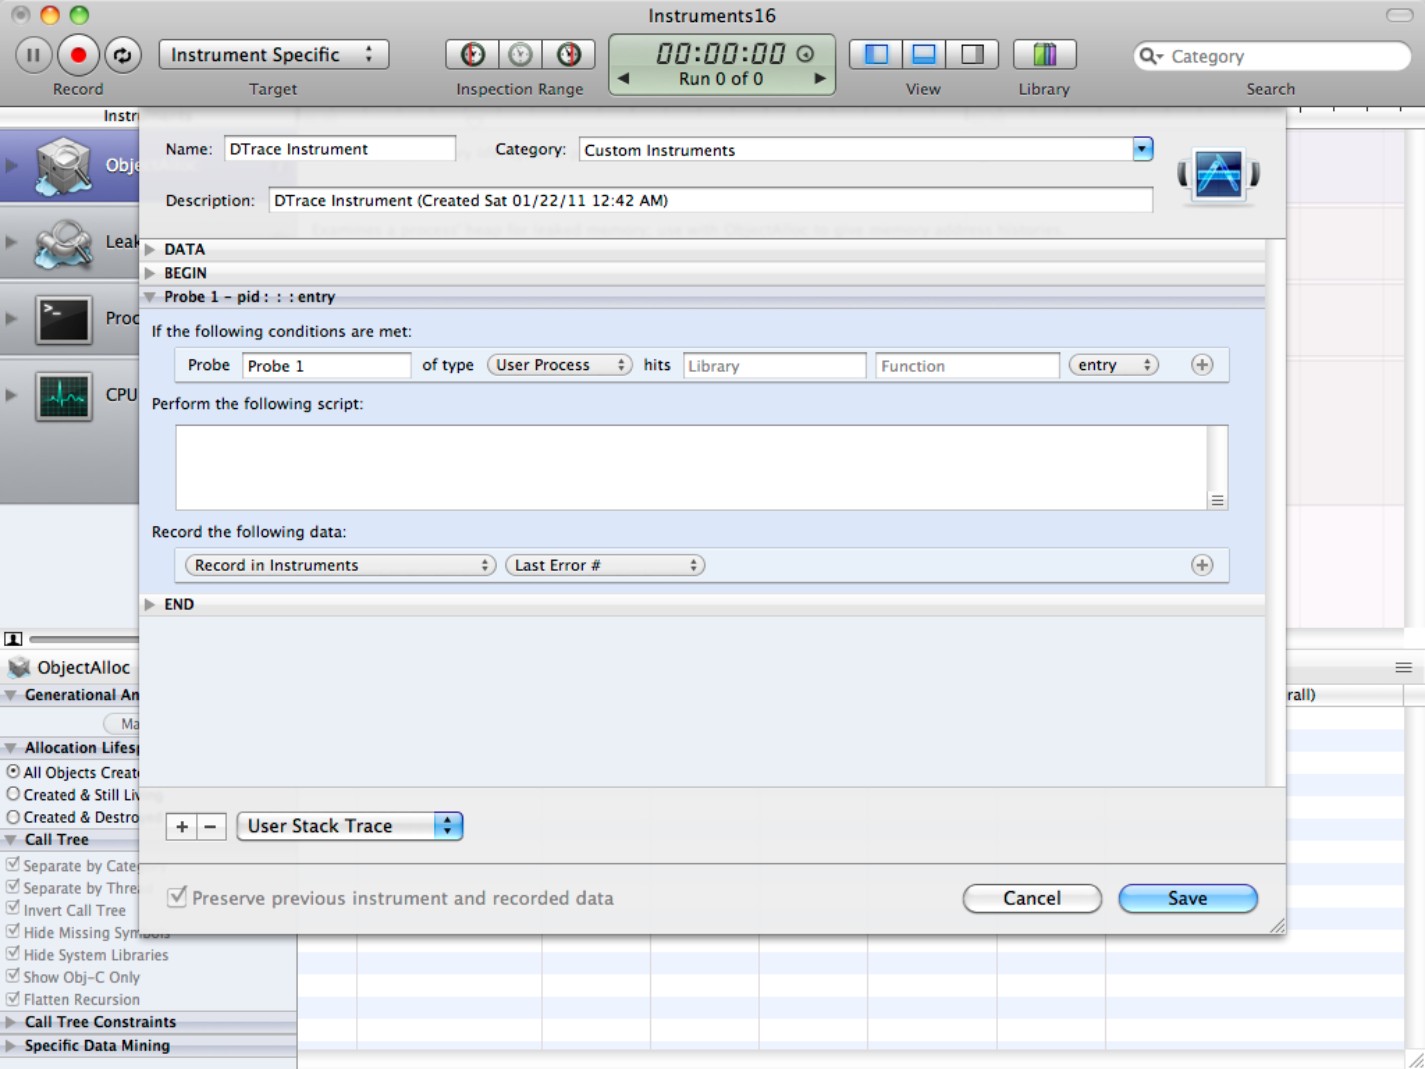
Creating custom instruments
You can create custom instruments to monitor OS features and other events that aren't included in the standard library. Instruments uses a technology called DTrace, which is outlined below. But you can create simple custom event monitors without understanding DTrace.
Select Instrument⇒Build New Instrument to display the custom instrument dialog box, shown in Figure 16.28. If you understand DTrace and the D scripting language, you can fill in the DATA, BEGIN, and END fields with custom code.
For a simple event monitor, you can enter a library and function name in the probe fields and select one or more parameters to monitor in the Record the following data: box. A more detailed primer on creating custom instruments is beyond the scope of this book. A basic outline is included in the documentation at Tools & Languages⇒Performance Analysis Tools⇒Instruments User Guide⇒Creating Custom Instruments with DTrace.
Figure 16.28
The custom instrument dialog box
Working with UIAutomation
It's often useful to send a sequence of test events to an app to check the UI for various possible errors and fail states. Instruments includes an Automation script player that can read a set of automation and test events from a file and send them as actions to an iOS app.
Test scripts are written in JavaScript and use the UIAutomation class. UIKit objects have a library of associated UIAutomation objects that can receive automation events. You can find the full list of objects in the UI Automation Reference Collection in the Xcode documentation.
Test scripts can be simple, or extremely complex. It's up to you to decide how you want to test your UI. The following example is very simple indeed, but illustrates the process of testing and can be expanded to create a more sophisticated test suite.
It's tempting to leave testing to the end of the development cycle, but it can be more productive to develop your test script as you develop. Testing adds some overhead, but if you combine automated testing with the unit testing described in Chapter 17 you can create a useful test suite that exercises the key features of your project and helps ensure that features aren't broken by updates and bug fixes.
![]() TIP
TIP
Most UI objects are subclasses of UIAElement. The documentation for UIAElement lists the messages you can send to objects as you test them. It's a good place to start when you begin using UIAutomation. (If you look at the object subclasses themselves, you won't find much of interest.)
![]() NOTE
NOTE
The Automation instrument is only available on iOS. For OS X, Instruments includes a simple UI recorder that can capture and replay user actions.
Setting up objects to support automation
The UI automation system doesn't use outlets or links. Objects are referenced in two ways:
![]() Views can be accessed through the application's view tree. With the correct code, views “just work.”
Views can be accessed through the application's view tree. With the correct code, views “just work.”
![]() UI elements must be modified in IB.
UI elements must be modified in IB.
To include an object in testing, select in IB and modify it as listed here and shown at the right of Figure 16.29:
![]() Make sure the Accessibility box is checked. (For many objects, Accessibility is on by default.)
Make sure the Accessibility box is checked. (For many objects, Accessibility is on by default.)
![]() Give the object a unique name in its Label field.
Give the object a unique name in its Label field.
The figure shows a very simple example with a single text field. A real UI is likely to have a longer list of UI elements, and you must repeat both steps for all of them.
Figure 16.29
Setting up a UI object to support test automation

![]() CAUTION
CAUTION
Don't enable accessibility for container views. If you do, automation can't find the UI elements inside them.
Creating a test script
In Xcode 3, you could load a script before launching the Automation instrument. It's possible Xcode 4 will restore the same approach at some point in the future, but at the time of writing scripts are managed in a less elegant and intuitive way.
The easiest way to create a test script is to create an empty file with a .js extension using an editor such as TextEdit. You can save the file anywhere. Your project directory is a good location because it guarantees you'll be able to find it later. Optionally you can include some test code in the file, but you'll be editing this file later within Instruments, so it's convenient to leave the file blank until you do that.
![]() NOTE
NOTE
Even though Automation files can be loaded into Instruments and saved in a project directory, they're not part of the project's code base. You can't edit them with the main Xcode editor, and there's no reason to add them to a build.
Launching the Automation instrument
Select Product⇒Profile and choose the Automation instrument, as shown in Figure 16.30.
Figure 16.30
Selecting the Automation instrument

At the time of writing this launches the instrument, and immediately begins recording—nothing. No script is selected, so Automation simply fills the time line with a blank rectangle.
Click the Stop button to stop the run. Wait while Instruments resets itself, then select the Choose Script option from the menu, as shown in Figure 16.31. Click Choose Script again and navigate to your script file in the file selector to load it.
![]() NOTE
NOTE
The first time you select the Choose Script menu, it has one item in it—the Choose Script option. Whenever you load a script, it's added to the list to this menu, so you don't have to navigate to it again.
Figure 16.31
Loading an automation script

Editing an Automation script
Select Product⇒Profile and choose the Automation instrument, as shown in Figure 16.30.
Click the Edit button and an edit window appears as shown in Figure 16.32. This window is part of the Dashcode widget editor described in Appendix A. It includes keyword highlighting for JavaScript and a script selection menu. But it's less sophisticated than the Xcode editor and lacks most of Xcode's features, including code completion, syntax checking, and automated indentation.
Even though it's limited, it's built into the Automation instrument; this makes it more convenient than an external editor.
Figure 16.32
Editing an automation script
Getting started with Automation scripting
Automation scripting is related to the Document Object Model (DOM) used to access the features of web pages. Like Objective-C, it uses objects and accessors, but the syntax is somewhat different. You don't need to create classes in your code, because they already exist.
Initializing the script
Scripts typically start with the following boilerplate code:
var target = UIATarget.localTarget();
var thisApp = target.frontMostApp();
var thisWindow = thisApp.mainWindow();
You can then use the object types listed in the documentation for UIAElements to return arrays of UI elements. For example:
var textfields = thisWindow.textFields();
returns an array of textfields. You can then access the textfields by the name you set in IB
textfields.[“aNameSetInIB”]…
or by the standard numerical subscript
textfields[0]…
The length function returns the number of items in an array.
Generating input events
You can set values for UI events by accessing their value property. For example
textFields[“username”].setValue(“Mr Anonymous”);
You can also automate button taps using the tap() function. For example
myButtons[“okButton”].tap();
An extended version of the same code can tap buttons on the built-in keyboard. For example
app.keyboard().elements().[“go”].tap();
taps the Go button.
If your application needs to wait after an event, use
target.delay(timeInSeconds);
Logging output
To log events and values, use calls to UIALogger, which displays messages in the script log window under the time line. UIALogger has various message levels, which force messages to appear in different colors. For example
UIALogger.logFail (“Something bad happened.”);
appears on the console in red.
Creating test scripts
Testing typically follows these steps:
1. Preset some UI elements with test values.
2. Perform an operation, sometimes using a button tap.
3. Pause if necessary.
4. Read return values and generate messages for pass/fail conditions or general reporting.
You can, of course, include various paths through the test sequence, depending on the test results.
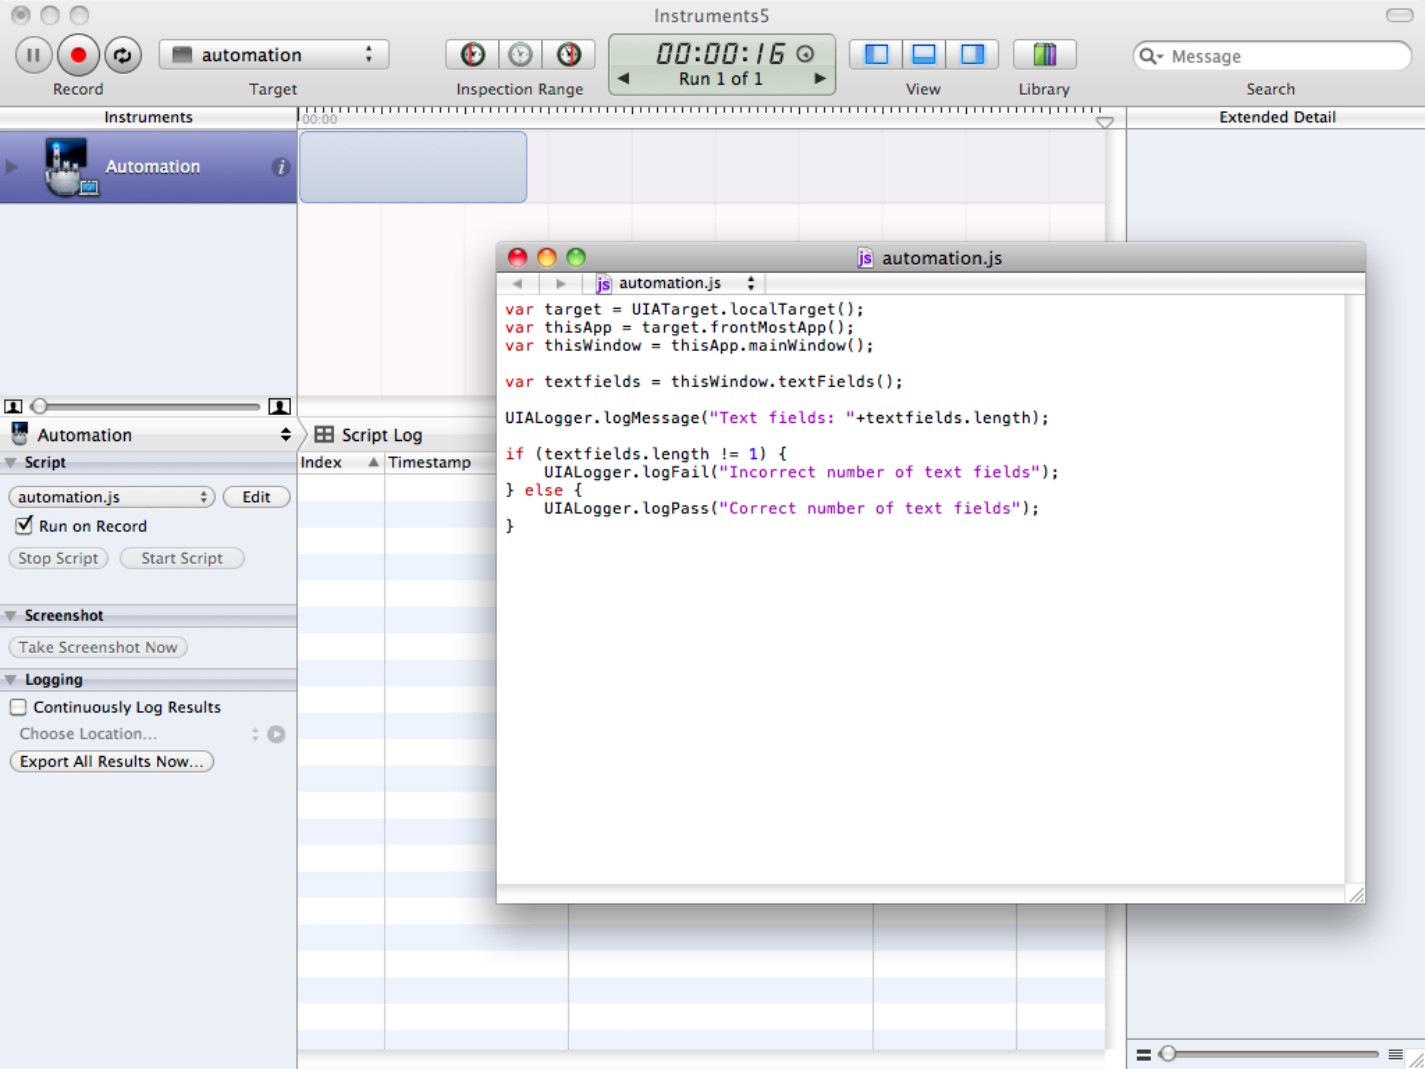
Figure 16.33 shows a trivial example that runs a very simple test. In this example the code is unlikely to fail, because the number of text fields is fixed. But in a more complex test it can be useful to report the number of items in a UI. For example, you can report the number of cells in a table view after loading data from a remote source.
Figure 16.33
The output from a very simple test script

![]() CAUTION
CAUTION
Scripts can be unpredictable, and features may not work as expected. It's a good idea to review the many online examples of scripting created by other developers before you begin creating your own. At the time of writing, scripting remains somewhat buggy.
Summary
This chapter introduced Instruments and explained how they can be used to aid debugging, testing, and performance profiling. It began by demonstrating how to launch Instruments when profiling a simple test app, and it outlined the key UI features.
Next, it delved in some detail into the Allocations and Leaks instruments, explored how to use them to monitor and debug memory problems in an active application, and explained how to look for lines of code that might be causing memory issues.
It introduced the Zombies template, explained how it was related to the Allocations instrument, and showed how to manage instrument settings and display options.
It demonstrated how to create and use custom templates for your own projects and touched briefly on creating custom instruments for advanced low-level monitoring and debugging.
Finally it introduced the Automation instrument and explained how you can use it to create automated test sequences for UIs.