
4 Power System Reliability and Reliability of Service
4.1 INTRODUCTION
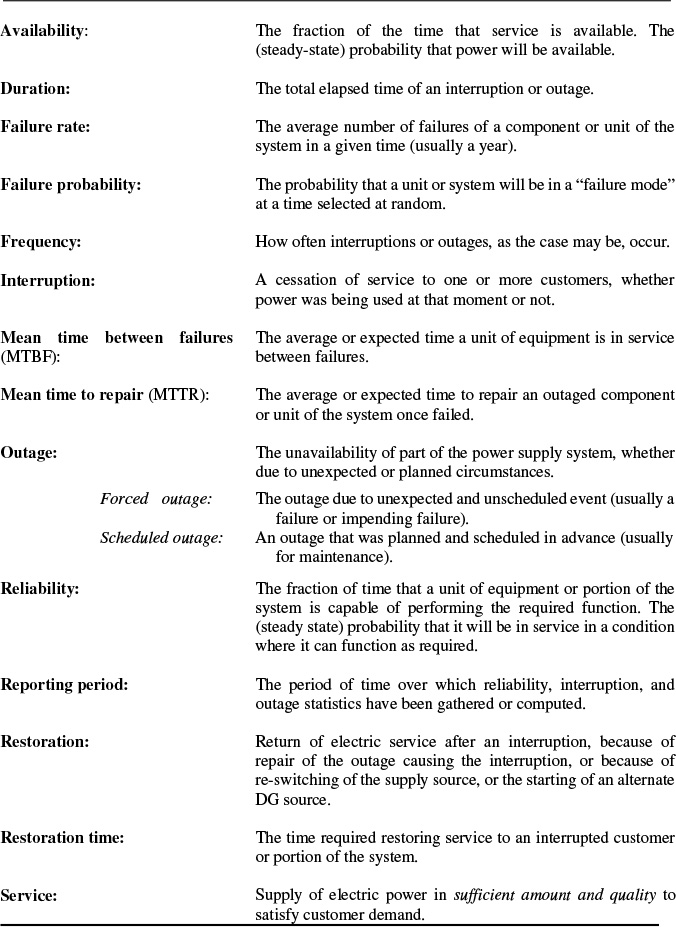
“Reliability” as normally applied by power distribution-utilities means continuity of service to the electric consumers. A 100% reliable power system provides power without interruption, power that is available all of the time regardless of how much and if the consumer is using it at any given moment. Almost anything less than perfection in this regard will garner complaints that the power supply is
“unreliable.” An availability of 99.9% might sound impressive, but it means eight and three quarter hours without electric service each year, nearly all electric consumers in North America would consider that a level of service unsatisfactory. That is why availability averages approximately 99.98%, or roughly 1.75 hours of unavailability per year. In the early 21st century, even this level of performance is becoming unacceptable to many energy consumers.
This chapter reviews power delivery reliability concepts in general and introduces the key components used in reliability analysis. Sections 4.2 and 4.3 cover equipment outages and service interruptions, the reliability indices used to evaluate reliability performance, and their application to electric utility systems. Section 4.4 covers various ways of setting reliability standards and design criteria. Section 4.5 discusses the cost of reliability, and the various types of tradeoffs made in design. Two-Q analysis of power systems is covered in Section 4.6. Section 4.7 concludes the chapter with a summary of the most important concepts in the chapter.
Table 4.1 Reliability Terms and Definitions
4.2 OUTAGES CAUSE INTERRUPTIONS
Table 4.1 provides a list of key reliability definitions. Among the most important are “outage” and “interruption.” Although often used interchangeably, they have far different meanings. “Outage” means a failure of part of the power supply system. For example, a line down, transformer out of service, or a breaker that opens when it shouldn’t. “Interruption” means a cessation of service to one or more customers. Interruptions are almost always caused by outages, and this leads many people to confuse the two words and their meanings. However, to understand power supply reliability properly, and more importantly, to set criteria and design a system to achieve high reliability, the distinction between outage (the cause of service problems) and interruption (the result) is critical. Electric service to a customer is interrupted whenever equipment in the line of supply to that customer fails or is otherwise out of service. Interruptions are caused by outages, but not all outages cause interruptions.
Frequency and Duration
Two different aspects of reliability receive attention in any type of power supply reliability analysis, whether of interruptions or outages. These are the frequency (how often something occurs) and duration (how long it lasts). With respect to interruption, frequency refers to the number of times service is interrupted during a period of analysis – once a decade, two times a year, five times a month, or every afternoon. Duration refers to the length of interruptions - some last only a few cycles, others for hours, even days.
Extent
Frequency and duration are important factors in reliability analysis and design, but there is a third factor equally important to the electric service planner because it is the one over which the planner has considerable control, particularly in the design phase. The extent of an outage’s impact on service – how many customers or what portion of the plant’s loads are interrupted by the outage of a particular unit of equipment – is the key to the outage-interruption relationship. The design of the electric power supply system greatly influences just how much interruption occurs when an equipment outage occurs.
The Distribution Planner has control over extent to which outages lead to customer interruptions. Among other things it is a function of how the distribution system is laid out. In general, a system laid out to minimize extent of outages from any failure will be more expensive than one that is not, but for the planner this means that consideration of configuration and its influence on reliability is just one more alternative to be considered in planning. In many cases a higher-reliability layout may be less expensive than any other way of achieving the particular reliability goal.
Most distribution systems use some form of radial feeder and secondary layout, which means that a single failure anywhere in the electrical path between substation and customer will cause service interruptions to all customers downstream. One way to improve reliability in such systems is to lay out the feeder trunk and branches, and arrange the protection (fusing) so that outages have a low extent (i.e., so that the average feeder segment failure does not interrupt service to very large numbers of customers).
Types of Interruptions
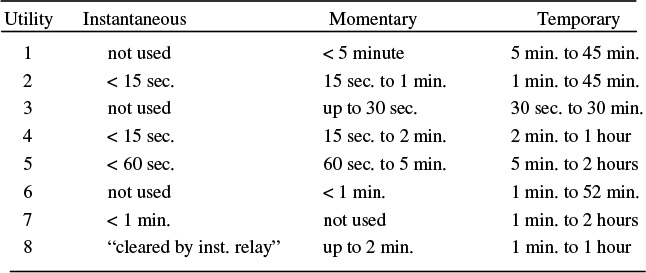
Interruptions are classified by their duration. Table 4.2 lists typical interruption definitions (see IEEE Gold Book for more information), with the times given being averages obtained by the authors in a survey of definitions and usage throughout the power industry. Electric service planners should keep in mind that practice and interpretation of reliability definitions vary greatly from industry to industry, from utility to utility, and from engineer to engineer.
In the authors’ opinion, the definitions shown are all somewhat unsatisfactory. The names imply that they relate to interruption duration, yet they are defined by equipment and operating factors, such as whether an interruption is restored automatically or manually. This, along with differences in exactly how the definitions are interpreted, means that the application of a particular definition, for example “momentary interruption,” varies greatly both in definition and therefore in how it is used.
Table 4.2 Traditional Classification for Power Supply Interruptions
Type |
Definition |
Instantaneous: |
An interruption restored immediately by completely automatic equipment, or a transient fault that causes no reaction by protective equipment. Typically less than 15 seconds. |
Momentary: |
An interruption restored by automatic, supervisory, or manual switching at a site where an operator is immediately available. Often defined as less than three minutes, but a proposal by an IEEE Task Force suggests standardizing on five minutes. |
Temporary: |
An interruption restored by manual switching by an operator who is not immediately available. Typically, 30 minutes. |
Sustained: |
Any interruption that is not instantaneous, momentary, or temporary. Normally more than an hour. |
Table 4.3 Duration Limits Used to Define Instantaneous, Momentary, and Temporary Outages at Eight Utilities
Perhaps most importantly, since these distinctions mean nothing to electric consumers, they do little to help an electric service planner improve quality from the consumer’s perspective. A four-minute interruption is a four-minute interruption, whether classified as momentary or temporary or permanent. Beyond the distinctions shown in Table 4.2, interruptions are classified into scheduled interruptions (the utility scheduled the interruption for maintenance purposes) or forced interruptions (the interruption was not expected and not scheduled). Implicit in these definitions, and the most important factor in the authors’ minds, is whether customers are informed reasonably far in advance of the details of any “scheduled interruption.”
Every planner should pay close attention to the definitions used by his company and by utilities and other players in any planning situation of collaboration. What appear to be identical indices can vary because of differences in how interruptions are defined. Many utilities do not include scheduled outages, storms, and other “non-failure-related” interruptions in their reporting procedures.1 Others leave momentary interruptions out of reported averages, or report them as a special category.
Every power system and DG Planner should bear in mind when working with reliability statistics that utilities that report a certain type of interruption statistic, such as number of momentary operations, vary widely in how they interpret that and other definitions. This is shown by Table 4.3, which lists interruption definitions from eight utilities in North America. They should also remember that utility customers and electric consumers do not really care about definitions and nomenclature. For them, an “outage” or “interruption” is anything that causes their equipment and facilities to stop working.
1 Most utilities remove “storms” from their statistics, arguing that natural disasters should be removed from statistics that are meant to measure their performance. However this practice has been carried to extremes and abused by some utilities. As Samuel Clemens once said, “There are three kinds of lies: Lies, damned lies and statistics.”
Such differences in definitions, interpretations, and reporting practices can frustrate planners who try to find some real meaning in comparisons between the reliability figures reported by different electric utility companies or by different industrial facilities. Worse, these differences often cause confusion and frustration among customers, regulators, and standards organizations.
Voltage Sags Often Look Like Interruptions
Many electric consumers report a momentary or “very short’ interruption when all that really occurred was a brief “voltage sag.” For example, during a fault (short circuit) on a distribution line, voltage on nearby circuits might drop to less than 70% of normal. Typically the fault would be cleared within less than a second, but this “blink” may be sufficient to halt the operation of computers, robotic equipment, and other digital systems. In that case, this short “voltage sag” is indistinguishable from a short, total cessation of voltage (an interruption). Either way, some critical equipment stops functioning.
The Computer and Business Equipment Manufacturers Association (CBEMA) has a recommended guideline on what voltage sags and surges should be tolerable to office and business equipment, as shown in Figure 4.1. The “CBEMA envelope” establishes a relationship between degree of voltage deviation and time.
The curve’s application is simple: if an event’s voltage deviation and duration characteristics are within the CBEMA envelope, then normal appliances should operate normally and satisfactorily despite it. But many appliances and devices in use are more sensitive than specified by the CBEMA curves and will not meet this criterion at all. Others may fail to meet it under the prevailing electrical conditions (i.e., line voltage, phase imbalance, power factor, and harmonics may be less than perfect).
The manner of usage of an appliance also affects its voltage sag sensitivity. The small circle in Figure 4.1 indicates an event that “crashed” a local net server (computer) at a hosiery plant. The event falls just within the CBEMA curve, and the computer’s manufacturer probably intended for it to withstand that particular deviation-time combination. However, the computer in question had been upgraded with three times the standard memory, a larger hard drive, and optional network cards, doubling its power usage and the load on its power supply. Such situations are common and mean that power systems that deliver voltage control within recommended CBEMA standards may still create problems for computers, robotic assembly tools, and other sensitive equipment.
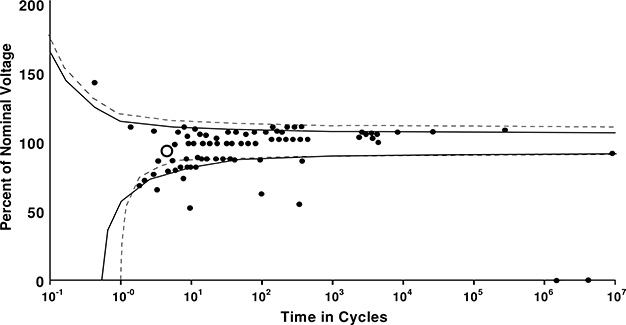
Figure 4.1 Data from 67 disturbances which occurred over a two-year period at a clothing factory, plotted against the CBEMA curve (solid line) and the actual requirement envelope of a digitally-controlled hosiery loom (dotted line). In many systems, about 40% of all voltage sags and 10% of all voltage surges lie outside of the CBEMA envelope. Small circle refers to event mentioned in text.
4.3 RELIABILITY INDICES
In order to deal meaningfully with reliability as a design criterion for distribution, it is necessary to be able to measure it and set goals. A bewildering range of reliability indices is in use within the power industry. Some measure only frequency of interruption, others only duration. A few try combining both frequency and duration into a single value, which proves to be nearly an impossible task. Some measures are system-oriented, looking at reliability averaged over the entire customer base. Others are customer- or equipment-oriented, meaning that they measure reliability only with regard to specific sets of customers or equipment. To complicate matters further, most utilities use more than one reliability index to evaluate their reliability. The large number of indices in use is compelling evidence that no one index is really superior to any other. In fact, the authors are convinced that no one index alone is particularly useful.
The basic problem in trying to measure reliability is how to relate the two quantities, frequency and duration. Are two one-hour interruptions equivalent to one two-hour interruption, or are two one-hour interruptions twice as bad as the one two-hour interruption? Most people conclude that the correct answer lies somewhere in between, but no two electric service planners, and no two electric consumers for that matter will agree on exactly how frequency and duration “add up” in importance. For one thing, the importance of frequency and duration vary tremendously from one electric consumer to another. There are some industries where a one-minute interruption of power will cause over ninety minutes of lost productivity. Computer and robotic systems must be reset and restarted, or a long production process must be cleared and bulk material reloaded, before the plant can restart at the beginning of a production cycle. For these types of consumers, five one-minute outages are much more serious than a single outage, even if it is five hours’ duration.
But there are other customers for whom short outages cause no significant problems, but who experience inconvenience during a sustained outage. This category includes factories or processes such as pulp paper mills, where production is only damaged if equipment has time to “cool down.” Interruption of power to a heater or tank pressurized for a minute or two is not serious (although it might be inconvenient), but sustained interruption allows a cool-down or pressure drop that results in lost production.
Over the last two decades of the 20th century, frequency of interruption became increasingly important to a larger portion of the electric power market. Before the widespread use of digital clocks and computerized equipment, few residential or commercial customers cared if power was interrupted briefly (for a few minutes at most) in the early morning (e.g., 3:00 AM) while the electric utility performed switching operations. It was common practice for utilities to perform minor maintenance and switching operations during that period to minimize any inconvenience to their customers. Today, this practice leads to homeowners who wake up to a house full of blinking digital displays and wake up later than they expected, because their alarm clocks did not operate.
The amount of power interrupted is also an important factor. Some reliability calculations and indices are weighted proportionally to customer load at the time of interruption, or to the estimated energy (kWh) not delivered during the interruption. However, the four most popular indices used in reliability analysis make no distinction of demand size. They treat all customers in a utility system alike regardless of peak demand, energy sales, or class. These indices are SAIFI and CAIFI, which measure only frequency, and SAIDI and CTAIDI, which measure only duration. Usually these four are used in conjunction – four numbers that give a rough idea of what is really happening to reliability system-wide.
These four indices, and most others, are based on analysis of customer interruptions during some reporting period, usually the previous month or year. All count a customer interruption as the interruption of service to a single customer. If the same customer is interrupted three times in a year, that constitutes three customer interruptions. If one equipment outage caused simultaneous interruption of service to three customers, that too is three customer interruptions.
System Average Interruption Frequency Index (SAIFI) is the average number of interruptions per utility customer during the period of analysis.
![]()
Customer Average Interruption Frequency Index (CAIFI) is the average number of interruptions experienced by customers who had at least one interruption during the period.
![]()
The “S” in SAIFI means it averages the interruption statistic over the entire customer base (the system), the “C” in CAIFI means it refers to only customers who experienced interruptions. Customers who had uninterrupted service during the period are precluded from CAIFI.
System Average Interruption Duration Index (SAIDI) is the average duration of all interruptions, obtained by averaging over all of the utility customers – those who had outages and those who did not.
![]()
Customer Total Average Interruption Duration Index (CTAIDI) is the average total duration of all interruptions, but averaged only over the number of utility customers who had at least one outage.
![]()
Momentary Interruption Index
Momentary Average Interruption Frequency Index (MAIFI) is the average number of momentary (and sometimes instantaneous) interruptions per utility customer during the period of analysis.
![]()
Often, momentary interruptions are not included in the SAIFI value reported by an electric utility. In such cases, total interruptions (from the consumer standpoint) are best estimated by the sum: SAIFI + MAIFI.
Load Curtailment Indices
In addition, a number of indices try to relate reliability to the size of customer loads, in order to weight the interruption of a large load more than a small load,
Customer load curtailment = duration of outagé kVA unserved. (4.6)
Customer Average Load Curtailment Index (CALCI) is the average kVA x duration interrupted per affected customer, per year.
![]()
Normal usage is often sloppy and informal
Even though the “S” in the terms SAIDI and SAIFI means, “averaged over the entire system,” some utilities internally report “SAIDI” and “SAIFI” values by feeder. While strictly speaking, SAIDI and SAIFI are the same for all feeders (they are computed by being averaged over the entire system), it is understood that what they mean is the average annual duration and frequency for customers on that feeder. Similarly, engineers at these and other utilities often use the two terms when they mean “duration” and “frequency” of interruptions for an area of the system or a small group of customers.
Analysis Using Reliability Indices
Reliability indices are used to evaluate historical and recent data to reveal trends and patterns, expose problems, and reveal how and where reliability can be improved. Any of the reliability indices discussed above can be tracked over time to identify trends that indicate developing problems. Figure 4.2 shows frequency of customer interruption (SAIFI) for one suburban operating district of a metropolitan utility on an annual basis over a 35-year period. The operating district was open farmland (no tree-caused trouble) up to 1962. At that time suburban growth of a nearby metropolitan region first spilled into the area, with much construction and with it the typically high interruption rates characteristic of construction areas (trenchers digging into underground lines, early equipment failures of new distribution facilities, etc.).
Over the following ten years, as the area plotted in Figure 4.2 gradually filled in with housing and shopping centers and construction and system additions stabilized, frequency of interruption dropped. Twenty years after the area first began developing, the interruption rate again began to rise because of two factors:
1. Gradually increasing cable failure rates due to age.
2. The effects of trees, planted when the area first developed, reaching a height where they brushed against bare conductors on overhead lines.
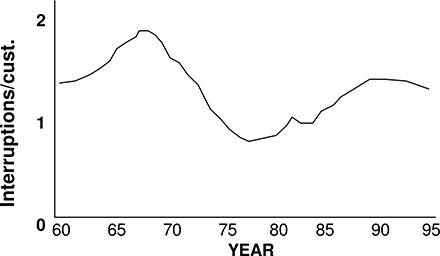
Figure 4.2 Three-year moving average of the annual number of interruptions for a region of a utility in the central United States. This area grew from open farmland into a developed metropolitan suburb in the period from 1962 to 1970, during which time interruption rate rose due to the problems common to areas where new construction is present (digging into lines, initial above-average failure rates for newly installed equipment). Twenty years later, interruption rate began to rise again, a combination of the effects of aging cable (direct buried laterals in some residential areas) and trees, planted when the area was new, finally reaching a height where they brushed against overhead conductors. The anomaly centered on 1982 was due to a single, bad storm.
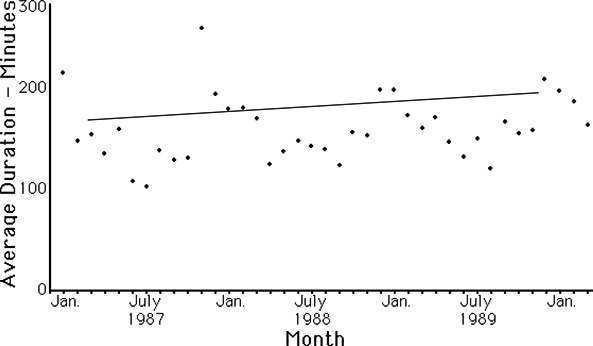
Figure 4.3 Average hours out of service per interruption on a monthly basis for a rural utility in the northern United States varies due to random fluctuations and changes in weather. It appears that duration of interruptions (dotted line) is slowly increasing over time, but further study is necessary before this conclusion can be confirmed.
Another obvious comparison to look at is the average duration of an outage, which is simply the total duration of all interruptions divided by the total number of interruptions that occurred during a period. Average duration of interruption provides an indication of how the utility is managing the entire process from trouble call to service restoration, as shown in Figure 4.3. The increase in outage duration during winter for this utility in the northern United States is clearly visible (winter storms stress repair resources and make travel to repair sites lengthier). A trend upward is discernible. Without additional study, it is not possible to determine whether this is due to an increase in the number of outages, a change in type (perhaps “serious” outages are occurring more often as equipment ages), or a less effective (slower) repair process.
4.4 RELIABILITY AND CONTINGENCY CRITERIA FOR PLANNING
Indirect Reliability Engineering: Contingency and Margin Criteria
The vast majority of electric utilities engineer reliability of service into their system indirectly, through the use of contingency design criteria. The utility maintains reliability goals and still measures and reports SAIDI, SAIFI and similar indices, but these values are not used directly as goals in the design process. Rather, adequate performance is achieved by applying contingency margin criteria which have been interpreted from those SAIDI and SAIFI goals and which are hoped to be appropriate. For example, distribution system engineers will apply equipment loading standards, design and layout guidelines, and switching and fusing rules, which limit the extent of outages and afford extra capacity to pick up outaged load by alternative means.
Contingency margin standards are designed to allow sufficient leeway for any unit of equipment to pick up load interrupted due to the outage of a nearby unit, and to permit reasonably quick (e.g., 15 or 30 minutes to an hour) switching. For example, a utility may establish a policy saying that its substations will always have two transformers of equal size each loaded to no more than 80% of its rating. During the outage of either transformer, the other can pick up both loads with an overload of 60%, an amount it should be able to sustain for two to four hours, time enough, hopefully, for the utility to take steps to handle the problem over a longer period if necessary. Similarly, a utility may ensure that every feeder will have three switchable portions, or zones, each of which can be divided and transferred to other feeders if its primary feed is out of service.
Such a policy establishes a certain type of design (two transformers per substation), loading standard (a transformer cannot exceed 80% of its rating), and feeder layout (three switchable zones) in order to leave sufficient margin for equipment failure and switching. Similar and compatible criteria are established for conductor loading, switch placement, and other design practices, all rules and standards that imply certain reliability results.
Contingency-based Planning Methods Have Weaknesses for Aging Infrastructure Planning
This type of engineering, called contingency-based engineering, is heavily involved with the entire aging infrastructure issue. Contingency-based engineering has sensitivities to high utilization rates for system equipment, and other factors that make it not as dependable as it was traditionally with respect to use as a necessary and sufficient design criteria. Chapter 8 will discuss this in considerably more detail, with examples.
Direct Reliability Engineering
By contrast, reliability engineering achieves the targeted level for availability in the system by actually computing the expected reliability of the power system based on detailed analysis of its equipment and configuration. Areas of equipment that do not meet the criteria are re-engineered until they do. In this approach, frequency and duration of service interruption are computed for each potential alternative design and compared to planning reliability targets to assure compliance with all new designs, additions, and operating changes. Use of reliability values directly as design criteria is not a widely used practice at the time of this writing. Instead, most utilities still use indirect criteria based on contingency margin, switching zone counts, etc., as described above. However, it can be expected that in the future many will choose reliability directly as a criterion for three reasons:
1) It addresses reliability needs directly from the consumer standpoint, rather than indirectly from the utility (equipment criteria standpoint), leading to improved quality assurance.
2) It imposes no restrictions on design other than that the final result meet criteria. This can lead to lower costs.
3) Dependable, proven methods to accommodate reliability-based design are becoming widely available.
Duration Is the Most Popular Criterion
Regardless of whether an electric utility tries to ensure adequate customer service availability by using indirect or direct reliability engineering methods, almost all maintain specific reliability targets as their performance goal. In order of importance or popularity as a design rule, the most widely used are:
SAIDI = the expected total time in a year that the average customer in the area being studied will be without available power
MaxD = the maximum expected total time in a year that any customer in the area being studied will be without available power
SAIFI = the expected number of times in a year an average customer in the system or area being studied will have power availability interrupted
MaxF = the expected maximum number of times in a year that any customer in the area being studied will have power availability interrupted
These reliability targets are applied within any study or design area as general targets that must be satisfied, much like standards of voltage drop, power factor, etc. In the design of any feeder, substation layout, or other addition to the distribution system, the planners use these criteria as design constraints. Any acceptable plan must have an expected average frequency and duration of interruption equal to or better than the corporate goals. Otherwise, the plan would dilute the system’s overall reliability. In addition, the expected maximum frequency and duration for any customer covered in the planning case must be less than MaxF and MaxD.
In general, Distribution Planning studies focus on small portions of the system, at most a few substations at a time. If every such area of the system is planned so that its frequency and duration of interruption fall close to the corporate SAIDI and SAIFI targets, reliability will be as evenly distributed as is practical throughout the system. The utility might still compute CTAIDI and CAIFI in its assessment of actual operating experience, to make certain results match its goals, but planners do not need to apply more than these four criteria.
Duration Is Equivalent to “Probability of Unavailable Power”
Some utilities use a simple “probability of being without power” factor as a design target. This is equivalent, in practice, to planning with duration of interruption as the target. For example, a criterion that calls for the outage probability to be no more than .025%, means that the customer will be without power no more than
8,760 hours x .025% = 2.16 hours/year (4.8)
Reliability Targets for DG Planning
Generally, distributed generation is not “distributed” over a large system like a distribution system, but is focused on one or a small number of customers. Thus, SAIDI and SAIFI are not really meaningful statistics to use in DG planning. Their equivalents in DG studies are the expected duration and frequency of unavailability. Again, often planners simply compute the expectation of total hours of outage, using this as the figure of merit in planning.
Tiered Reliability Areas
In a few cases, a utility will designate different frequency and duration targets for urban and rural areas. For example, its reliability criteria may specify part of the service territory as “urban” with SAIFI and SAIDI targets of 1.0 interruptions and 50 minutes/year for the system within that region. The rest of the system would be characterized as “rural” and designated with SAIFI and SAIDI rates of 2.2 and 150 minutes respectively. Such a tiered reliability design structure merely recognizes a common and long-standing characteristic of most utility systems – service reliability is lower in sparsely populated areas than in densely populated ones.
This disparity between urban and rural standards does not imply that rural customers are less important, nor is it due to inattention on the part of the utility or to poorer design practices applied to rural areas. The cost of reliability enhancement in rural areas is higher, because of the great distances involved, and the fact that the higher cost must be spread over fewer customers per mile of line. Most rate-design and regulatory processes do not consider it equitable to spread the cost of upgrading service in these rural areas to the same standards achievable in urban areas over the entire rate base (i.e., to those who live in the cities, too). Thus, a higher frequency of interruption and longer interruptions in electric service, are among the expected pleasures of rural life.
Predictive Reliability Analysis Methods
For planning purposes, reliability analysis normally focuses on comparing the expected reliability performance of different candidate designs. Plans are evaluated and compared to determine which is less likely to fall short of required capacity. Reliability is only one aspect of planning evaluation: cost and other factors enter into the final decision too, often with reliability vs. cost being the major design compromise the planner must consider.
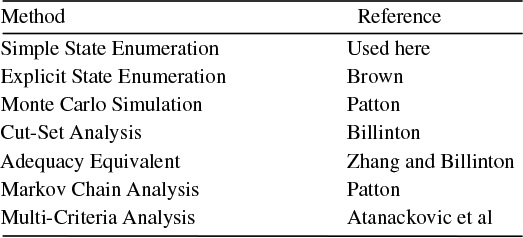
Table 4.4 Reliability Evaluation Methods
Failure: when capacity is less than load
Generally failure states for a power system include all those conditions in which the demand for power (load) at a site exceeds the available supply of power to that site. At the distribution level, failure conditions are generally easy to identify. Since distribution circuits are usually radial, a simple “loss of connectivity” analysis is sufficient to identify outages that lead to failure. For distributed generation, the situation is far more difficult to analyze. Given several generators at a site, service might be maintained even if one or two are out of service. Various combinations of units in service, and their probability of occurrence, have to be evaluated against load curve shape. Methods to do so will be demonstrated in Chapters 13 and 16. Reliability evaluation of an entire power system is more challenging still, due to the number of combinations of sources and paths. Even a small power system with less than 70 generators and 100 lines, can become a considerable challenge (Zhang and Billinton, 1997).
Reliability Evaluation Methods
Literally hundreds of technical papers, and quite a few books, have been devoted to power system reliability analysis. Table 4.4 provides a summary of the methods along with references on each. But despite this diversity in the technical, numerical means of approach, reliability analysis for planning falls into two functional categories:
1. Historical Assessment Methods analyze historical operating results to determine the cause of past reliability performance problems and to infer the base equipment failure rates and reliability factors. For example, “Based on historical analysis overhead lines are likely to fail once every five years and require an average of five hours to repair.”
2. Predictive Reliability Methods estimate the reliability expected from a candidate design or system configuration. These are used by Planners to determine if a change in design, for example a “fix” to a reliability problem, will give sufficient availability of power.
Application of Probabilities
Almost all reliability prediction methods apply some form of analysis based on probabilities. A few rare methods based on adaptive pattern recognition do not. But the basis for what most methods apply as reliability, the way they apply it, and the detail and representations used in that application, vary greatly among methods. This makes it crucial to pick a method tailored to a situation’s particular needs. For instance, some methods analyze the probability or the expected amount of time that power is unavailable at a particular point in the power network. They estimate the total amount of time that power will be unavailable
(e.g., .03%, equal to 2.6 hours per year). Others predict the mean time between failures and expected time to repair or restore power in each case.
The best of these methods can estimate both the expected average frequency and duration of interruption for any particular candidate system /DG design (e.g., power is expected to fail on average twice a year and take an average of 1.3 hours to restore each time). Still more complicated methods predict the expected probability for both frequency and duration of interruptions. For example, power is expected to fail twice a year, but there is a 5% likelihood it could fail four times in a year - the average duration is expected to be 1.3 hours, but there is a 25% likelihood an interruption could last more than ten hours. But almost without exception, the more comprehensive methods require more data, involve more involved mathematical methods, and are more sensitive to details or implicit assumptions.
These various reliability prediction methods differ in the degree of approximation; the type of system they can analyze; and the type of reliability evaluation they provide; their complexity of analysis; and data requirements. In addition many methods are most appropriate for application to one type of system design (e.g., network, radial) or under certain conditions (only one source of supply but many available power transmission paths). The choice of reliability assessment method depends on all these factors, as well as the degree of detail sought by the planner.
In most places throughout this book, the authors will use a simple reliability assessment method that computes only the expected time power is unavailable, not the frequency and duration. This method is general enough for our examples and much simpler. In many cases, merely adding together the probabilities of rare occurrences, rather than considering that they could overlap further approximates reliability analysis.
4.5 COST IS USUALLY THE MAJOR CONSIDERATION
Quantity and quality both have value for the electric consumer. But so does the consumer’s money and as a result, no factor in the decision about energy source and energy usage is more important to most consumers than cost. Chapters 4 and 5 will deal with planning, cost evaluation, engineering economics and decision making. The authors have included this short section to emphasize the point that quantity, quality, and above all, cost, form the basis for the market’s evaluation of suppliers and technologies, and that a competitive, deregulated electric industry will no doubt respond by offering options with respect to reliability and power quality.
The three dimensions of power – quantity, quality, and cost – form a “value cube” that determines the overall benefit consumers see from the use of electric power (Figure 4.4). The importance of each in determining what is “best” will vary from one consumer to another.
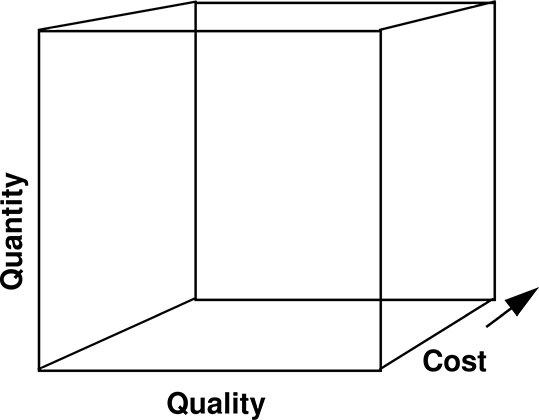
Figure 4.4 Ultimately, the value electric power consumers see in their electric power supply is based on a “value volume” of three dimensions: quantity, quality, and cost.
Electricity Pricing Has Traditionally Been Based Only On Quantity
Traditionally, the price of power in the electric utility industry was based solely upon the quantity used. A consumer would pay more if he or she used more power and less if their use was less. Except in rare and specially treated cases, an electric utility would offer a “one size fits all” level of quality. Customers got what was available, whether or not they needed and would have paid for higher quality, or whether they would have preferred a discount even if it meant somewhat lower quality.
The Market Comb
Numerous surveys and customer focus meetings conducted by utilities, consultants, and research firms (including the authors’ firm) indicate that electric consumers differ widely in their need for, and their willingness to pay for, reliability of service. Consumers also differ in exactly what “reliability,” and in a broader sense, “quality,” means to them, although availability of service, quick and knowledgeable response on the part of their supplier, and power of a usable nature are always key factors in their evaluation.
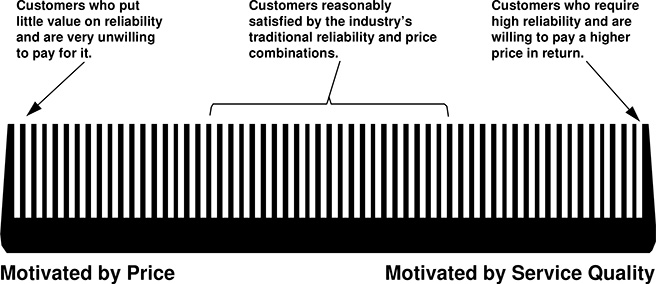
Figure 4.5 The electric marketplace can be likened to a comb: composed of many small niches, each made up of customers who have a different need for and cost sensitivity to reliability of service. Even those who put a high value on reliability may differ greatly in how they define “good reliability,” one reason why there are no broad market segments, only dozens of somewhat similar but different niches.
As a result, the electric power demand marketplace can be likened to a comb as shown in Figure 4.5 with a series of small niches, that vary from the few customers who need very high levels of reliability, to those who do not need reliability, only power, and are motivated purely by lowest cost.
Offering Variable Levels of Reliability
Traditionally, electric utilities have not offered reliability as a price-able commodity. They selected equipment, and designed and engineered their systems based on engineering standards that were aimed at maintaining high levels of power system equipment reliability. These standards and methods, and the logic behind them, were actually aimed at minimizing utility equipment outages. The prevailing dogma maintained that this led to sufficiently high levels of reliable service for all customers and that reliable service was good. This cost of the reliability level mandated by the engineering standards was carried into the utility rate base. A utility’s customers basically had no option but to purchase this level of reliability (Figure 4.6). Only large industrial customers, who could negotiate special arrangements, had any ability to make changes bypassing this “one-size-fits-all” approach to reliability that utilities provided.
The traditional way of engineering the system and pricing power has two incompatibilities with a competitive electric power marketplace. First, its price is cost-based; a central tenet of regulated operation, but contrary to the market-driven paradigm of deregulated competition.
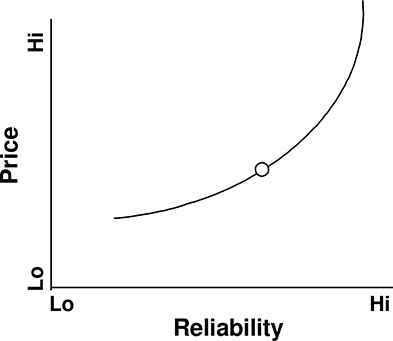
Figure 4.6 Generally, the cost of providing reliability in a power system is a non-linear function of reliability level: providing higher levels carries a premium cost, as shown by the line above. While reliability varies as a function of location, due to inevitable differences in configuration and equipment throughout the system, the concept utilities used was to design to a single level of reliability for all their customers.
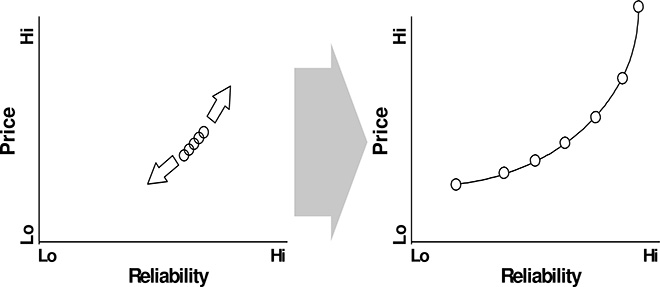
Figure 4.7 A competitive market in power will recognize the demand for various levels of reliability and providers will have to broaden the offerings they provide (left) until the range of options available to the customer covers the entire spectrum of capabilities, as shown at the right. Actual options offered will be even more complicated because they will vary in the type of reliability (e.g., perhaps frequency or duration is more important to a specific customer; seven days a week or only normal business hours).
Secondly, any “one-size-fits-all” reliability price structure will quickly evaporate in the face of competitive suppliers. Someone among the various suppliers will realize there is a profit to be made and a competitive advantage to be gained by providing high-reliability service to consumers willing to pay for it. While others will realize that there are a substantial number of customers who will buy low reliability power, as long as it has a suitably low price. The concept that will undoubtedly emerge (in fact, is already evolving at the time this book is being written) in a deregulated market will be a range of reliability and cost options. The electric utility market will broaden its offerings, as shown in Figure 4.7.
For example, distributed generation (DG) interacts with the opportunities that the need for differentiated reliability creates in a deregulated marketplace in two ways. First, this new marketplace will create an opportunity for DG, which can be tailored to variable reliability needs by virtue of various design tricks (such as installing more/redundant units). Secondly, DG is a “threat” that may force utilities to compete on the basis of reliability, because it offers an alternative, which can easily be engineered (tailored), to different reliability-cost combinations. Utilities may have no choice but to compete in pricing reliability.
4.6 TWO-Q ANALYSIS OF POWER SYSTEMS
Two-Q plots similar to those shown in Chapter 3, but oriented toward measurement of system capability rather than consumer needs, can be used to analyze the ability of a power system to meet projected customer demands for both quantity and quality of power. They provide a useful tool in determining both the appropriateness of the system design, and how to tailor it to best fit consumer needs.
Figure 4.8 shows a two-Q plot of the capability of a set of feeders in a utility system in the mid U.S. The area involved is part of a small town of 40,000 population and its industrial area. Over the period 1989 – 1998, the peak load in this area grew by more than 10% (from 19.5 to 21.7 MW). Planners for the utility, constrained by pressures to minimize capital cost, accommodated the load growth largely through a process of transferring switching and making small changes in the system. From a “load flow” (capacity, or quantity only) perspective the planning was successful - the utility figuring out a way to connect consumers with sufficient capacity to satisfy the peak load, at least when everything was working as expected.
However, as Figure 4.8 shows, the various means taken to accommodate more quantity in power gradually eroded the system’s reliability capability. This was both due to use of contingency margin for service of peak load and use of switching and alternate paths for peak load service. Both means left no “backup” for contingencies, with the result that SAIDI in the region went from acceptable, to completely unacceptable by local consumers’ standards.
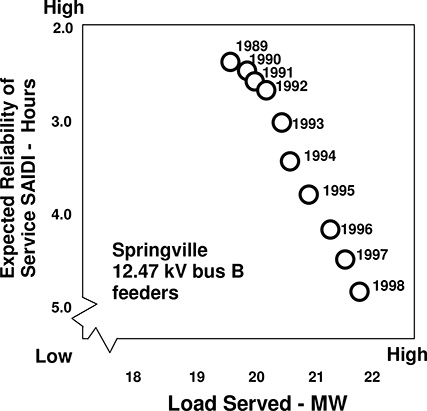
Figure 4.8 Two-Q plot of capability of a set of feeders in a large utility system in the central U.S, showing how increases made to accommodate higher load gradually eroded capability to deliver high reliability of supply. See text for details.
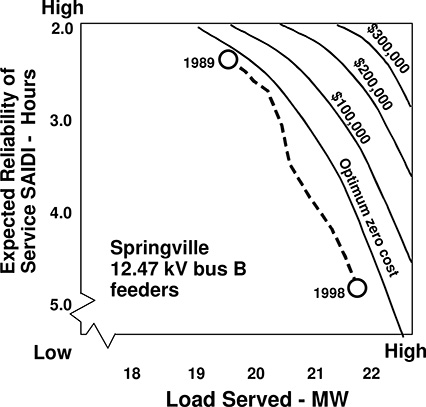
Figure 4.9 Two-Q plot of the design flexibility and options available in the region from Figure 4.8 showing results of Two-Q analysis. See text for details.
Figure 4.9 shows a two-Q diagram of design options determined from detailed evaluation of the system’s capability and consumer demands in the area. This study was done using a computerized method that analyzes both capacity (load flow type factors) and reliability (frequency, duration, voltage sag probabilities) simultaneously (Two Q analysis). The dashed line in Figure 4.9 shows the actual migration path for the system as modified and operated by the utility over the period 1989 – 1998. Total capital cost during the period was $41,500 (PW 1989).
The lowest of the solid lines, labeled “optimum zero cost” shows the locus of superior performance points obtainable through re-switching and no more than $15,000 in cost. This indicates that the entire migration path for the period was inferior by roughly 40 minutes SAIDI or .66 MW quantity capability. This was due to the utility’s lacking reliability-based techniques to hone the design well. Traditional single Q (quantity) design methods simply could not optimize the system to meet consumer needs at lowest cost.
The other solid lines in the drawing show the optimized capacity curves for various budget-levels (PW 1989 capital). The lines represent the locus of points for different designs or options, not the same plan. But all points on each curve are options purchasable at that budget amount. The utility’s options and the trade-off between reliability of service and configuration for peak capacity is only clear.
4.7 CONCLUSION AND SUMMARY
Reliability of service is one of the major factors customers weigh in perceiving how well their electric supply system is doing its job. Whether that service is provided by an electric utility system, or a distributed generator, the planners of the supply system must set appropriate reliability goals and plan, engineer, and operate it to achieve targeted levels of customer service reliability. Various reliability indices can be used to track frequency and duration of customer interruptions over time and by location within the distribution system, in order to identify problems and ensure that goals are being met, but ultimately the only test that matters is consumer satisfaction.
Most utilities make sure that reliability targets are met, not through detailed reliability analysis in the planning stage, but implicitly through contingency and design criteria that are based on assessment of their reliability impacts. A more effective but complicated approach is to explicitly analyze reliability of planned designs, in an effort to determine if they are suitable and to engineer them to fully meet requirements at the lowest possible cost. Examples later in this book will illustrate this approach.
Electric consumers vary in their need for reliability of service as much as they vary in the amount of power they need. The electric power marketplace can be likened to a comb, a series of niches, each populated by consumers with different needs for both quality and quantity of power, and different preferences in how they would trade off cost against reliability of service, if forced to make sacrifices.
Value-based planning, although difficult, is also useful, particularly in cases where reliability is an issue to large or special industrial and commercial customers. An important element is to understand and apply how much the consumer values reliable service by analyzing their cost of interruption.
REFERENCES AND BIBLIOGRAPHY
P. F. Albrecht and H. E Campbell, “Reliability Analysis of Distribution Equipment Failure Data,” EEI T&D Committee Meeting, January 20, 1972.
R. N. Allan, et al., “A Reliability Test System for Educational Purposes – Basic Distribution System Data and Results,” IEEE Transactions on Power Systems, Vol. 6, No. 2, May 1991, pp. 813-821.
D. Atanackovic, D. T. McGillis, and F. D. Galiana, “The Application of Multi-Criteria Analysis to a Substation Design,” paper presented at the 1997 IEEE Power Engineering Society Summer Meeting, Berlin.
R. Billinton, and J. E. Billinton, “Distribution System Reliability Indices,” IEEE Transactions on Power Delivery, Vol. 4, No. 1, January 1989, pp. 561-568.
R. Billinton R., and R. Goel, “An Analytical Approach to Evaluate Probability Distributions Associated with the Reliability Indices of Electric Distribution Systems,” IEEE Transactions on Power Delivery, PWRD-1, No. 3, March 1986, pp. 245-251.
R.E. Brown, Electric Power Distribution Reliability – Second Edition, CRC Press, Boca Raton, 2009.
R.E. Brown, Business Essentials for Utility Engineers, CRC Press, Boca Raton, 2010.
J. B. Bunch, H.I Stalder, and J.T. Tengdin, “Reliability Considerations for Distribution Automation Equipment,” IEEE Transactions on Power Apparatus and Systems, PAS-102, November 1983, pp. 2656 - 2664.
“Guide for Reliability Measurement and Data Collection,” EEI Transmission and
Distribution Committee, October 1971, Edison Electric Institute, New York.
W. F. Horton, et al., “A Cost-Benefit Analysis in Feeder Reliability Studies,” IEEE Transactions on Power Delivery, Vol. 4, No. 1, January 1989, pp. 446 - 451.
Institute of Electrical and Electronics Engineers, Recommended Practice for Design of Reliable Industrial and Commercial Power Systems, The Institute of Electrical and Electronics Engineers, Inc., New York, 1990.
A. D. Patton, “Determination and Analysis of Data for Reliability Studies,” IEEE Transactions on Power Apparatus and Systems, PAS-87, January 1968.
N. S. Rau, “Probabilistic Methods Applied to Value-Based Planning,” IEEE Transactions on Power Systems, November 1994, pp. 4082 - 4088.
A. J. Walker, “The Degradation of the Reliability of Transmission and Distribution Systems During Construction Outages,” Int. Conf. on Power Supply Systems. IEEE Conf. Pub. 225, January 1983, pp. 112 - 118.
H. B. White, “A Practical Approach to Reliability Design,” IEEE Transactions on Power Apparatus and Systems, PAS-104, November 1985, pp. 2739 - 2747.
W. Zhang and R. Billinton, “Application of Adequacy Equivalent Method in Bulk Power System Reliability Evaluation,” paper presented at the 1997 IEEE Power Engineering Society Summer Meeting, Berlin.