CHAPTER 12
Chemical Rocket and Hypersonic Propulsion
12.1 Introduction

Source: Courtesy of NASA (Constellation Program)
A chemical rocket is a self-contained jet engine that carries both the fuel and oxidizer that are needed for combustion. The fuel and oxidizer are jointly called the propellant. Since the rocket carries its own oxidizer, it does not need an air inlet to provide oxygen for combustion, as in a gas turbine engine. It is this independence of rocket operation from atmospheric air that makes it a good candidate for space propulsion. The relative simplicity and manufacturing cost of a rocket engine as compared with an airbreathing jet engine have made rockets the propulsor of choice for low-cost weapons and aerospace vehicle boost applications. For example, the Space Shuttle uses two solid rocket boosters (known as SRBs) to help achieve liftoff and vehicle acceleration to orbit. The Space Shuttle also uses a liquid propellant rocket engine as its main engine, dubbed SSME or Space Shuttle Main Engine. Depending on the form of propellant that is used in combustion, a chemical rocket may be called a liquid propellant, a solid propellant, a gaseous propellant rocket or, if the fuel is in solid form and the oxidizer is in liquid (or gaseous) form, the rocket is called a hybrid. For a liquid propellant rocket, the fuel and oxidizer are stored in separate tanks in liquid form. The solid propellant rocket has the fuel and oxidizer in solid form, packed or cast in the rocket case, in the form of a paste. Since rockets operate on the principle of jet propulsion, which is achieved when a fluid is ejected through a nozzle at finite speed, the fluid and the form of accelerationopens new categories of rocket propulsion devices. For example, if the fluid is made up of ions (of an atom, say cesium) that are accelerated in an electric field (in lieu of a nozzle), the rocket achieves a thrust and this class of rocket propulsion belongs to electric or ion propulsion. For the case of fluid (like hydrogen) that is heated by a nuclear reactor before ejection through a nozzle, the category of engine is called a nuclear rocket propulsion device. For atmospheric applications that require stringent emissions standards, only the liquid and solid propellant rockets are suitable. These belong to the general category of chemical rocket propulsion. Forward (1995) presented intriguing advanced propulsion concepts (other than pure rockets) that are thought provoking and thus recommended for reading.
The main drawback of rocket engines operating in the Earth’s atmosphere is their high propellant consumption rate per unit thrust produced as compared to the fuel consumption rate in airbreathing engines. The figure of merit that compares rockets to airbreathing engines is the specific impulse Is (in seconds) that we defined in Chapter 3, repeated here for convenience:
where
The numerator in specific impulse is the net (uninstalled) thrust produced, which for an airbreathing engine we derived to be (Equation 3.14)
Since, conventional rockets do not suffer from any ram drag, they produce thrust according to (Equation 3.46):
The denominator of specific impulse is the propellant weight flow rate for a rocket (i.e., the sum of oxidizer and fuel weight flow rates) and only the fuel weight flow rate for an airbreathing engine. The use of a more energetic fuel like hydrogen leads to directly higher specific impulse, since a smaller, that is, nearly two and half times lower, consumption of hydrogen is needed to achieve the same temperature in the combustor. Now, if we graph representative values for the specific impulse of typical airbreathing and rocket engines (Figure 12.1, also Kerrebrock, 1992) for a hydrocarbon and hydrogen fuel as a function of flight Mach number, we note the following important features:
- rocket-specific impulse is independent of vehicle speed, as it does not suffer from any ram drag penalty, nor is its combustion is affected by the stagnation temperature rise in intake
- the specific impulse for a chemical rocket is about 250–450 s
- the specific impulse for airbreathing engines is shifted upward when hydrogen is used as fuel in comparison to hydrocarbon fuels
- a gas turbine engine achieves takeoff thrust and the best low-speed performance, as depicted by a specific impulse of between ∼4000 and 8000 s for a turbojet and (not shown) higher than 10, 000 s for a turbofan
- the specific impulse of gas turbine engines drop with flight Mach number
- the rapid fall of a gas turbine engine performance with forward speed is broken up if we switch to the ramjet family of airbreathing engines, for example, near Mach 3, a conventional ramjet starts to outperform a turbojet
- the rapid fall of a conventional ramjet engine performance with flight Mach number is halted if we switch to the supersonic combustion ramjet (or scramjet)
- the flight Mach number of ∼6 is where scramjet outperforms other airbreathing engines
- deterioration of scramjet performance with forward speed is inevitable as the flight stagnation temperature increases and components losses mount
- although the upper operational Mach number of scramjets is unknown, it is suspected that for high flight Mach numbers, for example, Mach ∼10–15, scramjet performance may begin to fall below a chemical rocket.
 FIGURE 12.1 Approximate variation of specific impulse with flight Mach number for different airbreathing engines (TJ: turbojet, RJ: ramjet, and SCRJ: scramjet) and a typical chemical rocket
12.2 From Takeoff to Earth Orbit
A vehicle requires a flight Mach number of ∼25 to achieve a circular low Earth orbit (LEO). The proof of that is very simple. On a circular orbit of radius r (which for LEO is ≥100 km above the Earth of ∼6000 km radius), a vehicle of mass m experiences a centrifugal force of magnitude mV2/r. The gravitational pull on the vehicle toward the Earth is roughly ∼mg0. These two forces are in balance if the vehicle is to maintain its circular orbit, therefore,
Which for a speed of sound of ∼300 m/s (at high altitude), we get a flight (or orbital) Mach number of ∼25.5. The purpose of this simple demonstration was to get a rough order of magnitude for the Mach number required at LEO to maintain a circular orbit. We recognize that we made several approximations, for example, in the gravitational force on the vehicle when we applied g0 on the Earth’s surface, instead of a reduced gravitational acceleration that corresponds to an altitude of 100 km, or when we did not account for any atmospheric drag at 100 km, or when we used an “average” Earth radius (of 6000 km) as in a homogeneous spherical earth.
To reach LEO and maintain a circular orbit, we need to fly about Mach 25. For a single-stage to orbit aircraft (what is known as SSTO), the engine(s) have to produce takeoff thrust, maintain climb rate, and acceleration until the vehicle has achieved Mach 25. If we wish to use the most efficient means of reaching Mach 25 from takeoff, we have to employ a variety of engines, as depicted by the specific impulse chart of Figure 12.1. At takeoff, we could use a turbofan engine and gradually reduce its bypass ratio (as in a variable-bypass TF engine) with flight Mach number until it operates as a turbojet. Then, we should be able to shut down the gas generator all together near Mach 3 and switch over to a conventional (or subsonic combustion) ramjet for up to ∼Mach 6. The scramjet is to take over beyond Mach 6 and accelerate the vehicle through Mach 10–15, depending on the hydrocarbon or hydrogen fuel, respectively. At these Mach numbers, we are still too slow to maintain a circular orbit at LEO. Therefore, chemical rocket engines have to be fired for the last leg of our launch, which should take the vehicle to Mach 25 and low Earth orbit. The main challenge for such a combination propulsion system (CPS) is complex system integration into a vehicle and the mechanical complexities involved in transition from one set or class of engines to another.
12.3 Chemical Rockets
Various components of a chemical rocket are shown in a schematic drawing in Figure 12.2.
FIGURE 12.2 Schematic diagram of a (simplified) chemical rocket with liquid hydrogen as fuel and liquid oxygen (LO2) as the oxidizer (with turbopump feed system)
The example shown in Figure 12.2 uses liquid fuel and oxidizer as propellant. The fuel and oxidizer are stored in insulated tanks in liquid state to reduce the volumetric requirements of the propellant. The fuel and oxidizer pumps provide the propellant feed system into the combustion chamber. The pumps are driven by a turbine (not shown in the schematic drawing), therefore the name turbopump system. The propellant is fed into the combustion chamber through an injector plate. The pressure in the combustion chamber is ∼20% lower than the feed pressure to avoid pressure oscillation instability known as chugging. The combustion temperature is governed by the heat of reaction of the fuel and oxidizer. The products of combustion are then accelerated through an exhaust nozzle. The thrust may be controlled (to the point of shutting down and restarting) by the fuel and oxidizer pumps. The guidance, navigation, control, and payload are shown in the nose chamber. The fins provide aerodynamic control and stability of the rocket.
Elements of a solid rocket motor are shown in Figure 12.3. The propellant is in solid form and is called the grain or charge. Propellant is bonded to the rocket motor case, which typically has an internal burning grain cavity, as shown. The igniter initiates the burning of the solid grain. Once burning is initiated and hot gases are expelled through an exhaust nozzle, the thrust of the solid motor is established by the burning grain surface area and the propellant-burning rate. Since solid rocket motors have no pumps or valves to control the amount of propellant engaged in the combustion process, the thrust cannot be fully controlled. We can, however, terminate the operation of a solid rocket motor by opening thrust termination ports to cancel the thrust, as shown.
FIGURE 12.3 Schematic drawing of a solid-propellant chemical rocket with internal burning grain (grain designs referred to neutral, progressive, and regressive describe thrust-time behavior)
A hybrid rocket typically uses a solid fuel and a liquid oxidizer, as shown in Figure 12.4. The oxidizer flow is regulated by the pressurized tank and a valve and injects the stream of oxidizer through a solid fuel port. The chemical reaction may be initiated by an igniter, similar to a solid propellant rocket motor. The hot combustion gases are expelled through the exhaust nozzle to produce thrust.
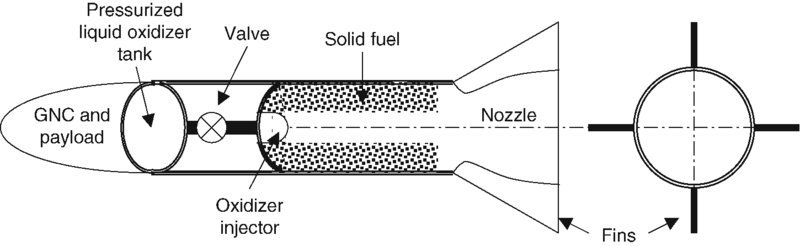
FIGURE 12.4 Schematic drawing of a hybrid rocket showing solid fuel and gaseous oxidizer propellant
12.4 Chemical Rocket Applications
Chemical rockets are capable of producing large thrust and operate at any altitude, including space. They also lend themselves to staging for increased flight efficiency. These diverse capabilities in addition to the low cost of manufacturing put rockets on many flight vehicle applications, including as strap-on boosters. Some of the main examples are listed here.
12.4.1 Launch Engines
Saturn V was a three-stage liquid propellant rocket that was successfully used to launch Apollo spacecraft towards the moon. In a multistage rocket, each stage is self-contained and operates autonomously. All three stages of Saturn V used liquid oxygen (LO2) as their oxidizer in the combustion chamber. The first stage used RP-1 (a hydrocarbon fuel), whereas the second and third stages used liquid hydrogen (LH2) for fuel. The low density of hydrogen makes it less than optimal for use in the first stage of launch where a large volume of fuel is required to produce the launch thrust. The three stages of Saturn V produced 7, 570, 000 lb, 1, 125, 000 lb, and 230, 000 lb of thrust, respectively. The launch weight of the vehicle that included the payload was 6, 262, 000 lb. Note that the thrust-to-weight ratio for Saturn at launch is the thrust produced by its first stage engine divided by the initial weight of the rocket, i.e., 7570/6262 = 1.209. The first stage produces a modest thrust level of ∼20% over the initial weight (to accelerate the vehicle), that is, it imparts 0.2 g0 initial acceleration to the vehicle.
Another example is the Space Shuttle Main Engine that uses LO2 /LH2 as propellant. There are three SSMEs and each produces 375, 000 lb at sea level and 470, 000 lb at altitude. The SSME starts at launch and operates for ∼8.5 min. The use of liquid hydrogen in the SSME for launch has required an external (propellant) tank that is jettisoned after the liquid hydrogen and oxygen are consumed. The external tank (ET) is the only expendable component of the Space Shuttle.
The new generation of launch and human exploration vehicles, post Space Shuttle, were the Ares I launch vehicle and the Orion Crew Exploration Vehicle (CEV). Orion’s first flight with astronauts onboard was planned for 2014 to the International Space Station (ISS). Orion’s first flight to the moon was planned for 2020. However, budgetary issues have halted/postponed these programs at NASA. Figure 12.5 shows artist’s concepts and models of the new family of human space exploration launch and crew exploration vehicle (courtesy of NASA). In light of recent developments, the future of cost-effective space launch services lies entirely in the private/commercial sector. Noteworthy among these is SpaceX Corporation that has developed, manufactured and successfully launched advanced rockets to LEO, including a mission to the ISS with the Dragon spacecraft.
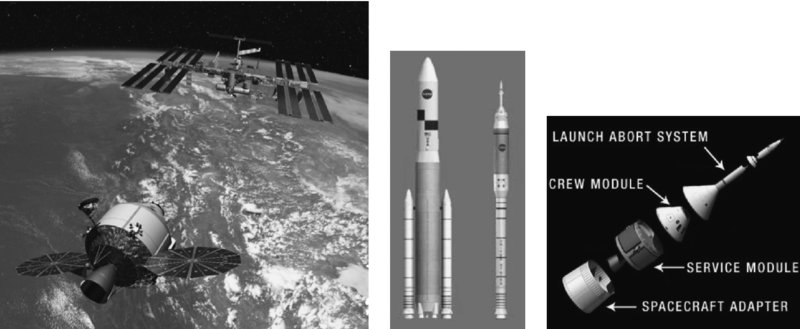
FIGURE 12.5 Artist’s concept of the Orion Crew Exploration Vehicle (CEV) approaching the International Space Station, the Ares I launch vehicle, and components of the CEV. Source: Courtesy of NASA
12.4.2 Boost Engines
Boosters are capable of providing thrust, often as a simple add-on or strap-on propulsion system. For example, there are two solid rocket boosters on the Space Shuttle launch vehicle. Each is capable of producing 2, 700, 000 lb of thrust. The solid rocket boosters start at launch and operate for 123 s. The empty boosters are then jettisoned and recovered at sea for reuse.
12.4.3 Space Maneuver Engines
The Space Shuttle is equipped with two orbital maneuver systems, which are responsible for the orbiter reentry and orbit correction maneuvers.
12.4.4 Attitude Control Rockets
The Space Shuttle has 38 primary thrusters and 6 vernier thrusters that are used to impart small velocity corrections to the orbiter. The duration of operation of these reaction control thrusters (known as pulses) is between a few milliseconds and a few seconds.
12.5 New Parameters in Rocket Propulsion
Rocket propulsion, as a self-contained system, introduces new parameters to our propulsion vocabulary. For example, thrust-time behavior, as in neutral, progressive or regressive, or total impulse It, which is defined as the integral of the thrust over time, have no counterparts in airbreathing engines. The total impulse is a parameter that is directly measured in rockets on thrust stand and used to estimate the engine-specific impulse Is. The total impulse is defined as
The time at burnout is tb. The weight of the propellant is
and the specific impulse is the ratio of total impulse to propellant weight, namely,
Figure 12.6 shows three different thrust-time behaviors for solid propellant rockets where the shape of the propellant grain dictates the burning surface area (variation with time) and thus thrust production. The initial (ignition delay) transient to produce thrust and the burnout transient are nearly parabolic in shape and are also shown in Figure 12.6.
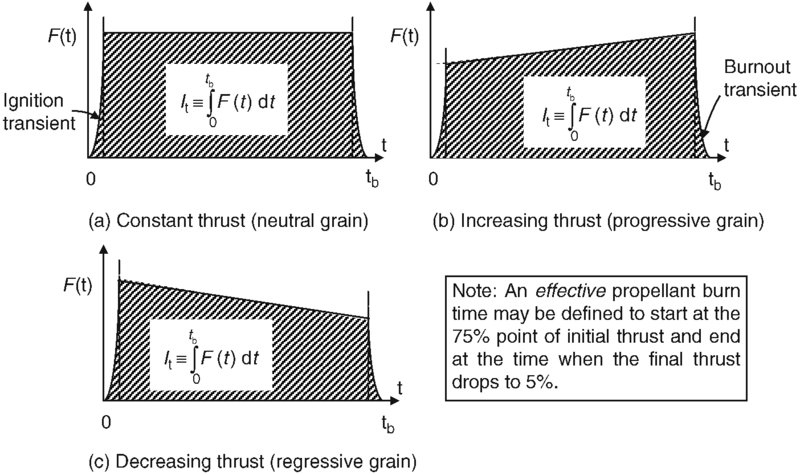
FIGURE 12.6 Total impulse for three different grain designs in solid rocket motors
The flight performance of rockets strongly depends on vehicle design through the use of stages, and the efficiency of components. For example, the rocket initial mass is m0, and the final mass, that is, after propellant burnout, is mf. The ratio of final-to-initial mass is an important parameter, and a figure-of-merit in rocket design, which is known as the mass ratio, MR,
Propellant mass mp is the difference between the initial and final masses, for a given stage, that is,
The ratio of propellant-to-initial mass is known as the propellant mass fraction ζ,
A large value of propellant mass fraction is desirable as it indicates an efficient use of system mass on the rocket that is directly responsible for thrust production.
Finally, an effective exhaust velocity c is defined as, in effect, the mass-averaged nozzle gross thrust, namely,
Using Equation 3.32, at the beginning of this chapter, we relate the effective exhaust velocity c to the specific impulse,
We may also relate the effective exhaust velocity to the actual exhaust velocity and pressure thrust through
Station numbers in a rocket engine are defined in Figure 12.7. Station c refers to the combustion chamber, station 1 is at the inlet to the convergent–divergent nozzle, station this at the nozzle throat, and station 2 is at the nozzle exit plane. The ambient state is identified by station 0. For most applications, there is no distinction between stations c and 1, but in reality the mixture of gases in the combustion chamber is chemically reacting, whereas at station 1 it is assumed that combustion is complete and the mixture has reached a chemical equilibrium state. Also, we usually associate a near stagnant gas state in the combustion chamber with Vc ≈ 0, but we attribute certain finite gas speed V1 at the nozzle inlet that follows from the area ratio A1 / Ath based on the choked throat Mth = 1.0 condition. Note the parameter trends inside a rocket engine shown in Figure 12.7.
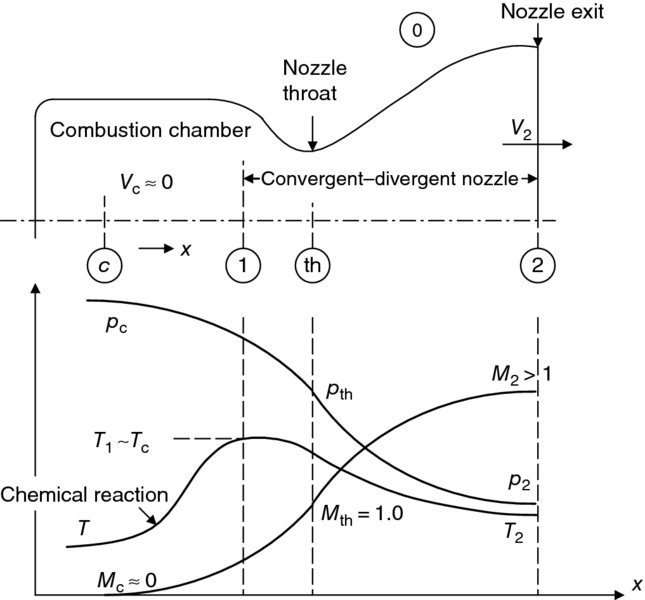
FIGURE 12.7 Rocket engine (thrust chamber) stations and corresponding static pressure, temperature, and Mach number variations
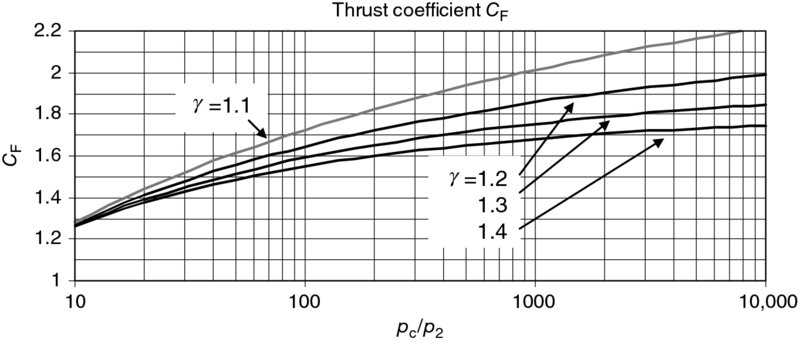
FIGURE 12.8 Variation of optimum thrust coefficient for different gas ratio of specific heats (note that pc / p2 is the familiar nozzle pressure ratio (NPR) for a perfectly expanded nozzle)
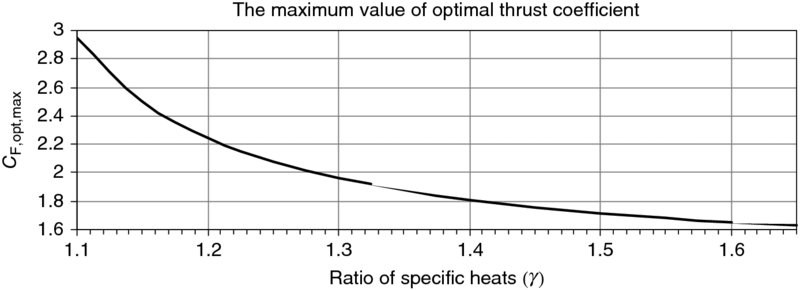
FIGURE 12.9 The variation of maximum, optimal thrust coefficient with ration of specific heats γ
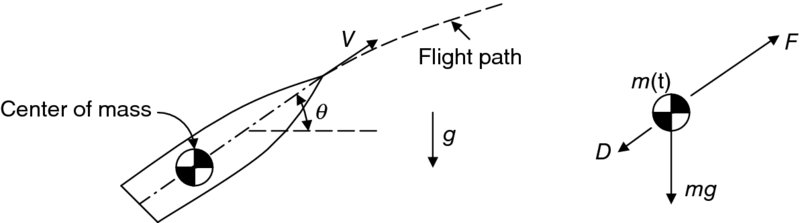
FIGURE 12.10 Definition sketch of a rocket in flight and the forces that act on the vehicle
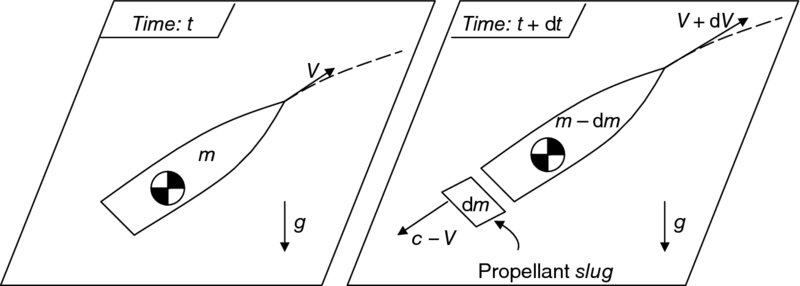
FIGURE 12.11 The rocket as observed by a stationary frame of reference before and after a propellant slug is ejected from the nozzle
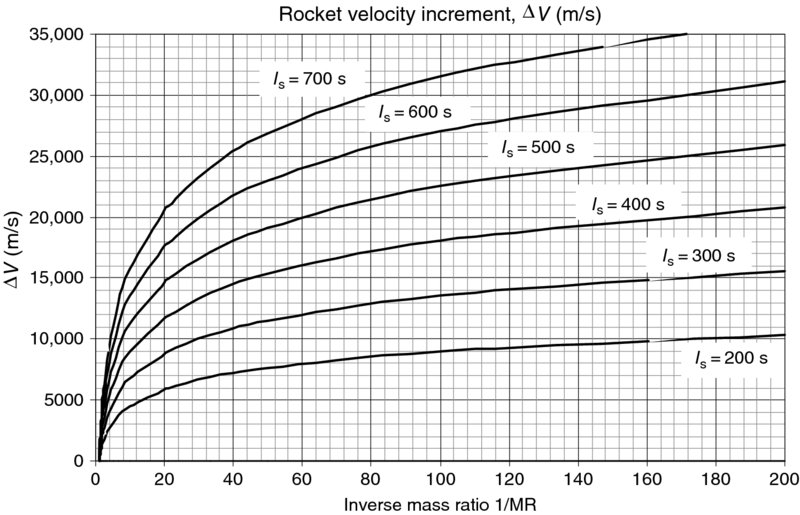
FIGURE 12.12 Velocity increment for a rocket in zero gravity, zero drag environment (with g0 = 9.8 m/s2)
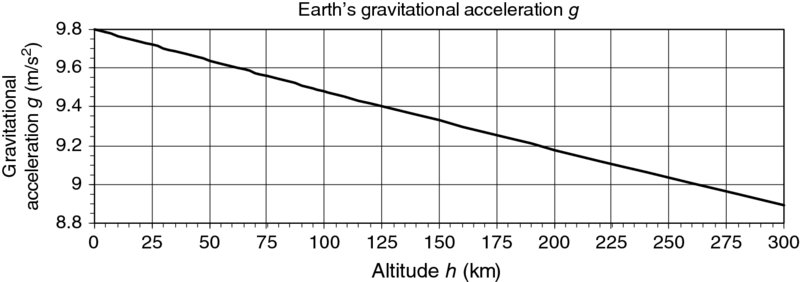
FIGURE 12.13 Variation of earth’s gravitational acceleration with altitude h (in km)
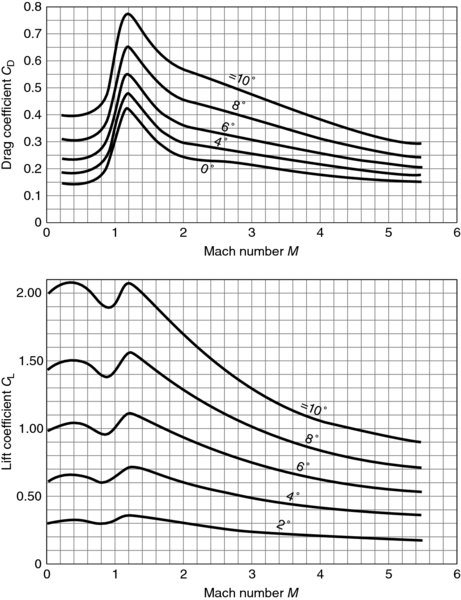
FIGURE 12.14 Aerodynamic data for a V-2 rocket as a function of angle of attack, with no jet or exhaust plume effect. Source: Sutton and Biblarz 2001. Reproduced with permission from Wiley
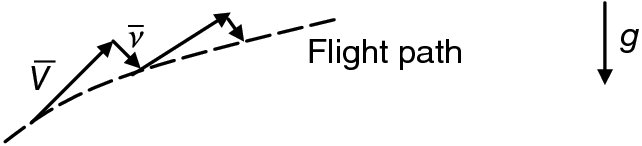
FIGURE 12.15 Definition sketch of velocity components and the rocket flight path in a gravity turn
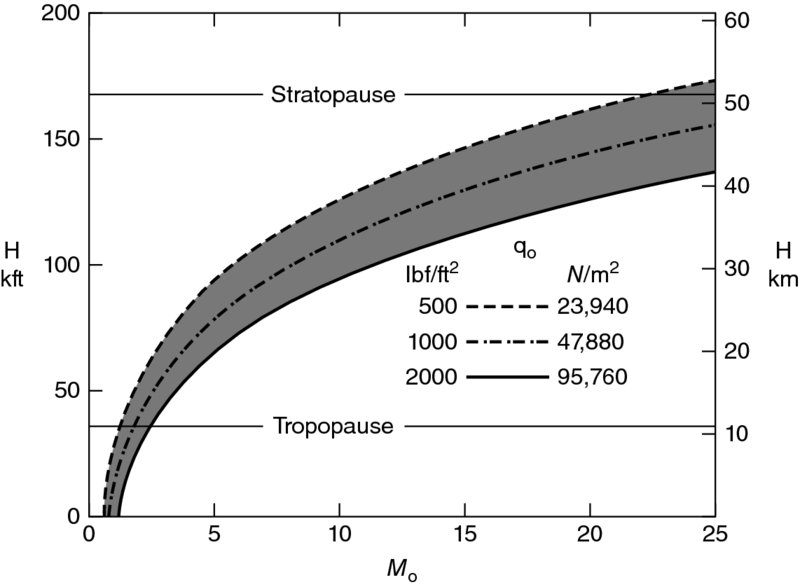
FIGURE 12.16 Standard day geometric altitude flight trajectory for constant dynamic pressure. Source: Heiser, Pratt, Daley, and Mehta 1994. Reproduced with permission from AIAA
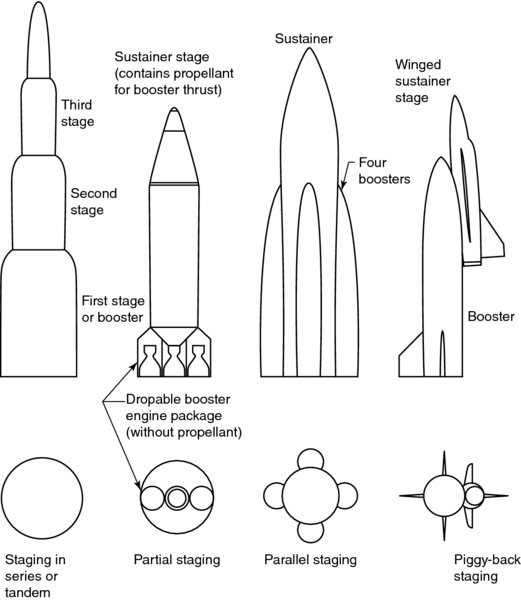
FIGURE 12.17 Concepts in rocket staging. Source: Sutton and Biblarz 2001. Reproduced with permission from Wiley
12.6 Thrust Coefficient, CF
It is customary to express the rocket thrust as a product of chamber pressure pc, the throat area Ath, and a coefficient CF, known as the thrust coefficient, that is,
In this section, we will demonstrate that thrust coefficient is a function of the nozzle area expansion ratio A2/Ath, the pressure ratio p2/pc, and the ratio of specific heats γ. Therefore, the thrust coefficient is explicitly independent of combustion temperature (thus propellant combination) and is treated as a nozzle-related parameter. The ratio of specific heats γ is the only link between thrust coefficient and the propellant combination or combustion temperature.
The mass flow rate through the nozzle may be written at the sonic throat, through the use of the continuity equation:
The exhaust velocity V2 is written based on the isentropic expansion through the nozzle from the stagnation pressure of pc to the exit static pressure p2 through these simple steps:
Since the momentum thrust is the product of mass flow rate and the exhaust velocity (Equations 12.11 and 12.12), we may write the following expression for the thrust coefficient
A perfectly expanded nozzle meets the condition of static pressure match p2 = p0, therefore the maximum thrust coefficient is a function of p2/pc and the ratio of specific heat γ. We may graph the optimum thrust coefficient, that is, CF for a perfectly expanded nozzle with isentropic expansion using an Excel spreadsheet calculation and graph of the functionin.
Figure 12.8 (with abscissa in logarithmic scale).
Before leaving the subject of thrust coefficient, we recognize the bracket term under the square root in Equations 12.13b or 12.13c as the ideal thermal efficiency of a Brayton cycle operating between the two pressures pc and p2, that is,
For very large chamber pressures pc and very large area ratio nozzles where the exit static pressure p2 is low, the thermal efficiency approaches 1, which then points to the maximum attainable thrust coefficient CF, opt, Max, that is,
The maximum value of thrust coefficient is a pure function of γ and is shown in Figure 12.9.
12.7 Characteristic Velocity, c*
A velocity parameter that is linked to the combustion chamber is called characteristic velocity c*. We expect this velocity to be related to the speed of sound in the combustion chamber, as the characteristic speed. But, first its definition

In terms of specific impulse and thrust coefficient, or effective exhaust speed and thrust coefficient, the characteristic velocity may be written as
Returning to the definition of c* in Equation 12.16, we may express the propellant mass flow rate for the sonic flow at the throat and gas total pressure and temperature, to get
As expected, the numerator in Equation 12.18 is the speed of sound in the combustion chamber. The propellant combination of fuel and oxidizer and their proportions establish the equivalence ratio, the products of combustion, and the mixture temperature for a combustion pressure pc, as we studied in Chapter 7. From Equation 12.16, we note that the experimental estimation of characteristic velocity is rather straightforward, since the chamber pressure and propellant flow rate are easily measured and the throat area is a geometric parameter. The Table 12.1 shows some liquid propellant combinations and the characteristic speed c*, also known as chamber c* (from Sutton and Biblarz, 2001). The mixture ratio is the oxidizer-to-fuel mass ratio. The chamber pressure for the ideal performance values in Table 12.1 is taken to be 1000 psia (this corresponds to ∼6.87 MPa). The 1000 psia chamber pressure is often taken as a reference value in rocket propulsion. RP-1 is a hydrocarbon fuel [CH1.953] similar to kerosene.
![]() TABLE 12.1 Theoretical Performance of Liquid Propellant Combinations (data from Sutton and Biblarz, 2001)
TABLE 12.1 Theoretical Performance of Liquid Propellant Combinations (data from Sutton and Biblarz, 2001)
| Oxidizer | Fuel | Mixture ratio (Mass) | Chamber temperature (K) | Chamber c* (m/s) |
| Oxygen | Methane | 3.2 | 3526 | 1835 |
| 3.0 | 3526 | 1853 | ||
| Hydrazine | 0.74 | 3285 | 1871 | |
| 0.90 | 3404 | 1892 | ||
| Hydrogen | 3.40 | 2959 | 2428 | |
| 4.02 | 2999 | 2432 | ||
| RP-1 | 2.24 | 3571 | 1774 | |
| 2.56 | 3677 | 1800 | ||
| Fluorine | Hydrazine | 1.83 | 4553 | 2128 |
| 2.30 | 4713 | 2208 | ||
| Hydrogen | 4.54 | 3080 | 2534 | |
| 7.60 | 3900 | 2549 |
A few examples of solid propellant combinations and the corresponding chamber c* values are shown in Table 12.2 (from Sutton and Biblarz, 2001). Again, the reference chamber pressure is taken to be 1000 psia. The composition of solid propellant is characterized by the amount of binder (i.e., glue or epoxy), additives, and aluminum, which enhance combustion chamber temperature and chamber c*.
![]() TABLE 12.2 Theoretical Performance of Solid Propellant Combinations (data from Sutton and Biblarz, 2001)
TABLE 12.2 Theoretical Performance of Solid Propellant Combinations (data from Sutton and Biblarz, 2001)
| Oxidizer | Fuel | Chamber temperature (K) | Chamber c* (m/s) |
| Ammonium nitrate | 11% binder and 7% additive | 1282 | 1209 |
| Ammonium | 18% organic polymer | ||
| Perchlorate 78–66% | binder and 4–20% Al | 2816 | 1590 |
| Ammonium | 12% polymer | ||
| Perchlorate 84–68% | binder and 4–20% Al | 3371 | 1577 |
12.8 Flight Performance
Consider a rocket of instantaneous mass m(t) flying at the instantaneous speed V. The flight path angle with respect to horizon is θ, where vertical is the direction of the gravitational force, as shown in Figure 12.10. The atmospheric drag D acts along the vehicle axis, as shown.
We may relate the net forces along the vehicle axis to the vehicle instantaneous acceleration according to
Case 1 Zero gravitational force and atmospheric drag
This case is of interest as it produces a simple closed-form solution, since
We recognize that propellant flow rate is the rate at which the vehicle loses mass, therefore substituting
in Equation 12.20, we have
which separates to the following form that is suitable for integration
The vehicle attains an incremental speed change ΔV as natural logarithm of inverse mass ratio, and proportional to the nozzle effective exhaust velocity c, that is,
This is known as the fundamental equation of rocketry. For a rocket designed to have a final mass of 5% of its initial mass, the inverse mass ratio is 20 and the natural logarithm of 20 is 2.9957. Therefore, the rocket may be gaining speed of ∼3c, and as shown in Equation 12.8, the effective exhaust velocity is ∼g0Is. For an average specific impulse Is of ∼400 s and the (earth) gravitational acceleration of ∼10 m/s2, we have an effective exhaust speed of ∼4000 m/s. Thus, the rocket terminal speed, without accounting for gravity and drag, is ∼3c, which is nearly 12, 000 m/s. However, we need to correct for the effects of gravitational force and aerodynamic drag that we neglected in case 1. Both of these effects cause a reduction in the terminal speed or the attained incremental speed ΔV.
Before we embark on case 2, let us show the fundamental equation of rocketry derived from a stationary observer frame of reference outside the rocket. The rocket speed V is measured relative to the stationary observer. The effective exhaust speed c is relative to the rocket, which translates into (c − V) in the stationary observer frame of reference. At time t, the vehicle mass is m and the instantaneous speed V. At an incremental time later, that is, t + dt, the vehicle has a reduced mass (m − dm) and has attained an incremental speed change (V + dV). During the same dt time period, the propellant of mass dm is ejected through the nozzle backward and has attained a speed (c − V) with respect to the stationary observer. The external forces acting on the rocket for the observer are only the aerodynamic drag and the gravitational force. The thrust produced by the rocket motor is an internal force to the vehicle, thus the observer will not record that as external force acting on the vehicle. The graphical depiction of the two snapshots of the rocket is shown in Figure 12.11.
The change of momentum along the rocket axis for the vehicle and propellant slug between times t and t + dt (with positive taken to be in the flight direction) is
We neglected (dm)(dV) in Equation 12.23 as a second order effect. The change of momentum along the vehicle axis is equal to the impulse of external forces (along the vehicle axis and in the flight direction) in time dt, namely,
Set Equation 12.23 equal to Equation 12.24 and divide by dt to get
We recognize the second term on the left-hand side (LHS) of Equation 12.25 as the rocket thrust force, which then reproduces Equation 12.19, that is,
The fundamental equation of rocketry, Equation 12.22 is expressed in terms of specific impulse and earth’s surface gravitational acceleration as
The graph of velocity increment for different specific impulse and vehicle mass ratio is shown in Figure 12.12. We note that as mass ratio is reduced (or inverse of mass ratio is increased), velocity increment grows logarithmically. The impact of specific impulse on velocity increment may also be discerned from Figure 12.12. For a mass ratio of 5%, the velocity increment varies between 6000 and 20, 000 m/s, when the specific impulse varies between 200 and 700 s. The mass ratio of 5% indicates a rocket vehicle design that has 95% of its initial mass occupied by its propellant and only 5% devoted to structure, skin, payload, navigation, and control. This value, that is, MR of 0.05, represents the best of a single-stage rocket design today. It is, however, possible to improve the rocket performance in attaining a higher terminal velocity by discarding of empty propellant tanks. This introduces the concept of a multistage rocket. Each rocket stage is completely self-contained, that is, it has its own motor, propellant tanks, and feed system.
Case 2 Rocket performance including the effect of gravity
From Equation 12.19, we keep the gravity term on the right-hand side (RHS) as we neglect the aerodynamic drag,
Divide both sides by m/dt, to get
If we integrate Equation 12.28 and use the time-averaged value of g · sin θ (denoted by subscript, m), we get
Gravitational acceleration g is governed by Newton’s law of gravitation, that is,
It is customary to combine the product of universal gravitational constant G, the mass of the planet M, and inverse of planet radius squared, into a single term, called the gravitational acceleration on the planet’s surface, that is,
Therefore, gravitational acceleration g as a function of altitude h above a planet of radius R is related to the acceleration on the surface of the planet by
The mean radius of earth is 6000 km and the gravitational acceleration on earth’s surface is 9.8 m/s2, therefore, at 100 km altitude, where low Earth orbit starts, gravitational acceleration is ≈ 9.48 m/s2 or ∼97% of its sea level value. Figure 12.13 shows the variation of gravitational acceleration with altitude for up to 300 km. We note that since h ![]() R (in this graph), the variation is nearly linear, that is, if we apply binomial expansion to Equation 12.32 for h/R
R (in this graph), the variation is nearly linear, that is, if we apply binomial expansion to Equation 12.32 for h/R ![]() 1, we get
1, we get
Case 3 Rocket flight performance including the effects of gravity and aerodynamic drag
The motion of the rocket in a gravitational field including atmospheric drag was derived in Equation 12.19, to be
The thrust is again represented by − (dm/dt) · c and the rocket drag is proportional to the flight dynamic pressure and the frontal (cross-sectional) area of the rocket Af, with the proportionality constant called drag coefficient CD according to
The variation of drag coefficient with flight Mach number may be modeled based on wind tunnel data, computational fluid dynamics codes, or design charts that are developed by industry (proprietary). In general, the presence and the shape of the exhaust plume affect the pressure distribution on the rocket and thus vehicle drag. Therefore, it is customary to depict the baseline drag coefficient in the absence of the exhaust jet. Also, a winged rocket experiences aerodynamic lift; thus we need to model the lift coefficient CL as a function of Mach number and angle of attack. Some typical aerodynamic data, including lift variation with flight Mach number and angle of attack α, are shown in Figure 12.14 for a V-2 rocket, without the jet and exhaust plume effect (from Sutton and Biblarz, 2001). In Figure 12.14, we note that the drag coefficient exhibits a transonic drag rise behavior as well as a plateau region at high supersonic Mach numbers. This behavior is indeed known as the hypersonic Mach independence principle.
The equation of motion of the rocket is rewritten as
And by dividing both sides by m/dt, we get
We may integrate Equation 12.35b, to get
We may write the rocket instantaneous mass m in terms of initial mass, propellant mass, and burn time, as
where ς is the propellant mass fraction. The last integral in Equation 12.35d may now be expressed as
Note that the integrand in Equation 12.37 is an implicit function of time, since time is related to altitude and density is a function of altitude; also, time implies rocket speed V, which is related to the Mach number at the altitude and drag coefficient is a function of flight Mach number. Therefore, we may proceed in time, in a stepwise fashion, from zero to the burnout time tb. The governing equation is thus
Note that the flight path angle, in this nonlifting case, denoted by θ, is changing with time. Therefore, rocket undergoes gravity turn as evidenced by the trio of forces shown in Figure 12.10. Hence, at each time step we need to calculate the new flight path angle θ. The incremental change of flight path direction is dictated by the component of gravitational force normal to the rocket axis, namely,
which integrates to
The rocket moves to a new position along its axis Δx and normal to its axis Δy according to
and
Figure 12.15 shows the velocities along the vehicle axis and the turning speed due to the component of gravitational force normal to the axis. The incremental step Δx is taken along vehicle axis and the step Δy is normal to that direction.
An interesting case in hypersonic propulsion involves integrating rockets and air-breathing propulsion in an aircraft. Under those circumstances, the airbreathing engines rather than the rocket primarily drive the choice of the flight trajectory. The structural loads limit the upper bounds of acceptable flight dynamic pressure, and the lower bounds of the dynamic pressure are limited by the mass flow rate per unit area at a given altitude (i.e., thrust requirement). Hence, the flight trajectory for an airbreathing hypersonic aircraft falls within a constant dynamic pressure band, as shown in Figure 12.16 (from Heiser et al., 1994). Mach number versus altitude for three constant dynamic pressures (an upper, a lower, and a mean) is shown in Figure 12.16.
Assuming a constant dynamic pressure trajectory, we may integrate Equation 12.38 to get

where the drag coefficient is replaced by a suitable average CD (shown with a bar). By combining the first and last terms on the RHS of Equation 12.42a, we obtain an interesting form for terminal velocity, namely,

The bracket on the RHS of Equation 12.42b contains the contribution of thrust and the penalty of aerodynamic drag. We note that a low dynamic pressure trajectory reduces the drag penalty as well as a high initial mass per unit frontal area, that is, m0/Af. This requirement tends to produce long slender vehicles for low frontal cross-sectional area and large mass. Also, low drag coefficient CD is desirable in achieving high terminal speeds, which implies a slender conical nose or tangent ogive to reduce the vehicle drag coefficient.
12.9 Multistage Rockets
A multiple-stage rocket has the capability to improve the flight performance of a single-stage rocket. There have been many forms of staging used in rocket launch systems to date. An example of various staging concepts is shown in Figure 12.17 (from Sutton and Biblarz, 2001).
Strap-on boosters that jettison after their propellant is depleted are examples of staging that are widely used in launch systems. For example, the space shuttle has two solid rocket boosters that separate after their propellant is fully consumed (i.e., 123 s after launch). Also, the external tank that carries liquid hydrogen and liquid oxygen for launch is separated after ∼8.5 min. Figure 12.18a shows the space shuttle orbiter with solid rocket boosters (SRB) and the external tank (ET). The internal compartments of the external tank are shown in Figure 12.18b from Isakowitz (1995).
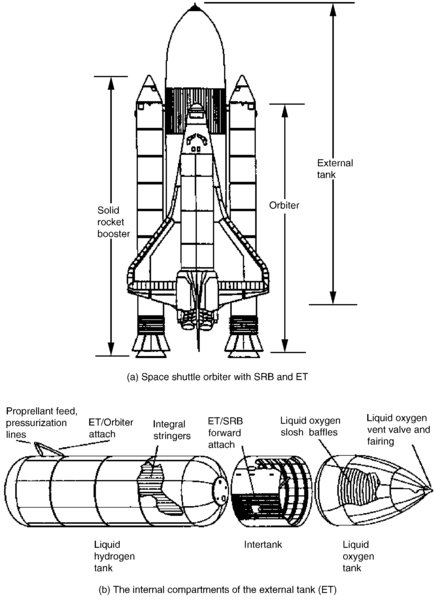
FIGURE 12.18 Space shuttle orbiter launch. Source: Isakowitz 1995. Reproduced with permission from AIAA
The terminal speed of a multistage rocket (with n stages) is the sum of the terminal speeds of its individual stages, namely,
In the absence of gravity and atmospheric drag, the individual stage incremental speed is
Assuming that all stages have the same effective exhaust speed, for simplicity, we may express the terminal speed of a multistage rocket by
Since the final mass of stage 1 is the initial mass of stage 2 and the final mass of stage 2 is the initial mass of stage 3, the product of n stage mass ratios in Equation 12.45 simplifies to the payload or final mass (of the nth stage) divided by the initial rocket (or launch) mass. Here, we have called the final mass of the last stage as the payload mass mL. Therefore,
As noted earlier, the ratio of final-to-initial mass for a single-stage rocket is at best 0.05, or its inverse mass ratio is 20. For a multistage rocket, however, the ratio of payload to initial mass may be ∼0.01 or even lower. This gives an inverse mass ratio in excess of 100. Therefore, the flight performance shown in Figure 12.12 where the inverse mass ratio varies from 1 to 300 should be viewed in the context of possible single or multistage rocket vehicles.
It is instructive to view the flight sequence of a multistage rocket. Figure 12.19 shows the flight sequence of Ariane-4 with the table to the right listing the flight times (from Isakowitz, 1995).
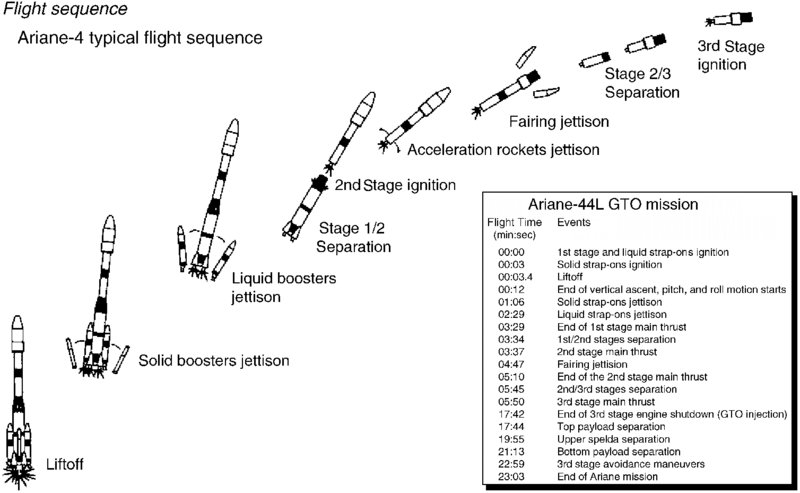
FIGURE 12.19 Typical flight sequence of Ariane-4. Source: Isakowitz 1995. Reproduced with permission from AIAA
12.10 Propulsive and Overall Efficiencies
The fraction of the thrust power and the residual kinetic power in the jet that is converted to thrust power is called the propulsive efficiency of a rocket. The residual kinetic power in the jet is the kinetic power as observed by a stationary observer, that is,
Therefore, the propulsive efficiency is
Replacing thrust by the product of propellant flow rate and the effective exhaust speed and simplifying, we get
The propulsive efficiency will reach its peak (of 100%) when the ratio V/c approaches unity. A graph of the rocket propulsive efficiency is shown in Figure 12.20.
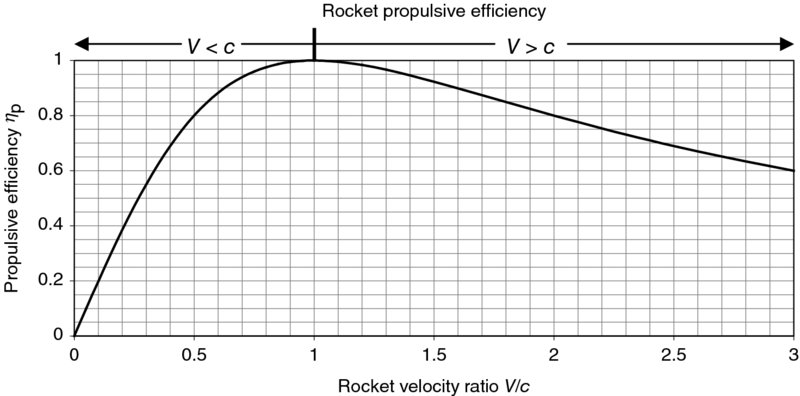
FIGURE 12.20 Rocket propulsive efficiency ηp stretches from V/c < 1to V/c > 1
A distinction between a rocket and an airbreathing engine is that a rocket may operate in V/c > 1, whereas an airbreathing engine has to operate with an exhaust velocity that is higher than the flight speed, since there is a ram drag penalty for the captured airstream. As a result, the range of V/c > 1 is unique to rockets.
Similar to an airbreathing engine, the overall efficiency of a chemical rocket engine is defined by the fraction of the chemical power invested in the combustor that is converted to the vehicle thrust power, that is,
The second term in the denominator of Equation 12.50 is the kinetic power of the propellant at the injector plate, that is, inlet to the thrust chamber. Often, the contribution of the injected propellant kinetic power is often small and thus neglected as compared with the chemical power of combustion.
12.11 Chemical Rocket Combustion Chamber
The liquid propellant rocket thrust chamber is composed of an injector plate, a combustion chamber, and an exhaust nozzle. The injector plate serves the function of an atomizer and mixer of the fuel and oxidizer streams. Since the thrust chamber needs to be cooled, the choice of propellant often calls for cryogenic propellants such as hydrogen and oxygen. To minimize storage volume, propellant is stored in liquid form in insulated tanks. The fuel and oxidizer latent heats of vaporization and subsequent heating of the gaseous form of the propellant provide cooling of the thrust chamber walls. Vaporizing and preheating of the propellant is actually advantageous to combustion efficiency and allows the products of combustion to attain higher temperatures in the combustor. The solid propellant combustion chamber houses the propellant and uses liners, insulators, and inhibitors to protect the walls from excessive heating. The period of operation of solid motors is thus limited by the amount of propellant that is carried inside the combustion chamber, which typically lasts from a few seconds to about 2 minutes for boosters.
12.11.1 Liquid Propellant Combustion Chambers
The design of injector plate is critical to stable combustion of the liquid propellant and high combustion efficiency. The stability of combustion is achieved through a large static pressure drop across the injector plate. The conventional design rule calls for 20% drop across the injector plate, that is, the chamber pressure pc is 20% less than the feed pressure of propellant upstream of the injector plate. This relatively large static pressure drop decouples small pressure isolations in the combustor from the propellant pressure feed oscillations. This instability is called chugging and is the easiest to be avoided. To achieve high efficiency in chemical reaction of the fuel and oxidizer streams, the injector plate design plays a critical role. The precombustion processes of atomization, vaporization, and mixing need to be efficiently accomplished through the injector plate. There are several design approaches to the injector plate, namely, fuel–oxidizer (or unlike stream impingement type), fuel–fuel and oxidizer–oxidizer (or like stream impingement type), parallel stream or showerhead nozzle type, and premix swirl chamber nozzle type. These injector plate design types are schematically shown in Figure 12.21.
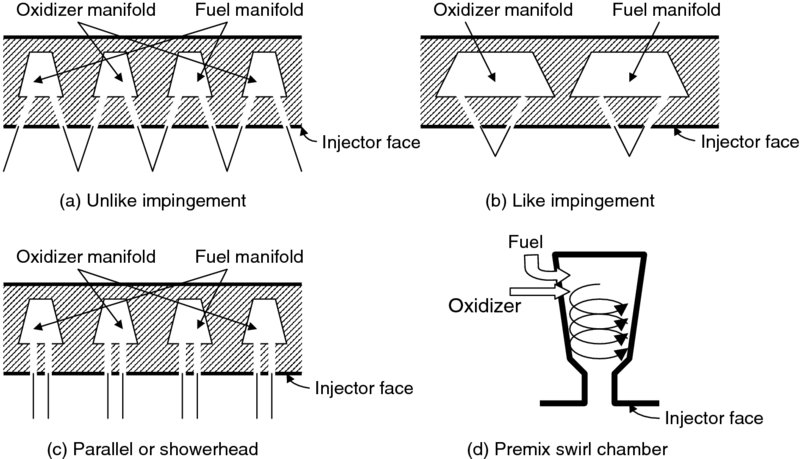
FIGURE 12.21 Schematic drawing of some injector plate design concepts
Precision in manufacturing of injector plates ensures proper mixture ratio of fuel and oxidizer that is brought together at a desired distance from the injector plate and at proper angle with respect to combustion chamber axis. Any misalignment in the orifice geometry and angle will cause inefficient mixing, poor combustion efficiency, and possibly chemical reaction that takes place at the wall with subsequent structural failure due to inadequate cooling. On the contrary, proper injector plate design will reduce the amount of backsplash and heat transfer to the thrust chamber walls and produce stable combustion with high efficiency. In sizing the orifice areas for the fuel and oxidizer, we use the Bernoulli equation corrected for viscous fluid effects, according to,

where Cd is the discharge coefficient, which is a function of the orifice geometry and Reynolds number. The mass flow rate per orifice opening follows the continuity equation, that is,
The ratio of the oxidizer-to-fuel mass flow rates is known as the mixture ratio r
From our studies of combustion (Chapter 12), we remember that for stoichiometric mixture ratio, the products of combustion reach nearly their maximum temperature. However, for a hydrogen (fuel) rich mixture ratio, r < rstoich, the products of combustion will have a lower mixture molecular weight and thus higher specific impulse. As a result, mixture ratio is often less than the stoichiometric value. Figure 12.22 (from Sutton and Biblarz, 2001) shows the result of thermochemical calculations for oxygen and a hydrocarbon fuel, known as RP-1, in a combustion chamber of 1000 psia pressure and perfect expansion to sea level ambient condition in the nozzle.
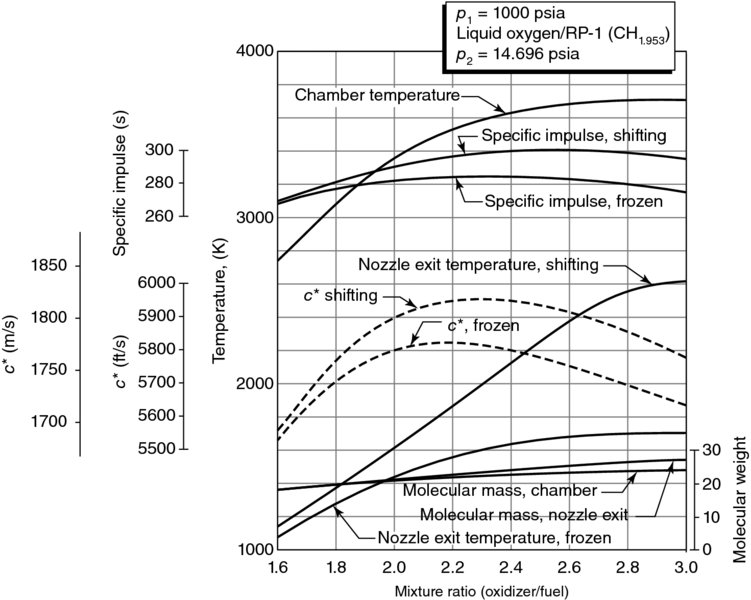
FIGURE 12.22 Thermochemical calculations for oxygen-RP-1 combustion with pc = 1000 psia, p2 = p0 = 14.7 psia. Source: Sutton and Biblarz 2001. Reproduced with permission from Wiley
Note that there are two sets of nozzle calculations shown in Figure 12.22. The frozen equilibrium calculation assumes constant combustion product composition in the nozzle, that is, the equilibrium mole fractions of the products of combustion remain unchanged as the result of flow expansion (i.e., cooling) in the nozzle. Frozen equilibrium calculations are simple but not very accurate in predicting rocket thrust chamber performance. The shifting equilibrium calculation, however, allows for chemical reaction in the nozzle as a result of flow expansion, thus it represents a more accurate description of the rocket thrust chamber performance. In either case, we note that the specific thrust has reached maximum at either the mixture ratio of ∼2.3 for frozen equilibrium or 2.5 for the shifting equilibrium calculations. Based on the chemical formula for RP-1, that is, CH1.953, stoichiometric oxidizer-to-fuel ratio is 3.413. Thus, the choice of the mixture ratio r is based on maximum specific thrust Is rather than maximum chamber temperature Tc. Also note that a fuel-rich rocket nozzle exit flow is advantageous to a ram-rocket configuration since the excess fuel may be used as the fuel in the ramjet/scramjet combustor.
Figure 12.23 (from Sutton and Biblarz, 2001) shows injector discharge coefficients for different orifice geometries that are suitable for rocket propulsion applications.
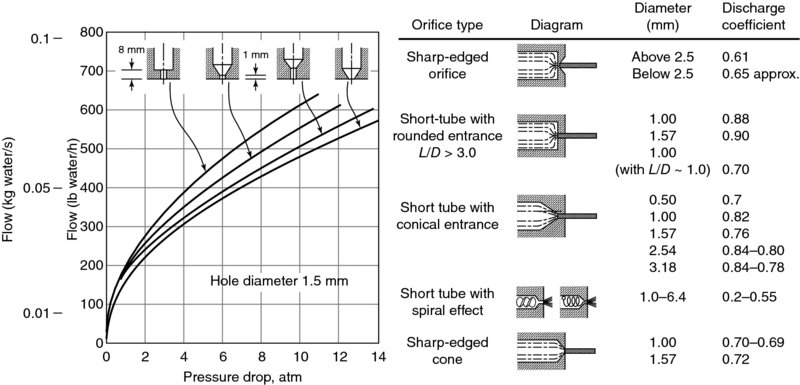
FIGURE 12.23 Discharge coefficients for typical injector orifice geometries, based on water tests. Source: Sutton and Biblarz 2001. Reproduced with permission from Wiley
For preliminary injector plate calculation purposes, we use the law of conservation of momentum applied to two colliding jets. Here, we assume that the resultant jet has the same mass flow rate as the sum of individual jets’ mass flow rates. Figure 12.24 is a definition sketch of two impinging jets, their angles γf and γo, and collision distance d from the wall. The real impingement jets, however, exhibit some backsplash as well as complex turbulent interactions, as schematically indicated in Figure 12.24b.
FIGURE 12.24 Definition sketch of two impinging jets
The resultant jet is assumed to emerge at angle δ with respect to chamber axis, as shown. The momentum balance in the chamber axis direction is
The momentum balance normal to the chamber axis direction is
The ratio of the two momentum equations will isolate the resultant jet flow angle δ
The resultant jet may be designed to emerge in the axial direction near the center of the combustion chamber and toward the center near the chamber walls. The schematic drawing of the resultant propellant stream is shown in Figure 12.25a. The chamber wall is regeneratively cooled by cryogenic propellant. Since rocket combustion often involves a fuel-rich mixture of the propellant, we may inject the extra fuel adjacent to the combustor wall as a means of thermal protection for the wall (Figure 12.25b)
FIGURE 12.25 Schematic drawing of possible propellant injection pattern in the combustion chamber
The total included angle at the impingement point is the sum of the two angles γo + γf. The total impingement angle impacts the extent of backsplash and potential chemical reaction and heating at the injector plate.
12.11.1.1 Some Design Guidelines for Injector Plate
Backsplash for impingement-type injectors, as noted earlier, can bring the propellant back toward the injector plate, where it may lead to chemical reaction and heat release with subsequent injector plate structural failure. To control backsplash, we place design limitations on impingement distance d and the total included (impingement) angle (γo + γf), namely,
To control chugging instability, we build in a large pressure drop across the injector plate, that is, (Δp)inj ≈ 0.2 pc. This is a ballpark rule as the actual pressure drop depends on the injector design, for example, unlike impingement, like-impingement, and others. Orifice diameters are to be small (∼ 0.4–2.4 mm) for good atomization. Smaller orifice diameters are prone to plugging. The orifice diameter ratio do/df ∼ 1.22 is recommended for unlike impingement. NASA publications (e.g., NASA SP-8089 and NASA SP-8120) on injectors and rocket nozzles are sources for additional reading that are highly recommended.
12.11.1.2 Combustion Instabilities
There are three main types of instabilities associated with chemical rockets. These are categorized based on their frequency range. The first type, which is the low frequency disturbance, is known as chugging. Its frequency range is between 10 and 200 Hz. The source is instability is the coupling between the pressure feed oscillations and the combustion chamber pressure oscillations. This form of longitudinal instability appears as pogo instability on the vehicle’s motion. The fix for this instability is in designing large static pressure drop (∼20% pc) across the injector plate as well as stiffening the coupling between the components of propellant feed system and the thrust chamber. The second mid-range instability is known as acoustical, buzzing, or entropy instability. The frequency range for this instability is 200–1000 Hz. The source of this intermediate frequency instability is the mechanical vibration of the propulsion system and possible coupling between the injector plate spray pattern and the turbulent eddies in the combustor. Acoustic coupling between the combustion and the injector plate propellant spray pattern is also deemed responsible for this instability. The third instability is of high frequency, that is, higher than 1000 Hz, known as the screeching or screaming instability. This type has its roots in the energy release pattern in the combustion chamber and resonant behavior with the combustor cavity. Injector face baffles, as shown in Figure 12.26 (from Sutton and Biblarz, 2001), have proven effective in control of screaming instability in liquid propellant rockets.
FIGURE 12.26 Main injector assembly of Space Shuttle Main Engine showing baffle with five outer compartments. Source: Sutton and Biblarz 2001. Reproduced with permission from Wiley
12.11.2 Solid Propellant Combustion Chambers
Solid propellants embody oxidizer, fuel, and a binder in solid or rubbery form. Solid propellants are categorized based on their composition. They are known as double-base (DB), composite, and composite modified double-base (CMDB). The double-base solid propellant is a homogeneous mixture of oxidizer, fuel, binder, and some additives (e.g., metal oxides and metal particles). The composite propellant is the heterogeneous mixture of fuel, oxidizer, binder, and additives. The composite modified double-base propellant is the combination of the first two types. As noted, the additives are often metal oxides and metal particles that enhance burning rates. Examples of solid propellants and their characteristics are shown in Table 12.3 (from Sutton and Biblarz, 2001). The U.S. Department of Defense (DOD) gives solid propellants (referred to as “explosives”) a hazard classification of 1.1 or 1.3, which regulates their manufacturing, handling, storage, labeling, and shipping (Explosive Hazard Classification Procedure, 1989).
![]() TABLE 12.3 Characteristics of Some Solid Propellants (from Sutton and Biblarz, 2001)
TABLE 12.3 Characteristics of Some Solid Propellants (from Sutton and Biblarz, 2001)
| Flame temperaturee | Density or specific gravitye | Stress (psi)/ Strain(%) | ||||||||||
| Propellant typea | Is Range (sec)b | (°F) | (K) | (lb/in3) | (sp.gr.) | Metal content (wt %) | Burning ratec, e (in/s) | Pressure exponente n | Hazard classification | − 60°F | + 150°F | Processing method |
| DB | 220–230 | 4100 | 2550 | 0.058 | 1.61 | 0 | 0.05–1.2 | 0.30 | 1.1 | 4600/2 | 490/60 | Extruded |
| DB/AP/AI | 260–265 | 6500 | 3880 | 0.065 | 1.80 | 20–21 | 0.2–1.0 | 0.40 | 1.3 | 2750/5 | 120/50 | Extruded |
| DB/AP-HMX/AI | 265–270 | 6700 | 4000 | 0.065 | 1.80 | 20 | 0.2–1.2 | 0.49 | 1.1 | 2375/3 | 50/33 | Solvent cast |
| PVC/AP/AI | 260–265 | 5600 | 3380 | 0.064 | 1.78 | 21 | 0.3–0.9 | 0.35 | 1.3 | 369/150 | 38/220 | Cast or extruded |
| PU/AP/AI | 260–265 | 5700 | 3440 | 0.064 | 1.78 | 16–20 | 0.2–0.9 | 0.15 | 1.3 | 1170/6 | 75/33 | Cast |
| PBAN/AP/AI | 260–263 | 5800 | 3500 | 0.064 | 1.78 | 16 | 0.25–1.0 | 0.33 | 1.3 | 520/16 (at –10°F) | 71/28 | Cast |
| CTPB/AP/AI | 260–265 | 5700 | 3440 | 0.064 | 1.78 | 15–17 | 0.25–2.0 | 0.40 | 1.3 | 325/26 | 88/75 | Cast |
| HTPB/AP/AI | 260–265 | 5700 | 3440 | 0.067 | 1.86 | 4–17 | 0.25–3.0 | 0.40 | 1.3 | 910/50 | 90/33 | Cast |
| PBAA/AP/AI | 260–265 | 5700 | 3440 | 0.064 | 1.78 | 14 | 0.25–1.3 | 0.35 | 1.3 | 500/13 | 41/31 | Cast |
| AN/Polymer | 180–190 | 2300 | 1550 | 0.053 | 1.47 | 0 | 0.06–0.5 | 0.60 | 1.3 | 200/5 | NA | Cast |
a Al, aluminum; AN, ammonium nitrate; AP, ammonium perchlorate; CTPB, carboxy-terminated polybutadiene; DB, double-base; HMX, cyclotetramethylene tetranitramine; HTPB, hydroxyl-terminatd polybutadiene; PBAA, polybutadiene–acrylic acid polymer; PBAN, polybutadiene–acrylic acid–acrylonitrile terpolymer; PU, polyurethane; PVC, polyvinyl chloride.
bAt 1000 psia expanding to 14.7 psia, ideal or theoretical value at reference conditions.
cAt 1000 psia.
The solid propellant burning rate r is defined as the speed of chemical reaction, that is, combustion, that progresses normal to a propellant grain surface. Therefore, the gaseous mass flow rate that emerges from a burning solid propellant grain surface is proportional to the surface burning area, the speed of propellant surface recession, and the grain density according to continuity equation
where ρp is the (solid) propellant grain density, in kg/m3 (or slugs/ft3), r is the surface recession or burning rate in cm/s (or in/s), and Ab is the surface area of solid propellant grain that is burning. An empirical formula that relates the burning rate to combustion chamber conditions, for an end-burning grain, is
where pc is the combustion chamber pressure, a and n are indices of combustion that are constant for different propellants. The constant a is a function of the propellant grain temperature and n is the pressure exponent, thus the burning rate is dependent on the combustion chamber pressure as well. We can demonstrate that for stable operation, n has to be less than 1. Note that the mass flow rate through the nozzle is proportional to chamber pressure pc, and if the chamber pressure drops the mass flow rate through the nozzle decreases. With a decrease in chamber pressure, the burning rate drops to a lesser extent if n < 1, thus causing the pressure to build up in the combustion chamber. However, if n > 1, the burning rate drops faster than the flow rate in the nozzle, thus leading to a further drop in the chamber pressure. This is clearly an unstable situation. Therefore, based on stability arguments, we conclude that the pressure exponent n in solid propellant grain burning rate has to be less than 1. Figure 12.27 shows the burning rate dependence on chamber pressure and initial grain temperature for several solid propellants. We note that the burning rate varies between ∼0.04 and 3 in/s or ∼0.1 and 7.5 cm/s. Also, the linear variation in the log−log plot supports the empirical formula 12.60. The indices a and n may be determined from the data in Figure 12.27. Note that there is a “Plateau DB” propellant that shows a constant burning rate with chamber pressure, thus it must have its pressure exponent, n = 0.
FIGURE 12.27 Dependence of burning rate of typical solid rocket propellants on chamber pressure and initial grain temperature. Source: Sutton and Biblarz 2001. Reproduced with permission from Wiley
Assuming a steady-state flow, we may equate the gasification of the solid propellant to the mass flow rate through a choked nozzle throat to get the area ratio Ab/Ath
Therefore, the ratio of burning-to-throat area is expressed as
Note that the RHS of Equation 12.62 is composed of three groups; the first is the combustor pressure dependence, the second is the combustion temperature dependence (in the denominator), and the last term is a function of gas property γ. For a given propellant, we note that chamber pressure is related to the area ratio Ab/Ath following

Since n is less than 1, the exponent of Equation 12.63 shows the amplification of the chamber pressure with a change in burning surface area increase. Therefore, a sudden appearance of a crack in the grain has the potential of creating a large chamber pressure rise, which may lead to a structural failure. This parameter, that is, the burning-to-throat area ratio, is an internal ballistic parameter to solid rocket motors and is given a symbol K. The temperature sensitivity of the grain burning rate for a constant chamber pressure and the temperature sensitivity of chamber pressure for a constant K are known as σp and πK, respectively. These are defined as
σp represents percentage change in burning rate r per degree change in initial grain temperature T while keeping the chamber pressure constant. πK represents the percentage change in chamber pressure per degree change in initial grain temperature for the same burning to throat area ratio K. These initial grain temperature sensitivities form the remaining internal ballistic parameters for a solid rocket motor. According to Kubota (1984), typical values for σp range from 0.002 to 0.008/K (or per °C) and the range of πK is related to σp via pressure index n according to
Since σp is the parameter that sizes the burning rate enhancement due to initial temperature of grain and n leads to the growth of chamber pressure, a solid propellant of low σp and n is desirable. Both burning rate and chamber pressure increase with initial grain temperature; therefore, the propellant is consumed at a faster rate and, thus, the burn time will be reduced. Since thrust is proportional to propellant mass flow rate, it is, therefore, inversely proportional to the burn time for a given propellant mass. But the burn time is reduced inversely proportional to the mass flow rate. Therefore, the integral of thrust over time, that is, the total impulse, remains constant. Figure 12.28 shows the effect of initial grain temperature on the thrust-time behavior of a solid rocket motor (from Sutton and Biblarz, 2001).
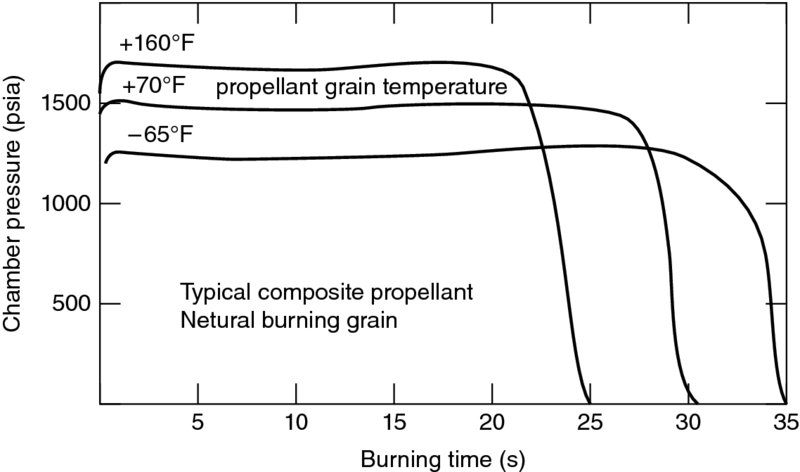
FIGURE 12.28 Thrust-time behavior for different initial grain temperatures for a neutral solid propellant rocket motor conserves the total impulse. Source: Sutton and Biblarz 2001. Reproduced with permission from Wiley
Solid propellant grain designs that incorporate a port area Ap experience an enhanced burning rate, known as erosive burning. For erosive-burning grains, heat transfer to the grain is increased due to the flow of hot combustion gases over the grain surface. The empirical rule for the burning rate thus includes the effect of gas speed. For example, we may express the erosive burning grain rate as
where r0 is the reference burning rate for an end burning grain and the parenthesis represents the erosive burning augmentation factor due to gas speed v, and the coefficient k is an empirical parameter. Figure 12.29 shows a definition sketch for a solid rocket grain that experiences erosive burning. The port area Ap varies along the length of the grain, as the enhanced burning rate consumes the propellant at a faster rate toward the nozzle throat, as shown.

FIGURE 12.29 Schematic drawing of an erosive burning solid propellant grain
Figure 12.30 shows the erosive burning augmentation ratio, r/r0, from Razdan and Kuo (1984). The linear relationship between the augmented burning rate and the freestream velocity is clearly demonstrated in Figure 12.30. We may extract the proportionality factor k from the experimental data of Figure 12.30. This task is left to a problem at the end of this chapter. Also note that erosive burning rate may be enhanced by nearly 50% or more (depending on the propellant type and gas speed) as compared with an end burning grain. This will clearly impact the burn time and rocket flight performance as well as pose special design issues for the casing thermal protection.
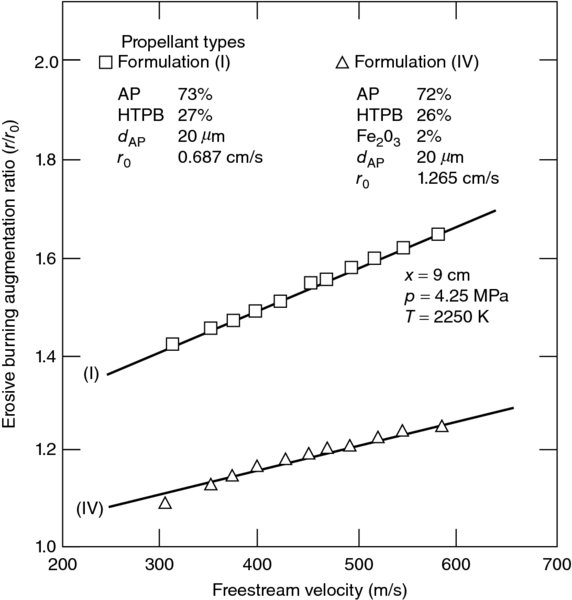
FIGURE 12.30 Erosive burning augmentation ratio. Source: Razdan and Kuo 1984. Reproduced with permission from AIAA
There are other factors that contribute to burning rate enhancement besides erosive burning. For example, longitudinal and lateral vehicle accelerations that are encountered in rapid maneuvers or for stability purposes can amplify the rate of gasification in a solid rocket motor. Spin-stabilized platforms and antimissile rockets experience large lateral and longitudinal accelerations. These longitudinal and lateral loads may also cause stress buildup and crack development in the grain. Cracks are structural failures that will impact the performance of the rocket. Due to the random, that is, unpredictable, nature of crack initiation and development with subsequent burning along the crack and with a potential compromise of the integrity of the liner, inhibitor, or the insulator, the mechanical aspects of grain design, processing, and installation are of critical importance to solid rocket motors.
Solid propellant motors encounter combustion instabilities that often involve pressure oscillations in the combustion chamber that are due to coupling between the combustion gas, the combustor cavity, and the flowfield in the combustor. The treatment of these complex interactions and the phenomenological behavior of the instabilities are beyond the scope of the present text. Price (1984), however, has addressed solid propellant combustion instabilities in detail; this is recommended for further reading.