
CHAPTER 11
Aircraft Engine Component Matching and Off-Design Analysis
11.1 Introduction
Source: Reproduced with permission from Rolls-Royce plc
How does an existing engine behave in an off-design operating condition? For an existing engine, we know its geometry and design-point parameters, such as compressor pressure ratio or turbine entry temperature. All the parameters that we used in the cycle analysis were in effect “design-point” parameters. For example, take compressor pressure ratio; it may be designed into a number of stages, each with a certain design pressure ratio. Although we cannot change the number of stages after the engine is manufactured, we may operate the compressor at a different shaft speed than its design speed, or, equivalently, we may operate the engine at a different throttle setting than its design. In general, the independent parameters that may be set and create an off-design flight condition for an airbreathing jet engine are
- Altitude of flight, which may include nonstandard ambient pressure and temperature, for example, arctic flight or seasonal effects
- Flight Mach number, from takeoff, climb, cruise, dash, approach, landing
- Throttle setting, that is, turbine entry temperature
- Afterburner setting, for example, -on, -off, or partial setting
- Nozzle area ratio setting, for example, to optimize installed thrust.
We will first consider individual component matching in a jet engine. Then we will examine the entire system from the gas generator to the whole aircraft engine at on- and off-designs.
11.2 Engine (Steady-State) Component Matching
What are the physical laws that need to be satisfied by engine components that interact with each other regardless of their mode of operation? In steady-state operation, the physical mass flow rate (e.g., in kg/s) through a component should be delivered in its entirety to the next component(s). For example, the air mass flow rate through the inlet must be equal to the fan mass flow rate, unless some air was bypassed in the inlet before getting to the fan, in an inlet flow stability scheme. This satisfies the law of conservation of mass.
The next conservation law that applies to the components that interact is the conservation of energy. For example, the low-pressure spool connecting the low-pressure turbine to the low-pressure compressor/fan via a shaft must deliver turbine shaft power output (e.g., in MW) to the low-pressure compressor allowing for possible power extraction for electric generator and frictional losses (i.e., energy dissipation) in the bearings supporting the rotating machinery. In addition, the compressor and turbine stages on the same shaft are constrained by the same physical shaft (angular) speed, that is, NLPC = NLPT and NHPC = NHPT for a two-spool machine.
There is also the law of conservation of atomic species. We studied this topic in Chapter 7 for a mixture of gases that were chemically reacting. In this chapter, we allow for a variable gas composition through a component, but we will not do an equilibrium chemical analysis of gas mixtures, except for the combustor. For example, the chemical reaction in a combustor produces a certain gas composition at the turbine entry. The flow expansion in the turbine, that is, the temperature drop, however, causes the gas composition to change. Applying the equilibrium gas chemistry principles will establish the gas composition at every operating condition. To simplify the process, that is, to avoid running the equilibrium gas chemistry codes (see, for example, Gordon and McBride, 1994) for every component, we choose to specify “appropriate” gas constants, γ, R or γ, and cp, per component entrance and exit condition (or cold and hot). In cycle analysis, we used three levels of gas constants, (1) inlet and compressor (or cold section), (2) turbine (or hot section), and (3) the afterburner and nozzle (or very hot section). Although the principle variable in establishing gas constants is the gas temperature, the fraction of hydrocarbon fuel content in the gas also impacts these variables.
A remark about the law of conservation of momentum is also in order, as it appears that it is omitted from our component matching discussions. In reality, we still use the law of conservation of momentum to calculate the force magnitude and direction that each component produces in the propulsion system (remember the section on fluid impulse in Chapter 2). However, in the steady-state component matching case, it is the mass and energy that dictate the interaction.
Finally, a brief review of engine corrected parameters is in order, as the component performance maps are often presented in these coordinates. There are five component and engine corrected parameters. These are (1) Corrected mass flow rate, (2) Corrected shaft speed, (3) Corrected fuel flow rate, (4) Corrected thrust, and (5) Corrected thrust-specific fuel consumption.
11.2.1 Engine Corrected Parameters
We studied in Chapters 8–10 that the corrected mass flow rate and corrected shaft speed are the parameters that fully describe the behavior of a compressor or turbine. These parameters are related to the axial and tangential Mach numbers in turbomachines, respectively. We had defined reference pressure and temperature, pref = 101.33 kPa and Tref = 288.2 K, respectively. Based on these reference conditions, we defined a δ and a θ parameter, for station i, according to
The corrected mass flow rate at station i is the mass flow rate through station i at the reference pressure and temperature:

The corrected shaft speed is

We may define a corrected fuel flow rate according to

Corrected thrust and thrust-specific fuel consumption, are

By taking the ratio of Equations 11.5 and 11.6, we relate three corrected parameters according to
11.2.2 Inlet-Compressor Matching
A simple schematic drawing of an inlet coupled to a fan (or compressor) is shown as a guide to discussion in Figure 11.1. The fixed areas are the inlet lip A1, engine face area A2, and compressor exit area A3. The variable is the free stream capture area A0, which is a strong function of flight condition, for example, takeoff, climb, or cruise.

 FIGURE 11.1 Schematic representation of the inlet-compressor matching
The ambient static pressure and temperature p0 and T0 and flight Mach number are independent variables as well. We may establish flight total pressure and temperature pt0 and Tt0 using the static values and flight Mach number M0. We will use the flight Mach number and total gas properties in the cycle component matching and off-design analysis.
The physical mass flow rate through an area A is tied to axial Mach number Mz, local pt, and Tt. The expression for the mass flow rate in terms of these variables is

The engine face (physical) mass flow rate (e.g., in kg/s or lbm/s) is
The inlet mass flow rate is

The law of conservation of mass demands that the inlet flow rate and the airflow rate into the engine to be equal (assuming there is no inlet bleed), that is,

The conservation of energy, along with the assumption of the adiabatic flow in the inlet, identifies a constant total enthalpy flow or equivalently constant total temperature, if we assume constant cp. Therefore, eliminating the terms that remain unchanged between the flight condition and engine face in Equation 11.11, we get

The right-hand side (RHS) in Equation 11.12 is completely known for a given flight Mach number M0. The left-hand side (LHS) contains three unknowns, (1) inlet total pressure recovery πd, (2) the free stream capture area A0 (or the ratio A2/A0), and (3) the axial Mach number at the engine face, Mz2. A typical inlet performance map contains the inlet recovery variation with flight Mach number, that is, πd = f (M0), or we may use the AIA or MIL-E 5008-B standards that we presented in Chapter 6. Therefore, the mass and energy balance for the inlet/compressor results in two unknowns A0 and Mz2 for any flight Mach number M0.
The main area of concern in inlet-compressor matching is, however, tied to the inlet distortion problem. We have addressed both the inlet steady state and dynamic distortion effects on compressor performance extensively in Chapter 8. The ensued unsteadiness and instability in a compressor/fan, that is, stall and surge, find their roots often in inlet distortion.
11.2.3 Compressor–Combustor Matching
In a steady-state operation, the compressor (air) mass flow rate combines with the fuel flow rate in the combustor to form the exit mass flow rate at the entrance to the turbine. Figure 11.2 shows the combination of the compressor and burner and the three stations that connects them.

FIGURE 11.2 Compressor–combustor matching with their respective mass flow rates, areas, and Mach numbers
The mass flow rate at the burner exit is
The unknowns on the RHS of Equation 11.13 are the fuel-to-air ratio f and the axial Mach number at the engine face, Mz2. The fuel-to-air ratio is set by the throttle, which is an independent parameter. Therefore, we consider the throttle setting as known in an off-design operating condition. We can also write the burner exit mass flow rate in terms of total pressure pt4 and temperature Tt4, flow area A4, and the local Mach number M4, namely,
Now, let us examine the RHS of Equation 11.14. If we take the station 4 as the exit of the first turbine nozzle, then over a wide operating condition, it remains choked, that is, M4 = 1. The combustor exit total pressure pt4 = πb · pt3, which for an assumed combustor total pressure loss πb is the compressor discharge total pressure pt3, which may be written as
The combustor exit total temperature Tt4 is throttle setting dependent and is thus treated as known. In light of Equation 11.15, let us recast Equation 11.13 in the following form:

The RHS of Equation 11.16 is a function of axial flow Mach number at the engine face, Mz2 and throttle setting. Also, we note that the RHS of Equation 11.16 is proportional to the corrected mass flow rate at the compressor face. Therefore, we conclude that for a given compressor corrected mass flow rate and engine throttle setting, Tt4/Tt2 and f, we can establish a unique compressor pressure ratio πc. This is consistent with our earlier studies of turbomachinery as depicted in Figure 11.3 (reproduced from Figure 8.57), where a compressor performance map shows the throttle lines (Tt4/Tt2 = constant, or nominal operating line) and the engine corrected speed lines Nc. The path of steady-state engine operation is shown as the engine “operating line” in Figure 11.3. An alternative view of Equation 11.16 is that for a given compressor pressure ratio and the throttle setting, there is a unique corrected compressor mass flow rate, which is a pure function of the axial Mach number into the engine, Mz2. We may use Equation 11.16 with the design choices for πc, Mz2, Tt4/Tt2, and f (and an assumed πb) to calculate A4/A2. This area ratio remains constant (for the fixed-area turbines) at off-design.
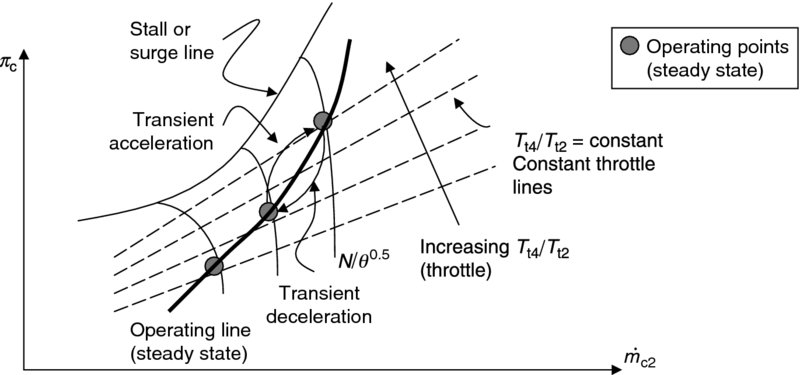
FIGURE 11.3 Operating line (or compressor–combustor matching) on a compressor map
The energy balance across the combustor reveals the fuel-to-air ratio f as
The unknowns on the RHS of Equation 11.17a are ht3 and ηb, assuming that the throttle setting has specified Tt4 in the off-design condition. Once we establish a compressor pressure ratio at the off-design operation, ht3 becomes known. We may use either a burner efficiency correlation for ηb (e.g., from Figure 7.40) or an assumed value to proceed with the calculation of the new fuel-to-air ratio f at off-design. In terms of the constant-throttle-line parameter Tt4/Tt2, as shown in Figure 11.3, and compressor temperature ratio, we can rewrite Equation 11.17a by dividing its numerator and denominator by the total enthalpy at the engine face, ht2, to get
Finally, the compressor power is matched to the shaft power produced by the turbine when we account for any external (electric) power extraction and bearing frictional losses. The physical shaft rotational speed N is the same for the compressor–turbine stages on the same spool (i.e., shaft). We will address these matching requirements in the compressor–turbine matching section.
11.2.4 Combustor–Turbine Matching
The steady-state combustor–turbine interaction is dominated by (1) choked turbine nozzle (i.e., M4 = 1, which acts as the first throttle station in the gas turbine engine), (2) turbine cooling requirements, (3) hot spots in turbine entry, and (4) loss of turbine efficiency due to cooling. The latter three issues relate to either combustor design or turbine cooling and its impact on efficiency. Our goal in turbine off-design analysis is primarily to calculate turbine expansion parameter (i.e., its power production capability). The effect of cooling on turbine aerodynamics is often modeled as an equivalent uncooled turbine operating at a lower adiabatic efficiency, for example, ηt = 0.75−0.85. Figure 11.4 shows the schematic drawing of a combustor–turbine with part (a) showing an uncooled turbine and part (b) showing a cooled turbine. The two epsilons ![]() 1 and
1 and ![]() 2 in Figure 11.4(b) depict air-cooling mass flow fractions that are bled from the compressor at an intermediate pressure point and at the compressor exit, respectively.
2 in Figure 11.4(b) depict air-cooling mass flow fractions that are bled from the compressor at an intermediate pressure point and at the compressor exit, respectively.

FIGURE 11.4 Combustor–turbine matching
The physical mass flow rates at stations 4 and 5 are equal, if the turbine is uncooled. Therefore, by writing the corrected mass flow rates in both stations as
And taking the ratio of the above two expressions, we relate the corrected mass flow rates at turbine entrance and turbine exit according to

The RHS of Equation 11.19 relates to turbine expansion, and it is this parameter that controls the axial Mach numbers, that is, mass flow rate, through the turbine. We will encounter this parameter again in this chapter. In the cooled turbine case, we need to account for the mass flow rate of the coolant, which is injected between stations 4 and 5 in the turbine. Therefore,
The corrected mass flow rates, in the cooled turbine case, are related by cooling fractions according to

One last comment about τt is that in a cooled turbine case, Tt5 is reduced as a result of coolant injection in the hot gas stream. Therefore τt (cooled turbine) is reduced compared with τt in an uncooled turbine. Another impact of cooling the turbine is on πt, which is also reduced as the turbulent mixing of the coolant injection into the hot gas causes a total pressure drop in the turbine.
11.2.5 Compressor–Turbine Matching and Gas Generator Pumping Characteristics
The law of conservation of energy is applied to a compressor that is driven by a turbine on the same shaft. The schematic drawing of a compressor–turbine rotating assembly is shown in Figure 11.5. We may account for power dissipation in bearings through mechanical efficiency ηm, which results in the following form of law of conservation of energy:

FIGURE 11.5 Schematic drawing of a compressor–turbine rotating assembly on the same shaft
Dividing Equation 11.22a by the air mass flow rate and the total enthalpy at the engine face (which is the same as the flight total enthalpy), we get

We shall demonstrate that the turbine expansion parameter τt remains constant over a wide operating range in the engine off-design condition; therefore, we may conclude from Equation 11.22b that the compression parameter (τc − 1) varies linearly with the throttle parameter Tt4/Tt2 in off-design. Ignoring the variation of ηm(1 + f) in on- and off-designs, we get

From Equation 11.23, we arrive at the off-design compressor pressure ratio based on either compressor polytropic or the adiabatic efficiency according to
In terms of the throttle ratio Tt4 / Tt2 and adiabatic efficiency, the compressor off-design pressure ratio is
Since compressor and turbine performance maps are always shown in terms of the corrected parameters, that is, corrected mass flow rate and the corrected shaft speed, we express the offdesign performance of the gas generator in corrected terms as well.
The common shaft between the compressor and turbine has the same angular speed ω = 2πN. Therefore, the corrected shaft speeds of the compressor and turbine, which are defined as
are related to each other by the throttle parameter, that is,
Since we had demonstrated in Chapter 8that compressor (specific) work is proportional to the square of shaft speed (through turbine Euler equation), that is,
Divide Equation 11.26 by Tt2 to arrive at the corrected shaft speed, that is,
Now, by comparing Equation 11.27 with Equation 11.25c, we conclude that for τt = constant, the corrected shaft speed Nc4 remains constant, and Nc2 is proportional to the square root of the throttle parameter Tt4/Tt2, that is,
Again, the corrected mass flow rates in compressors and turbines are
The physical mass flow rates in compressors and turbines are different only by the amount of fuel that we consume in the burner, therefore, Equations 11.29a and 11.29b yield
Since the flow in station 4 is choked (over a wide operating range), the corrected mass flow rate is constant at 4 and we thus conclude that


Figure 11.6 shows typical compressor and turbine performance maps in corrected parameters, with constant adiabatic efficiency contours and the respective operating lines.

FIGURE 11.6 Typical compressor and turbine performance maps used in component matching studies
11.2.5.1 Gas Generator Pumping Characteristics
In the previous sections, we studied the component matching at on- and off-designs for an “on-paper” aircraft engine with a chosen set of design parameters. However, in the case of an existing gas generator where component performance maps are available, we can study all its possible operating conditions by establishing its so-called pumping characteristics. They are (1) the corrected airflow rate ![]() , (2) the pressure ratio of the gas generator, pt5/pt2, (3) the temperature ratio of the gas generator, Tt5/Tt2, and (4) the fuel flow parameter, fQRηb/cpTt2 or the corrected fuel flow rate
, (2) the pressure ratio of the gas generator, pt5/pt2, (3) the temperature ratio of the gas generator, Tt5/Tt2, and (4) the fuel flow parameter, fQRηb/cpTt2 or the corrected fuel flow rate ![]() . The pumping characteristics are often expressed as a function of percent corrected shaft speed %Nc2 and the throttle parameter Tt4/Tt2.
. The pumping characteristics are often expressed as a function of percent corrected shaft speed %Nc2 and the throttle parameter Tt4/Tt2.
From Equation 11.30a, we have

There are two corrected mass flow rates per unit area in Equation 11.32. These are pure functions of axial Mach number and gas constants. Since the turbine nozzle remains choked at design and over a wide operating range of the engine, its corrected mass flow rate is

The corrected mass flow rate at the engine face, per unit area, is
Figure 11.7a shows a graph of Equation 11.33. A general graph of the corrected mass flow rate per unit area is shown in Figure 11.7b. The typical compressor and turbine entry (Mach number) range are identified.
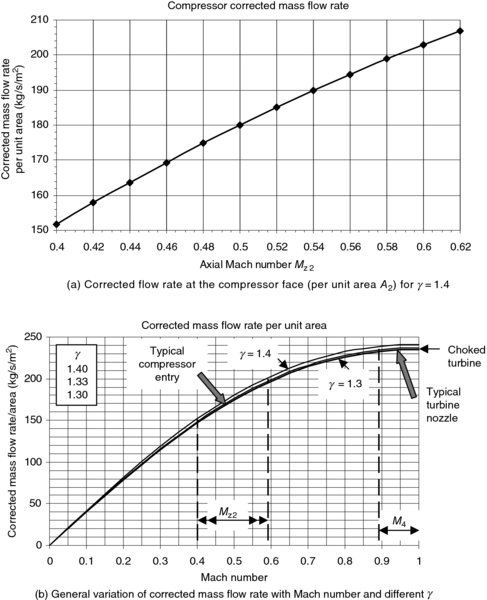
FIGURE 11.7 Corrected mass flow rate per unit area A
As stated earlier, from the engine design point, we calculate A2/A4 from Equation 11.25 to be

The RHS of Equation 11.34 involves known parameters at the design point, for example, we may have chosen the following design values:
The fuel-to-air ratio is
If we substitute these values and πb ≈ 0.97, in Equation 11.34, we get the area ratio A4/A2 ≈ 0.08.
Now, we have the constants in Equation 11.34, that is,

Let us graph Equation 11.35 for the compressor pressure ratio versus the corrected mass flow rate for different throttle parameters. Figure 11.8 shows the compressor map based on Equation 11.35.

FIGURE 11.8 Compressor map (note that the graph is valid for πc > 1)
An exploded view of the compressor map at low-pressure ratios is shown in Figure 11.9. The power balance between the compressor and turbine yields an equation for τt according to


FIGURE 11.9 An exploded view of compressor map at low-pressure ratio
Also for the gas generator pumping characteristics, Tt5/Tt2, we write

Another pumping characteristic is pt5/pt2, which is the product of component pressure ratios according to
The turbine pressure ratio πt is related to turbine temperature ratio τt and adiabatic efficiency ηt according to
The fuel flow parameter in the gas generator is

The ![]() in Equation 11.40 is the “average” of the cold and hot cp. The turbine corrected shaft speed is related to the compressor corrected shaft speed via Equation 11.25c. It is rewritten and boxed for the gas generator matching.
in Equation 11.40 is the “average” of the cold and hot cp. The turbine corrected shaft speed is related to the compressor corrected shaft speed via Equation 11.25c. It is rewritten and boxed for the gas generator matching.
An example illustrates the calculation technique for gas generator pumping characteristics over a range of corrected shaft speeds for a constant throttle parameter Tt4/Tt2.
11.2.6 Turbine–Afterburner–(Variable-Geometry) Nozzle Matching
As we are marching along the components of a gas turbine engine, the turbine may be followed by an afterburner, as in fighter/military aircraft, or a variable-geometry exhaust nozzle. It is thus convenient to analyze all three components in this section. What is the role of afterburner in matching with the turbine and the exhaust nozzle? The afterburner-off mode, which is referred to as the “dry” mode, is just a duct with total pressure loss associated with the viscous effects in an adiabatic flow (i.e., the afterburner-off case). The afterburner-on mode, which is referred to as the “wet” mode, impacts the mass flow rate in the exhaust nozzle in two major ways: (1) the hot gas in the afterburner has a much reduced density and (2) the mass flow rate in the nozzle is increased by the amount of fuel burned in the afterburner. There is also an additional total pressure loss due to combustion in the afterburner that we discussed in Chapter 7. The choked exhaust nozzle throat adjusts itself with afterburner operation, that is, it opens, to accommodate the extra mass flow rate at a reduced density with higher pt-losses, but it still remains choked. Figure 11.10 shows the turbine matched to an afterburner and an exhaust nozzle with afterburner-off (top portion) and -on mode (bottom portion).
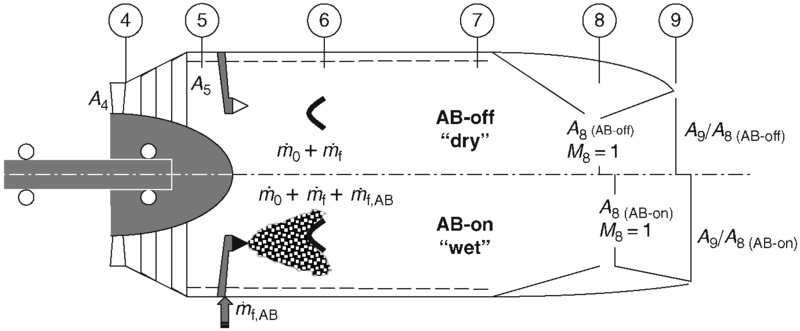
FIGURE 11.10 Schematic drawing of turbine–afterburner–nozzle matching in “dry” and “wet” modes
The exhaust nozzle throat, as indicated in Figure 11.10, remains choked in both dry and wet modes. In the dry mode, the total temperature at the turbine exit remains constant throughout the afterburner and the nozzle. The law of conservation of mass for stations 4 and 8 reveal

Since both stations 4 and 8 are choked, M4 = M8 = 1, we may rewrite Equation 11.42 as
The stagnation pressure at the nozzle throat is (pt5)πAB–off and Tt8 = Tt5; therefore, Equation 11.43 yields

The RHS of Equation 11.44 remains nearly constant between on- and off-design operations of the engine. This result is very important in engine off-design analysis, that is,

With the afterburner-on or wet mode, the continuity equation written for the two choked stations 4 and 8 gives

The nozzle throat in the AB-on mode is actuated to pass through the afterburner flow with sonic condition without affecting the backpressure of the turbine. In essence, the exhaust nozzle throat is just a valve. Therefore, since A8(AB-on) is inversely proportional to πAB, wet and directly proportional to the square root of τAB, wet and is sized to accept the additional mass flow rate due to the afterburner (i.e., fAB), we conclude that
Note that the two constants on the RHS of Equations 11.45 and 11.48 are only different as the gas properties vary with afterburner operation, otherwise, turbine expansion remains unaffected with/without afterburner operation in on- and off-design modes when the gas generator is coupled to a variable-area nozzle.
Theoretically, the nozzle exit area A9 variation is an independent parameter, which is intended to optimize the installed thrust with afterburner in operation. We will thus treat the nozzle area ratio A9/A8 as a given or prescribed parameter in our off-design analysis. The ideal value of the nozzle area ratio A9 /A8 corresponds to the perfect expansion, that is, p9 = p0, which maximizes the nozzle gross thrust. In practice, however, there is an A9, max that is dictated by the nacelle aft-end geometry/envelope. In selection/scheduling of A9/A8 with flight Mach number, altitude, and afterburner operation, A8 is dictated by the afterburner operation and A9, Max by the engine envelope.
11.2.6.1 Fixed-Geometry Convergent Nozzle Matching
In fixed-geometry convergent nozzles, the turbine is no longer decoupled from the exhaust nozzle. The turbine backpressure is continually affected by the (mass flow rate in the) nozzle, which in turn sets the turbine shaft power delivered to compressor, and thus the compressor pressure ratio. The compressor pressure ratio and the corrected mass flow rate then establish the shaft speed. The only independent variable is thus the fuel flow rate (or throttle setting), which finds a consistent shaft speed with the gas generator pumping characteristics and the mass flow rate through a constant-area convergent nozzle. From continuity equation written between station 8 and 2, we have

Equation 11.49 contains, for the most part, gas generator pumping characteristics. A corrected shaft speed Nc2 gives us pt5/pt2, Tt5/Tt2 and ![]() for a throttle setting Tt4/Tt2. Also, the nozzle corrected mass flow rate per unit area is either the maximum value corresponding to a choked exit (i.e., M8 = 1.0), or it may be calculated based on the nozzle pressure ratio pt7/p0. In either case, there is a unique relationship between the pumping characteristics variables in Equation 11.49 that is dictated by A8/A2 = constant, which corresponds to a certain throttle setting. Therefore, we may not specify both the corrected shaft speed and the throttle parameter simultaneously in a gas turbine engine with a fixed-area convergent exhaust nozzle. In general, a given throttle setting Tt4/Tt2 finds a corrected shaft speed Nc2 that provides for the mass flow and the (shaft) power balance between all the components in the engine.
for a throttle setting Tt4/Tt2. Also, the nozzle corrected mass flow rate per unit area is either the maximum value corresponding to a choked exit (i.e., M8 = 1.0), or it may be calculated based on the nozzle pressure ratio pt7/p0. In either case, there is a unique relationship between the pumping characteristics variables in Equation 11.49 that is dictated by A8/A2 = constant, which corresponds to a certain throttle setting. Therefore, we may not specify both the corrected shaft speed and the throttle parameter simultaneously in a gas turbine engine with a fixed-area convergent exhaust nozzle. In general, a given throttle setting Tt4/Tt2 finds a corrected shaft speed Nc2 that provides for the mass flow and the (shaft) power balance between all the components in the engine.
11.3 Engine Off-Design Analysis
We may now apply the principles learned in steady-state component matching to engine offdesign analysis. We first start with a simple (i.e., nonafterburning) turbojet engine. The known set of design parameters is
| 1. Design flight condition | M0, p0, T0 |
| 2. Design compressor pressure ratio | πc |
| 3. Ideal heating value of the fuel | QR |
| 4. Design turbine inlet temperature | Tt4 (or expressed as τλ) |
| 5. Design component efficiencies | πd, ec, πb, ηb, et, ηm, πn |
| 6. Design nozzle exit pressure or area ratio | p9/p0 or A9/A8 |
| 7. Gas properties at design point | γc, cpc, γt, cpt |
| 8. Design corrected mass flow rate | |
| 9. Design corrected shaft speed | Nc2 |
| 10. Design axial Mach number at 2 | Mz2 |
Then, we subject the turbojet engine to off-design conditions, namely,
| 1. Off-design flight conditions (specified) | M0, p0, T0 |
| 2. Off-design turbine inlet temperature (specified) | Tt4 or τλ |
If we assume that the component efficiencies remain the same (between on- and off-designs), the only cycle parameter that needs to be established in off-design condition is the compressor pressure ratio τc, which in turn establishes the off-design corrected mass flow rate and corrected shaft speed. We may also choose to specify component efficiencies at off-design based on the component performance map or empirical data. To aid with the analysis, a schematic drawing of a simple turbojet engine and its station numbers is shown in Figure 11.11. Note that the combination of the axial Mach number and the corrected mass flow rate at any station determines the flow area in that station. The corrected mass flow rate at the compressor face and the design Mach number Mz2 sizes the fan/compressor face area A2.

FIGURE 11.11 Schematic diagram of a turbojet engine, its station numbers, and design parameters
11.3.1 Off-Design Analysis of a Turbojet Engine
To simplify the task of engine off-design analysis, we make two assumptions:
- Turbine inlet is choked at both design and off-design operations, that is, M4 = 1.0
- Exhaust nozzle is choked at both design and off-design operations, that is, M8 = 1.0
Assuming the same gas properties between the on- and off-design conditions as well as fixed areas A4 and A8, we had shown (in Equation 11.44) that

But, we also remember that πt and τt are related via turbine polytropic efficiency et according to
Therefore, if we assume that the turbine polytropic efficiency remains constant between the on- and off-design operations, we may conclude that the turbine expansion parameter τt remains constant, that is,
Based on this conclusion, the key to solving for the unknown compressor pressure ratio at offdesign is
- establishing τt from the design-mode operation
- use power balance between the compressor and known turbine expansion parameter τt to calculate the off-design compressor pressure ratio
- calculate the new corrected mass flow rate and shaft speed at off-design
The best way to demonstrate the approach to engine off-design analysis is to solve an example problem.
11.3.2 Off-Design Analysis of an Afterburning Turbojet Engine
As we learned in the cycle analysis in Chapter 4, the design parameters for an afterburning turbojet engine are
- M0, p0, T0, γc, and cpc
- πd
- πc and ec
- QR, πb, ηb, Tt4
- et, ηm, γt, cpt
- QRAB, πAB, ηAB, Tt7, γAB, cpAB
- p9/p0
 , Nc2, Mz2
Assuming that the first turbine nozzle and the throat of the exhaust nozzle are choked at design point, that is, M4 = M8 = 1.0, and remain choked for off-design operation, we have shown in the previous section that
![]() constant for both AB-on and AB-off modes of operation at on- and off-designs.
constant for both AB-on and AB-off modes of operation at on- and off-designs.
We may also conclude that τt remains constant as πt is related to τt by the polytropic efficiency of the turbine, et and γt. Again, the strategy is to calculate the turbine expansion parameter τt at design point and use it to calculate the compressor pressure ratio at off-design operation. The approach is identical to the simple turbojet that we studied in the previous section.
At off-design, the following flight, throttle, and efficiency parameters are specified or assumed:
- M0, p0, and T0, γc, cpc
- πd
- ec
- QR, πb, ηb, Tt4
- et, ηm, γt, cpt
- QRAB, πAB, ηAB, Tt7, γAB, cpAB
- p9/p0
Comparing the two lists, we note that the only missing parameter at off-design is the compressor pressure ratio πc–o–D, which in turn determines the corrected mass flow rate and the shaft speed at off-design. The enabling concept that bridges the two modes (i.e., on- and off-designs) is
Now, let us solve an example problem.