CHAPTER 2
Customers Drive the Lean Company
A business is not defined by the company’s name, statutes, or articles of incorporation. It is defined by the want the customer satisfies when he buys a product or a service. To satisfy the customer is the mission and purpose of every business. The question “What is our business?” can, therefore, be answered only by looking at the business from the outside, from the point of view of customer and market. What the customer sees, thinks, believes and wants, at any given time, must be accepted by management as an objective fact … And management must make a conscious effort to get answers from the customer himself rather than attempt to read his mind.
There are many aspects of what the customer wants. The first aspect is to precisely identify what the customer wants in terms of the product and service. The second one is to understand the rate at which the customer wants the product or service as well as the customers’ expected delivery time to receive the product or service. As the following quotes show, both Henry Ford and the Toyoda recognized the importance of the customer. When businesses fail to keep pace with their customers’ needs, they lose money.
The product alone governs—that is, the public governs. And seeing that it does govern is management. (Ford 2003, p. 127)
Don’t talk about true value without conducting exhaustive market trials. (Sakichi Toyoda as quoted by Hino 2006, p. 5)
Study what customers want and reflect that in your products. (Kiirchiro Toyoda as quoted by Hino 2006, p. 6)
Recognizing the importance of the customer to business success is not new. It was not invented as part of lean. The main objective of the company has always been to make money (Goldratt and Cox 1984). To do this, the company must pay attention to the customer who actually buys the product or service provided by the company. The customer will only buy from the company if it provides a unique product or capability to the customer for which the customer is willing to pay (Hayes and Pisano 1996). So, the customer is the key to the company’s success, which means that the work must be designed to satisfy the customer by providing a product or service which is valued by the customer.
To understand what the customer wants, the business must answer a series of questions to determine how best to serve their customers (Drucker 1973):
What is our business?
Who is the customer?
Where is the customer?
What does the customer buy?
What is value to the customer?
What Is Our Business?
As the environment changes, the answers to this question will change, so managers must answer it carefully by considering all the alternatives. For example, the managers must consider whether their business is to stock and sell machinery components to use in repairing equipment or to provide information to customers about the advantages of using the alternative components in different ways? The managers’ decisions about what their business provides to their customers determines how the company should best be structured to satisfy the customers’ needs. The managers must make changes to their firm’s structure and policies to enable their company to achieve customer satisfaction.
Who Is Our Customer?
Many products have multiple customers. A company selling toys to children must have a toy that appeals to the child and also addresses the parents’ needs to ensure their child’s safety and the parents’ ability to pay for the toy. A company that is in the business of selling information about machinery components, might see a set of customers at each company it serves. This set of customers would include the maintenance mechanic, the manufacturing engineer, and the purchasing department of the company. The manufacturing engineer might be interested in various performance characteristics of the replacement part, the maintenance mechanic might be interested in the installation procedures, while the purchasing department would be interested in the pricing and payment terms. It is important for a company to identify all the customers of its business and to recognize the differences between these customers.
Where Is the Customer?
This is important, because our customers may move over time or our customer base may change. If we are producing mining equipment and new ore fields develop across the world, we have to consider location. If we are an ice cream shop, the question is important to know if our customers are in the neighborhood or at a food court in a mall.
What Does the Customer Buy?
This is often discussed as the order winning characteristic. If the customer is purchasing a hamburger, did they purchase it because of its taste, its price, or because of the speed with which it was delivered? The answer to this may change for an individual over time. One day they may choose to buy a hamburger at one restaurant because of speed. The next day they may purchase a hamburger at a different restaurant because of the taste.
What Is Value to the Customer?
It is important to understand that value is more than the actual material price of the product or service. Value for a customer is a function of what the customer receives for the price. For example, if the customer collects baseball memorabilia and pays $1,000 for an autographed baseball, the value for the customer is in the uniqueness of the baseball and how it reminds them of a particular event and in the status they earn by owning it. This question of customer value is easier to answer if the company has fully answered the first two questions of “What is our business?” and “Who is our customer?”
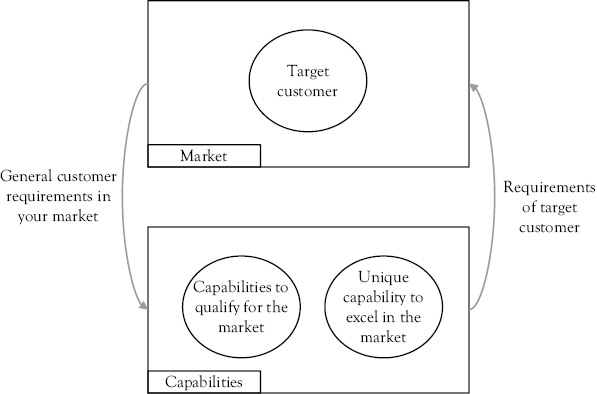
Figure 2.1 Identifying the target customer
As shown in the Figure 2.1, a company must not only know what business it is in but also know who its customer is and where this customer is located. This identifies the target customer for the company. This information tells the company what capabilities it must have to satisfy these customers and helps to guide its search to create a unique capability that will allow it to excel in the market.
The alignment between customer (and what the customer perceives as value) and a company’s unique operational capabilities is the key to a firm’s success. Therefore, knowledge about what the customer wants should drive the work design to align company capabilities with the market requirements of your target customers. Markets are constantly changing. Therefore, constant communication with the customer by asking these questions is important to not become detached from the market.
Example: The Eis-Sahne Ice Cream Shop answered the preceding five questions in the following way.
What is our business? We are in the business of providing ice-cream cones to retail customers, who want a short break from working or from shopping.
Who is the customer? Given the previous business description, the customer is an individual or family that is shopping and wants a break. Or the customer is someone who is working and wants a break.
Where is the customer? The business description tells us that we are concerned with shoppers and business people located in a shopping district or in a shopping mall. So we are looking at significant amounts of foot traffic; people whose primary purpose was not to buy ice cream. Rather, they want ice cream as a break from doing something else.
What does the customer buy? The customer is not only buying the ice-cream cone product but also buying a break from either their work tasks or their shopping tasks. We need more information about the customer to determine if the customer wants to sit and if so, what type of sitting experience and what type of atmosphere they would want in the shop.
What is value to the customer? A key factor is recognizing that the customer wants a break. This implies that fast, polite, friendly service will be important. It is important to investigate whether this is correct and what other factors are important to the various customers.
An important concept in this context is strategic fit. The concept of “strategic fit” means that a company’s production system should reflect its competitive position and strategy (Skinner 1969). Since companies have different strengths and weaknesses, they may choose to add value for customers in different ways. Each company’s processes have different operating characteristics, so the operations manager has to design a process that reflects the priorities and tradeoffs implicit in its specific competitive situation. This is aligning a company’s capabilities with customer demand through strategic decisions about how to create these required capabilities. Yet, in doing so, a manager should focus on the unique capabilities of the company as:
… companies succeed in the long run not just by building competitive fortresses for themselves, or by equipping themselves with the latest technologies or facilities, but more importantly by being able to do certain things better than their competitor can. (Hayes and Pisano 1996)
Example: The manager of the Eis-Sahne Ice Cream Shop has just learned that a well-known chain of ice cream stores will open in a location near them in 6 months. The manager is confident that Eis-Sahne will retain their customers if they can continue to provide fast, friendly service in a relaxing atmosphere. So the manager is evaluating how the current process provides each of these attributes desired by the customers. That is, the manager is evaluating Eis-Sahne’s strategic fit.
When Ford developed its production system the market was production driven rather than customer driven.
… Ford’s view that the market was production-driven—that everyone would buy black cars as long as they were cheap enough— the original purpose of the belt conveyor system was lost. Ford’s philosophy was transformed into a philosophy embracing mass production: Whatever could be produced, should be produced in large quantities. (Hino 2006, pp. 5–6)
Currently, we observe a largely customer driven market. So we have to produce what the customer wants at the rate at which the customer wants it.
This raises the question of how a company translates the customers’ wants into objectives that it can match to its process? The issue is how the company can make customer requirements visible and then create an explicit and operational voice of the customer (VOC) to design its production or service processes?
As illustrated in Figure 2.2, for managers to position their company, they need to start with a full understanding of what the customer wants. This allows the manager to set process goals, which, in turn, allows the manager to operationally define the process requirements. This, in turn, allows the manager to create an appropriate work design. Each step defines the boundaries for the next.
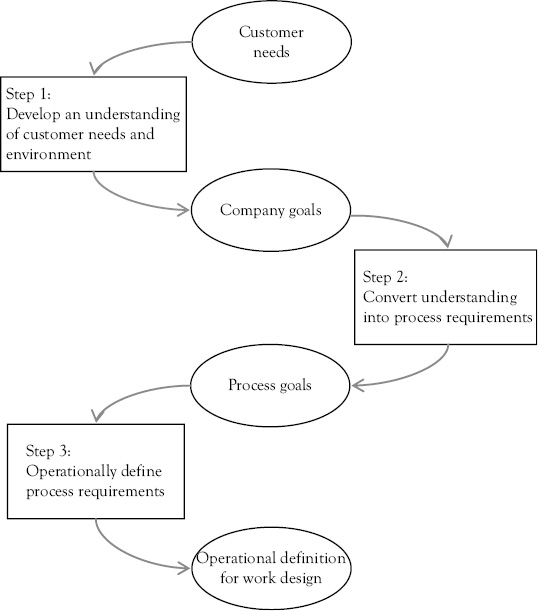
Figure 2.2 Translating what the customer wants into operational definitions for work design
Understanding What the Customer Wants—VOC
To understand the customer the company has to gather information that gives it the VOC. There are many tools to gather the VOC and to analyze the data about the VOC to be able to understand it.
The most basic tool to understand the VOC is to routinely interview customers. Interviewing customers allows individual customers to provide their own point of view about a product or service or a particular problem. It allows flexibility in probing interesting issues that are raised by the customer. To prepare for the interviews, the company must answer a series of questions first:
Decide on the purpose of the interviews.
Determine the method that will be used (face-to-face, phone, other).
Decide how many interviewers to use and interviewees to seek.
Determine what script to use.
Contact customers and arrange the interviews.
Conduct the interviews.
Analyze and interpret the data.
If the company is considering new product features or a new product, it is often valuable to go to where the product is used to conduct the interview. This will allow the gathering of visual or image data and give more clues about how the product is used.
There are diminishing returns to interviews, so it is important to segment the market. The segmentation could be by important characteristics of the user (e.g., age, gender, location) or by the type of user (e.g., end-user, purchaser) or if it is a new technology, users can be classified by their adoption pattern (early, lead, late).
What is gathered through the interviews is qualitative data. Its value is in its richness of context. To analyze it, some type of content analysis must be done. The affinity diagram (a.k.a. KJ diagram) is a useful group based tool to do this.
Example: (1) The manager of the Eis-Sahne Ice Cream Shop decided to interview customers for the purpose of finding out what would make them buy an ice-cream cone more often. (2) The manager decided that face-to-face interviews of shoppers and business people would be the most effective interview method. (3) The manager decided that the day of the week and the time of the day could affect customers’ responses, so the manager decided to interview four customers during the 2-hour lunch period (11 a.m. to 1 p.m.) each day and four customers during the afternoon break time (2 p.m. to 4 p.m.) each day and four customers during the early evening period (6 p.m. to 8 p.m.) each day. The manager thought that weekends could be significantly different from weekdays but that Monday to Thursday would be similar. So the manager prepared to interview on Wednesday, Friday, Saturday, and Sunday. This meant that a total of 48 interviews were planned. (4) A basic script was created in which a staff member walked through the mall handing out coupons with a two hour expiration time. These coupons were redeemable if the customer took it to the store and answer five questions. (5) Customers were contacted face-to-face to do this. (6) Interviews were planned to take less than 5 minutes each. (7) At the end of the week the data was analyzed.
Analyzing Interview Data
Interview data often only gives quotations and messy impressions. To ensure that the impressions are captured, a note taker, who is not the interviewer, records not only answers but also whatever images the interviewee provides. For example, during an interview the note taker may record: “Young mother with one boy under five who was constantly straying away. The mother kept the baby in a stroller and gently rocked it during interview.” Analysts can interpret the verbal data and the image data using an affinity diagram.
Once the ideas are gathered by interviews or other means, they are placed onto cards or slips of paper (e.g., post-it notes™) to allow for easy display and sorting. This is illustrated in Figure 2.3, with each unsorted statement being on a separate card or post-it note.
The second step is to sort the ideas without talking. The ideas must be written clearly and must include five to six words including a noun and a verb. The ideas are not discussed at this point, except to clarify what is meant and to ensure the thought is a complete sentence. It is important that criticism is not allowed at this stage, to ensure that all ideas are considered. A useful approach is to have all the cards displayed and have the team silently sort them into categories. Cards that keep going from category to category can be duplicated with one placed into each pile. The members are to create the groupings based on the relationships that they see. If some cards do not fit into any emergent groups, they can be left by themselves.
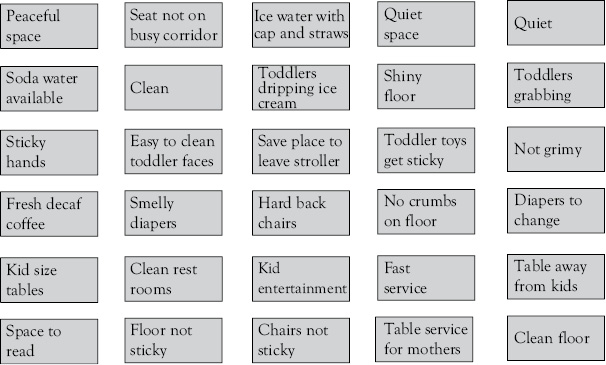
Figure 2.3 Creating an affinity diagram
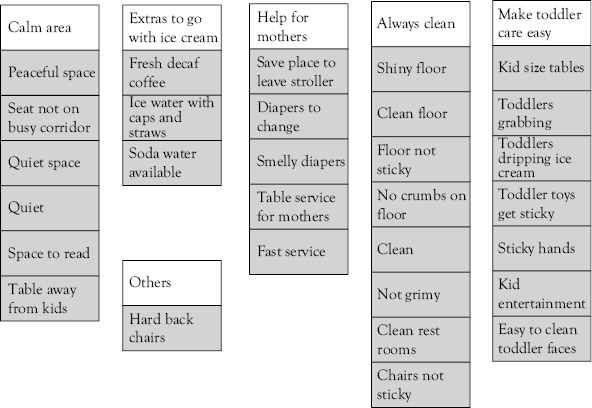
Figure 2.4 Affinity diagram with header cards
When all the cards have been sorted into categories, the group steps back and looks at each category by itself. The group then creates a “Header Card” for each group. This is a one sentence summary of what all the cards were saying. It should be concise but clearly convey the meaning of all the cards even if a new reader were not able to see the accompanying cards. An example is given in Figure 2.4.
These header cards (i.e., the white cards in Figure 2.4) become the input into the next step of analysis. This next step of analysis may be to create a survey, to be distributed to a wider audience of customers. Or the next step may be to identify the causal relationships between these items.
Validating Interview Data
It is often important to validate the findings of this smaller group of customers (i.e., those who were interviewed) by surveying a larger set of customers. One method of conducting the survey is to use the techniques developed by Kano, often called Kano analysis (Shiba and Walden 2001). Kano analysis is particularly appropriate for understanding the relative value of different features or attributes of a product or a service.
Kano analysis differs from traditional surveys that use a Likert-type “Agree—Disagree” scale. Kano analysis asks the question in both a positive way and a negative way, or stated differently, as questions about functional or dysfunctional attributes. For each question, the respondent selects from one to four choices, from the following response scales:
I like it.
This is what I expect.
I do not care for it.
I do not like it.
It is similar to other survey methods in the sense that each attribute has to have a question. It differs in that there are actually two questions about each attribute (functional and dysfunctional), and the response scale is not a Likert type scale.
Example: The manager of the Eis-Sahne Ice Cream Shop used the headers created as part of the affinity diagram to create questions for a Kano survey. Questions about two attributes (calmness and cleanliness) were developed.
Attribute 1—Cleanliness:
If the floors in an ice cream shop are very clean when you walk in, how do you feel?
If the floors in the ice cream shop are not very clean when you walk in, how do you feel?
Attribute 2—Calmness:
If it is relatively quiet when you walk into an ice cream shop, how do you feel?
If it is relatively loud when you walk into an ice cream shop, how do you feel?
The responses are analyzed using the 4 × 4 matrix given in Table 2.1. This matrix compares the functional and dysfunctional responses to each other to categorize the attribute being considered. A matrix is completed for each attribute being evaluated. The matrix may show that all customers have the same feeling about the attribute, or it may show that there are different sets of customers with different feelings regarding that attribute. In general there may be five different categories:
Satisfier (one dimensional): The customer liked the attribute and disliked the negative attribute. For example, the customer when asked “If the floors in an ice cream shop are very clean when you walk in, how do you feel?” answers “like” while when asked “If the floors in the ice cream shop are not very clean when you walk in, how do you feel?” answers “do not like.”
Delighter (attractive): The customer liked the attribute but feels indifferent in terms of the negative attribute. For example, the customer when asked “If the floors in an ice cream shop are very clean when you walk in, how do you feel?” answers “like” while when asked “If the floors in the ice cream shop are not very clean when you walk in, how do you feel?” answers “do not care.”
Indifferent: The customer feels indifferent in terms of the negative and positive attribute. For example, the customer when asked “If the floors in an ice cream shop are very clean when you walk in, how do you feel?” answers “do not care” giving the same answer to the negative question, “If the floors in the ice cream shop are not very clean when you walk in, how do you feel?”
Table 2.1 Kano analysis: Scoring respondents paired positive and negative answers
| Negative or dysfunctional questions | |||||
| Like | Expected | Do not care | Do not like | ||
| Positive or functional questions | Like | ??? | Delighter or Attractive | Delighter or Attractive | Satisfier One dimensional |
| Expected | Reverse | Indifferent | Indifferent | Dissatisfied | |
| Do not care | Reverse | Indifferent | Indifferent | Dissatisfied | |
| Do not like | Reverse | Reverse | Reverse | ??? | |
Reverse: The customer disliked the attribute but likes the negative attribute. For example, the customer when asked “If the floors in an ice cream shop are very clean when you walk in, how do you feel?” answers “do not care” while when asked “If the floors in the ice cream shop are not very clean when you walk in, how do you feel?” answers that he or she “like it” (maybe because it reminds them of their not so orderly room at home).
Dissatisfied: The customer answered either “expected” or “do not care” when asked “If the floors in an ice cream shop are very clean when you walk in, how do you feel?” and answered “do not like” when asked “If the floors in the ice cream shop are not very clean when you walk in, how do you feel?”
Table 2.2 is an example of scoring one pair of questions in 200 surveys. This shows two distinct groupings of responses. One set of customers scored the attribute as being a “Delighter or Attractive” attribute, while another set of customers scored the attribute as being a “Satisfier or One dimensional” attribute.
These views of the customers about particular attributes are placed onto the graph in Figure 2.5. Here CR1,1 is customer requirement 1 for customer group 1 and CR1,2 is the score for customer requirement 1 for group 2. This means that for one group of customers if the company can provide attribute CR1,1 that these customers will be delighted, even though the second group of customers will only be satisfied.
Table 2.2 Kano analysis: Numerical example
| Negative or dysfunctional questions | |||||
| Like | Expected | Do not care | Do not like | ||
| Positive or functional questions | Like | 5 | 107 Delighter or Attractive | 8 | 78 Satisfied or One |
| Expected | 1 | 0 | 0 | 1 | |
| Do not care | 0 | 0 | 0 | 0 | |
| Do not like | 0 | 0 | 0 | 0 | |
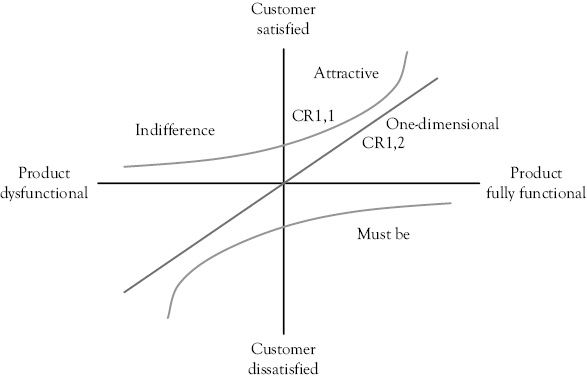
Figure 2.5 Identifying customer requirements dimensions
For customer group 2, then this attribute is an order qualifier. It is what the business must provide for them to consider it. For customer group 1, this attribute is an order winner, because it is an attribute which is likely to make the customer want to buy from the company (Hill 1999). For customer group 1, the requirement was placed onto the Attractive or Delighter curve because 115 of the 200 respondents responded to it as a Delighter. This means that these customers do not currently expect this in the product or service but they would find it very satisfying if it were there. This is a potential competitive advantage—or order winner—since we have identified a latent requirement of the customer that is not currently recognized by the market.
References
Drucker, P. 1973. Management: Tasks, Responsibilities, Practices New York: Harper & Row.
Ford, H. 2003. Today and Tomorrow: Commemorative Edition of Ford’s 1926 Classic Originally published by Doubleday, Page & Company. Reprinted Boca Raton, FL: Taylor & Francis Group, LLC, CRC Press.
Goldratt, E.M., and J. Cox. 1984. The Goal: A Process of Ongoing Improvement. Croton-on-Hudson, NY: North River Press.
Hayes, R.H., and G.P. Pisano. 1996. “Manufacturing Strategy: At the Intersection of Two Paradigm Shifts.” Production and Operations Management 5, no. 1, pp. 25–41.
Hill, T. 1999. Manufacturing Strategy: Text and Cases. 3rd ed. Chicago, IL: McGraw-Hill/Irwin.
Hino, S. 2006. Inside the Mind of Toyota: Management Principles for Enduring Growth New York, NY: Productivity Press.
Shiba, S., and D. Walden. 2001. Four Practical Revolutions in Management: Systems for Creating Unique Organizational Capability. 2nd ed. Portland, OR: Productivity Press.
Skinner, W. May–June 1969. “Manufacturing-Missing Link in Corporate Strategy.” Harvard Business Review 47, no. 3, pp. 136–145.