
Visual Signaling for Visual Control
To be able to control his own performance a manager needs to know more than what his goals are. He must be able to measure his performance and results against the goal. It should indeed be an invariable practice to supply managers with clear and common measurements in all key areas of business. These measurements need not be rigidly quantitative; nor need they be exact. But they have to be clear, simple and rational. They have to be relevant and direct attention and efforts where they should go. They have to be reliable …. And they have to be, so to speak, self-announcing, understandable without complicated interpretation or philosophical discussion.
There are some key points in the quotation from Peter Drucker above. The first is that performance control requires an ability to measure. The second is that good control requires that the measures be simple, rational, clearly stated, and common across multiple units. The third point is that the measures do not have to be rigidly quantitative, although they have to be reliable and relevant to the system they are used to control.
The objective of a control system is to stabilize the process by triggering action if the process deviates from a target. A control system is a “system that has as its primary function the collection and analysis of feedback from a given set of functions for the purpose of controlling the functions” (Cox and Blackstone 1998, p. 18). A common example of a control system is a thermostat. The temperature of the room is the parameter that is being measured and the target temperature is the temperature set by the home owner. The thermostat measures the room temperature and compares it to the target temperature. It is connected to the heating, ventilation, and air conditioning system (HVAC) for the room and it controls the temperature in the house by either turning on or turning off the HVAC equipment.
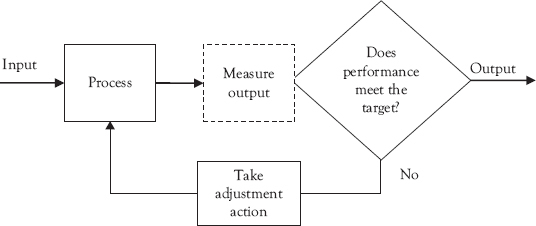
An illustration of a generalized control system is shown in Figure 5.1. The process produces something (in our thermostat example, this is heat) and this output is measured and a decision is made. If the output is within the desired range then nothing is done, otherwise the process is adjusted, which in the thermostat example means the HVAC is turned on or off. Measuring the output creates data, by comparing the actual measured value to the target, and creates information that can be used for action.
People and Control Systems
For information to be used effectively, the information has to be available for use at the right time at the right place, and it has to be understandable to the decision maker. In the initial quotation at the beginning of the chapter Drucker emphasized the need for the measurement system to be understood easily, which meant that it has to be both simple and relevant. By using this performance measurement system, a manager who wants to have a high performing system is able to direct their effort to achieve that goal. High performance here means achieving the targets that are set by upper management.
The control system that is used is an essential determinant of the performance of human organizations. Control system can be built into machines, but in human organizations much of the work is done by people and not machines. People can only be developed so they internalize a control system.
In the context of quality, William Glasser built on the work of W. Edwards Deming to say that the decision for a system manager was whether to use “boss-management” or “lead-management” (Glasser 1994). That is he divided control systems into two basic types. In this typology, lead managers use the concepts of control theory to lead their workers. The principles or concepts of the lead manager control system are that the manager must:
- … learn what quality actually is, teach it to all who work in the organization, and then listen carefully to any worker who has an idea of how it may be further improved.
- Manage everyone in the organization so that it is obvious to all workers that it is to their benefit to settle for nothing less than quality work. (Glasser 1994, p. 5)
Glasser argues that the most any manager can do is to show workers the path to producing high quality work and ensure that they know that the company’s success depends on their ability to do high quality work. Managers need to constantly encourage workers to improve their work and constantly seek out better ways to do their work. Once workers fully understand what “good quality” means for their own work they can become their own control systems and they can implement their own improvement system. As Glasser says:
… a basic tenet of control theory: You cannot make anyone do what he or she does not want to do. You can only teach him a better way and encourage him to try it. If it works, there is a good chance he will continue. (Glasser 1994, p. 50)
This means then that a lead manager recognizes that their workers need information. They need to then use this information to determine on their own how to do quality work. The lead manager controls by providing this essential information to the workers.
Since the control system is an important element in system effectiveness, managers need to clearly understand what they want from their system, so that they can ensure that their control system will effectively guide their efforts. For any system to be effective it must stay in control, but the “in control” state must also be one that is directing actions toward the system’s goal.
Lean Control Systems
One of the most important aspects of a Lean Work Design is visual control. Visual control signals give the worker information about the actual system performance “at a glance.” As we learned in the previous chapters, tools such as 5S and layout decisions make the workplace visual. These visual controls allow process performance to be easily compared to the system target or goal. The visual system signals when there is a need for action and where there is no need for an action.
One of the best known visual control signals is the use of andon lights (indicator panels) by Toyota to make delays and problems visible.
At Toyota, machines are equipped to detect production problems and shut down immediately when one occurs, indicating what type of problem it is on an indicator lamp. Also, workers are allowed to stop the production line when they notice a problem. When the line is stopped, an andon (indicator panel) lights up informing everyone in the area of the type of problem and where it has occurred.
The andon is a visual control that communicates important information and signals the need for immediate action by supervisors. (Shingo 1989, p. 74)
The andon light then is similar to the lead manager concept of Glasser (1994) discussed earlier. Using andon lights by themselves does not improve the system—the triggered informed action does. The andon light immediately informs everyone involved in the process that there is a problem. The andon light is information about the quality of the process at that point in time. It is then up to management to take adequate actions—for example, to help solve the problem in order to maintain production. It is also management’s responsibility to ensure that the root cause of the problem is eliminated so that the problem does not recur.
Root cause analysis for problem solving is addressed later in this book. The point of this chapter is to recognize that using andon lights or other indicators to signal problems as well as signaling the process accomplishments creates a visual control system. This visual control system in turn informs everyone in the process about the status of the process. It allows workers to become involved in ensuring the quality of their process.
A goal of a lean operating system is to have a system that fulfills customer needs without waste. To do this, the visual control system must clearly signal whether the system’s production is what the customer needs at each point in time, it is also signaling when the process is not doing that, or when the process contains waste.
Control Systems and Goals
Simply adopting goals, whether easy or personally challenging ones, without knowing how one is doing seems to have no appreciable motivational effects. (Bandura and Cervone 2000, p. 203)
As the above quotation points out, system goals are not enough to obtain performance. It is important that we are able to measure our performance compared to the goal. A visual control system makes it easy for us to see how we are doing compared to our goals. A visual control system measures and displays the actual process performance to the process target.
The use of visual control systems is supported by the management theory called “Goal Theory.” Visual controls set a visible goal for the process and the workers, which is measured against the performance toward that goal. The manager then uses the visual control system to manage the workers, by ensuring that the target is the correct standard of performance and by working with the employees to solve problems when the target is not being achieved. Goal theory suggests visualizing actual performance compared to the target or the goal improves performance because it energizes people. People are motivated by clear goals. Motivated people persist in their activities over time because the clear goals direct people’s attention to the relevant outcomes and away from non-goal related activities (e.g., Miner 2005).
To be an effective visual control, the target has to be easy to measure and meaningful. Well-designed visual control systems meet the SMART criteria for goals. These criteria are (Wikipedia 2013):
- S = Specific, which means that the goal is clear and not ambiguous.
- M = Measurable, which means it is a quantitative target.
- A = Attainable, which means the goals are the standard.
- R = Relevant, which means that it is in alignment with organizational goals.
- T = Time-bound, which means it sets a deadline.
Example: The manager of the Eis-Sahne Ice Cream Shop set a cycle time goal for taking an order. The time from the customer’s arrival at an order station to the completion of the process of taking order (i.e., the order is confirmed by giving a receipt for payment along with any change) is 120 seconds. This goal meets the SMART criteria. It is a Specific goal. It is Measurable, since it is time and the clerk serves only one customer at a time. The manager has conducted multiple time studies and established that it should be very Attainable without unduly rushing the customer. It is Relevant to Eis-Sahne, which strives to give customers’ fast service. It is Time-bound since it sets a deadline for completing the order. The manager made the goal visual by having customers pull a number when they enter. When a clerk finishes taking one order they push next on their computerized cash register, which then starts a clock and puts the next number up on a display board while the clerk says: “Now serving customer A10,” for example. When the order is recorded as complete in the cash register, the display board shows the completion time in white if it was on time and in gray if it took too long.
Visual controls are only effective if the manager ensures that meeting them means that all the work standards have been met. This means that management must have a basic understanding of the production process, including what is required to produce the output and what the process is capable of accomplishing. A lead manager does this first by learning about the system and then by engaging the workers in improving it.
When creating standard work, it will be difficult to establish a standard if you are trying to achieve “the best way.” This is a big mistake. Document exactly what you are doing now. …. Take that standard, and if the work is not easy to perform, give many suggestions and do kaizen. (Ohno 2013, p. 142)
Lean Approach to Creating a Control System
The initial target/goal for performance could be whatever the current actual performance has been. For repetitive work, one of the easiest measurement systems to establish is “Actual versus Expected.” The “actual” measurement shows the amount of work that was accomplished versus the amount of work that was expected for each time frame.
In a production environment, the workers can track the production over a certain period of time and visually display both the work accomplished during this time and the target amount of work to be accomplished during that time period. The workers also should record the reasons for any “misses” as they occur (i.e., a “miss” is a time period during which the amount of work accomplished is less than the target). This visual display provides an improvement path. If the workers meet their target in each time period, improvement efforts can take a different direction instead of investigating the “why?” when there was a target that was missed.
The actual versus expected chart is often color coded using red/ green, but since this book is published in black and white the gray color represents red and white represents green as shown in Table 5.1. This makes it easy for everyone to tell at a glance how well their process is doing. In the example below the target was to produce 15 parts every 30 minutes. If the target is not achieved, the reason for failing to achieve this target is recorded. Recording the reason for the miss is important, because it provides input for continuous improvement. It should help motivate the workers because they have the knowledge of the goal, they recognize that management sees it as attainable, and, as reasons for missing the goal are recorded, they can see a pathway to improvement to achieve the goal.
Table 5.1 Actual versus Expected chart
Time period |
Target production |
Actual production |
Reason for miss |
8:00−8:30 |
15 |
15 |
|
8:30−9:00 |
15 |
10 |
Defect required rework |
9:00−9:30 |
15 |
15 |
|
9:30−10:00 |
15 |
15 |
|
Table 5.2 Actual versus Expected chart Eis-Sahne Ice Cream Shop
Customer |
Start |
Target |
Finish |
Reason for miss |
A109 |
1:11 |
1:13 |
1:13 |
|
A110 |
1:13 |
1:15 |
1:15 |
|
A111 |
1:15 |
1:17 |
1:16 |
|
A112 |
1:16 |
1:18 |
1:19 |
Customer changed their mind and reordered |
In the Eis-Sahne Ice Cream Shop example, the manager could use an Actual versus Expected chart to display the time it takes to serve a customer on a visual display board as shown in Table 5.2. The “Start” time and “Target” time are clearly shown, so there is a clear, explicit goal for performance. In this case the worker would record their finish times and when the worker did not meet their target of serving a customer within 2 minutes they would then record the reason why they missed the target. In the example above, only customer A112 took longer than 2 minutes. The worker then recorded the finish time, colored the cells gray and recorded the reason for the miss, which was that the customer changed their mind.
Visual Control Systems for Complex Work
Visual controls can be more difficult to establish when the work being performed has a large amount of variance in it or the outcomes are more difficult to clearly define. For example, if your calculus homework consists of five problems, you might know from experience that the assignment will take you 2 hours or 24 minutes a problem on average. But you know from prior assignments that this professor has given that the first two problems are often easy and can be done in 10 minutes each, while the next two take about 25 minutes and the last one always seems to take forever. You could set up an Actual versus Expected chart such as the one in Table 5.3.
This chart shows the amount of time that an individual activity is expected to take. It allows you, the student, to enter different expected times for each task. It then compares what is actually accomplished to what is expected. By recording the misses just as in the previous “Actual versus Expected” chart, the student is able to gather information that may be useful in improving performance. Again, it is important to remember that this is only providing a visible signal that a process is or is not in control; it does not examine why the process is or is not in control or even whether the control targets (i.e., the Expected) are reasonable targets.
It is easy to see how Table 5.3 could be expanded to be useful for other nonrepetitive tasks where the processing times are expected to vary. Companies may have them recorded as job charts. For example, an auto service repair center may estimate repair times using the published standards and measure performance against these targets as shown in Table 5.4. Here the mechanic records what prevented them from accomplishing the goal.
Table 5.3 Actual versus Expected chart for homework
Problem |
Expected |
Actual |
Overage |
Reason for miss |
1 |
10 |
9 |
|
|
2 |
10 |
9 |
|
|
3 |
25 |
24 |
|
|
4 |
25 |
35 |
10 |
Did not understand concept and reread chapter |
5 |
50 |
89 |
39 |
Problem different from example done in class |
Table 5.4 Actual versus Expected chart for auto repairs
Job |
Expected |
Actual |
Overage |
Reason for miss |
AA |
60 |
45 |
|
|
BB |
90 |
80 |
|
|
CC |
75 |
90 |
15 |
Air gun stripped bolt, had to rethread |
DD |
120 |
100 |
|
|
In Tables 5.3 and 5.4 tasks had clearly defined outcomes. The ability to use this Actual versus Expected visual control system requires outcomes to be clearly defined. For more complex tasks, it is the managers’ responsibility to work with the employees to develop these clearly defined outcomes. A very complex service in which the outcomes are not clearly defined is health care.
One goal of a medical or surgery unit in a hospital might be to provide nursing care until the patient can be discharged in a stable condition. However, since patients who are admitted will be in acute if not critical condition, it is likely that some will be there for extensive time periods before they are discharged. This makes it difficult to track the process as a job, because there are many tasks within this job of caring for a single patient from admittance to the unit through discharge from the unit. This means that the visual control system will have to focus on measuring important care tasks that are provided during the patient’s stay in the unit.
The nursing manager and nurses may compile a list of tasks that have to be performed from the standards of care for a particular problem and from the nursing standards used in the hospital. So there will then be multiple Actual versus Expected charts in use. One possible chart would be to track whether the nurse is making rounds as expected. This is illustrated in Table 5.5.
The chart in Table 5.5 allows the start and end times to vary between patients, because the patients may have different comorbidities (e.g., one may have diabetes as well as heart problems). It also records reasons about why the nurse started behind schedule or ended behind schedule and the efforts that were made to get back on schedule. This can be important, because unconscious patients may develop bed sores if the nurse is not timely in visits and in the care they provide during their visits and the conscious patients may attempt to leave the bed to relieve themselves if the nurse is late (these patients could risk e.g., a fall because they may not be stable).
Table 5.5 Actual versus Expected chart for nursing rounds
Patient |
Expected arrival |
Actual arrival |
Expected end |
Actual end |
Reason for miss |
Mxxx |
8:00 |
8:00 |
8:20 |
8:20 |
|
Nyyy |
8:30 |
8:25 |
9:15 |
9:15 |
|
Ozzz |
9:25 |
9:35 |
10:00 |
10:15 |
Physician requested update in hall |
Paaa |
10:10 |
10:20 |
10:35 |
10:35 |
Received help from nurse manager |
Summary
Effective control systems require clear, reliable measures of the system performance. These measures should be visible so the right information is at the right time at the right place. Measures do not have to be highly quantitative, but they do have to be reliable and repeatable. As the system outcomes become more complex the performance measures have to be about the performance of subtasks. To ensure that these subtasks are reliable indicators of the system outcomes, it is important to engage the employees in identifying and developing measures of these subtasks.
References
Bandura, A., and D. Cervone. 2000. “Self-Evaluative and Self-Efficacy Mechanisms Governing the Motivational Effects of Goal Systems.” In Motivational Science: Social and Personality Perspectives, eds. E. Tory Higgins and A.W. Kruglanski. Philadelphia, PA: Psychology Press, Taylor & Francis Group.
Cox, J.F., and J.H. Blackstone. 1998. APICS Dictionary. 9th ed. Falls Church, VA: APICS—The Educational Society for Resource Management.
Drucker, P.F. 1954. The Practice of Management. New York: Harper.
Glasser, W. 1994. The Control Theory Manager. New York: Harper Business.
Miner, J.B. 2005. Organizational Behavior 1: Essential Theories of Motivation and Leadership. Armonk, NY: M.E. Sharpe.
Ohno, T. 2013. TaiichiOhno’s Workplace Management, Special 100th Birthday Edition. Original Japanese edition, OhnoTaiichi No GenbaKeiei, 1982.
Shingo, S. 1989. A Study of the Toyota Production System from an Industrial Engineering Viewpoint. Cambridge, MA: Productivity Press.
Wikipedia. 2013. “SMART Criteria.” Last modified May 13, 2013. Wikipedia.org/wiki/SMART_criteria (accessed May 26, 2013).