
Each of the code analysis tools we have seen in the previous sections identify specific issues in the code. While Checkstyle looks for violations in coding guidelines, PMD identifies common coding errors, and FindBugs detects bug patterns.
You could have your project configured to run all the three. In addition, you could also run plugins to identify coverage. You could also do all these and more by doing a SonarQube analysis of the project.
SonarQube is a platform to manage code quality. It is a web-based application, where rules, alerts, thresholds, and other metrics can be configured. It provides various ways to analyze code. The results of the analysis can then be viewed in a web application. SonarQube also provides several paid plugins, such as SQALE, and for specific languages, such as Cobol and C++.
Let's briefly discuss some basic requirements for using the Maven SonarQube plugin:
- Visit the download page for SonarQube at http://www.sonarqube.org/downloads/.
- Download the latest release.
- Unzip the ZIP file to a folder of your choice.
- Based on the platform, start the server by following the instructions.
- Confirm that the server is running by visiting the web page at
http://localhost:9000/(assuming it's a default installation).
Use the following steps to analyze the code with the Maven SonarQube plugin:
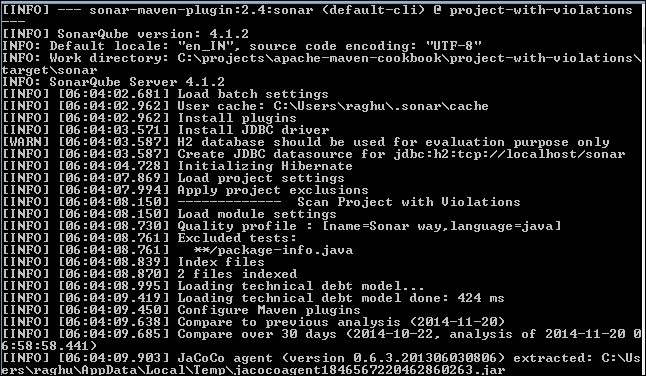
The sonar goal of the Maven SonarQube plugin sets in motion a series of steps to do various analyses of the project. Based on the configuration, the Sonar plugin performs Checkstyle analysis, FindBugs analysis and PMD analysis, as well as detects code coverage, code duplication, design issues and code complexity.
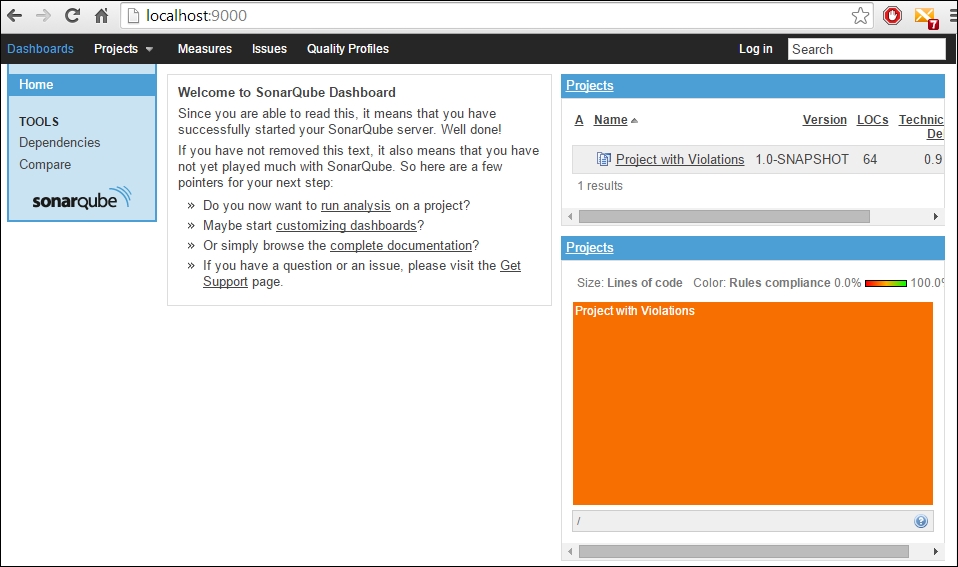
It sends the output to a database and generates reports that can be viewed from the web page by the user.
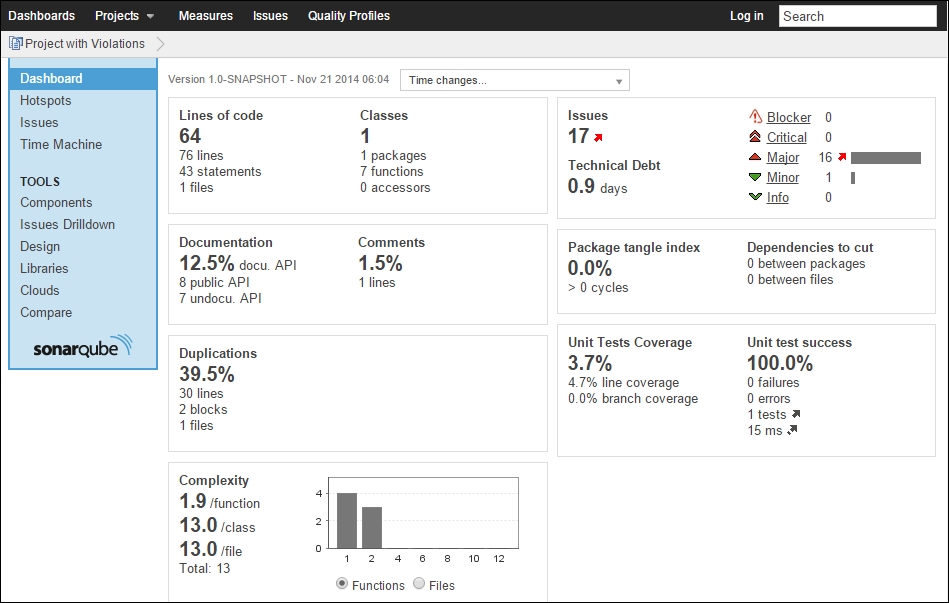
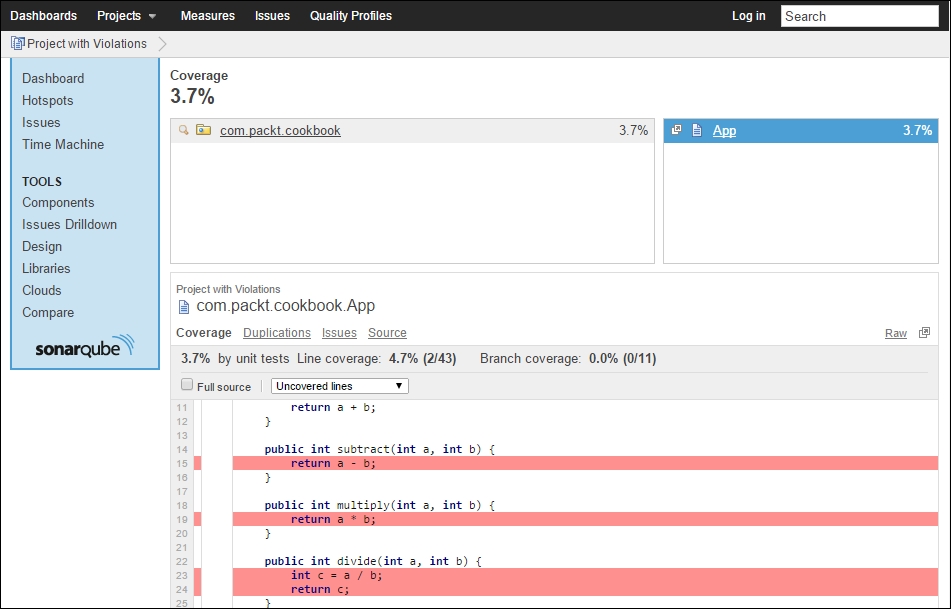
As you can see from the dashboard, it has generated the unit test report along with coverage information. Clicking on the link will take the user to details of the coverage.
Similarly, clicking on Issues gives details of the various violations:
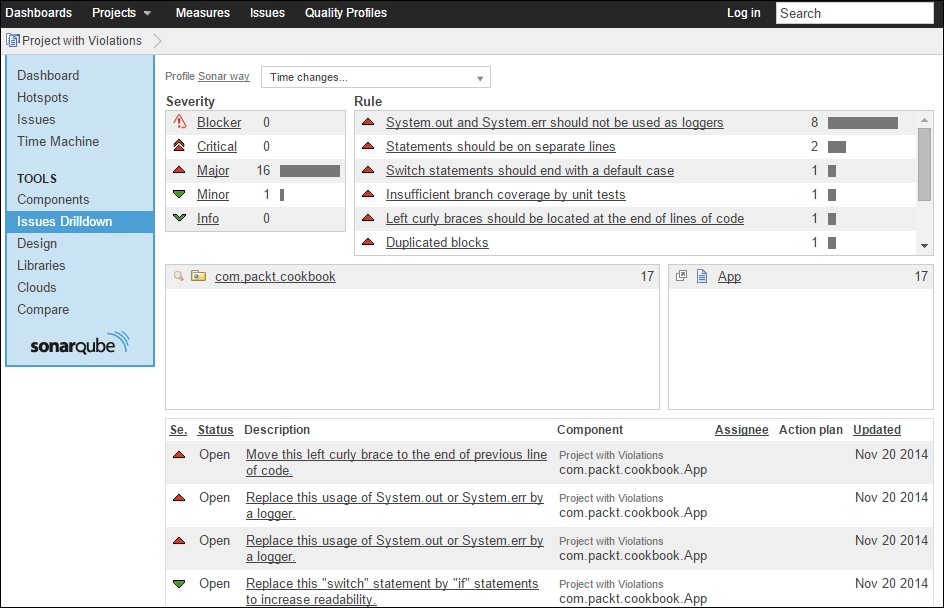
Each of these issues can be drilled down to the line-level details, and Sonar provides the details, including fix suggestions.
SonarQube provides several configuration options to specify rules to be included/excluded, source files to be included/excluded, and so on. The configuration can be done through the web interface, and in some cases, by means of properties, either in the Maven's settings file or through the command line.
In addition, SonarQube provides plugins for Eclipse and IntelliJ. Once installed and configured, these plugins report violations directly in the IDE in the specific lines. As this is not specific to Maven, its details are outside the scope of this section.