
Lesson 25. Resolving Network System Issues
|
Time |
This lesson takes approximately 1 hour to complete. |
|
Goals |
Understand which aspects of the system processes to monitor on a regular basis Monitor and troubleshoot the system with Mac OS X applications and command-line applications Use cron to automate log monitoring Use startup scripts to monitor systems Build a startup script |
In an enterprise environment, network reliability and maintenance determine how effectively your end users can work without network downtime. Your skill at monitoring and troubleshooting network issues will serve as a primary factor in sustaining the overall health of your enterprise computing environment. In other words, you troubleshoot situations as they arise, and monitor your network to catch them before they spiral out of control.
In this lesson, you’ll learn to use a particular methodology and set of tools to troubleshoot Mac OS X–related issues. In addition, you’ll learn to use Mac OS X utilities and command-line tools to monitor network activity. While this lesson focuses on monitoring and troubleshooting network issues, many of the concepts also apply to other issues, such as local file services, printing, and directory services.
Troubleshooting a Network
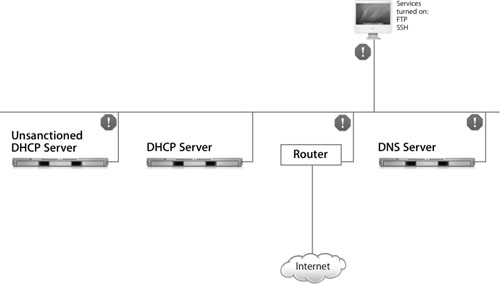
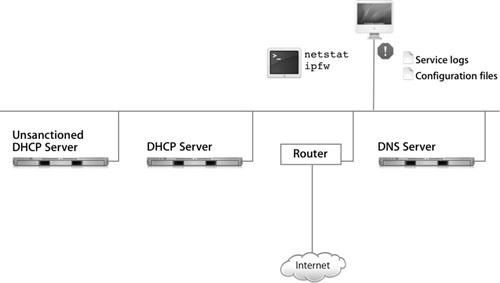
The following figure shows a network that has several problems: Computers on the network can’t access the Internet; the domain name system (DNS) server is down; some computers can’t see the other computers on the network because they are getting their Internet Protocol (IP) addresses and DNS information from an unsanctioned Dynamic Host Configuration Protocol (DHCP) server; and a Mac OS X computer (in this case, the iMac) has some services like File Transfer Protocol (FTP) and remote login turned on. In this lesson, you’ll learn how to troubleshoot these issues.
Establishing a Methodology
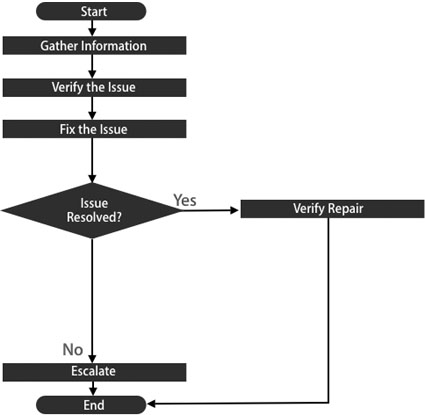
The following flowchart, which provides a framework for the network troubleshooting process, is a condensed version of the Apple General Troubleshooting Flowchart.
Gather Information
The first step in this process is to gather information about the issue. You’re trying to establish its exact nature by getting as much information as possible. For example, you may find that the symptom the end user is reporting has stopped the user but has nothing to do with the underlying issue. Initial reports may be misleading. “I can’t connect to the Internet” is meaningless until you have more information.
To ensure that you have the best possible understanding of the report, ask a mix of openended and yes/no questions. Keep in mind that your end user may not have an understanding of networking in general and almost certainly does not know your network architecture. The following questions are useful:
• Did things work at one point but suddenly stop working, or is this the first time you’ve tried to do this?
• Do you know if anything changed recently on your system or in your settings? What is that?
• Have you installed all current updates from Software Update (particularly any security updates)?
• When did the issue first appear?
• Is anyone else in the area having a similar issue?
• Is the issue constant or intermittent?
• Does it occur in only one application?
• Does it persist if you restart?
You should resist jumping to conclusions or making suggestions based only on the answer to one or two questions. While these suggestions might keep your users at bay for a short time or even temporarily cure the symptom, you still have not identified the cause.
When you are gathering information, don’t hesitate to request logs or System Profiler reports. You can also log in to the remote computer to view relevant log entries or run System Profiler remotely.
Verify the Issue
The next step is to verify the issue. Ask yourself if you recognize the issue, log in to the remote computer, and try to reproduce it there. Walk your end user through the process and see if you can identify where the issue recurs. Use Apple Knowledge Base documents at www.apple.com/support as a reference.
When you have completed the information-gathering and verification steps, you should have enough information to try a fix. Evaluate the nature of the issue: Is it local to this machine, specific to the network, or specific to a particular server?
Note
Fixing the issue may involve network configuration on servers that you do not control, so you’ll want to discuss the issue with other system administrators in your organization.
When you are ready to try a fix, start by isolating as much as possible. Eliminate possible sources. Narrow your scope from general topics (“the network is slow”) to specifics (“the network is slow when browsing specific websites using specific machines”). Often the answer will reveal itself without your having to make major changes to the network. In any case, before making any changes, consult with your network architect or a senior system administrator to double-check your reasoning.
Fix the Issue
Once you have established and verified the issue and have a solution in mind, apply the appropriate fix. Evaluate the fix to see whether it resolves the issue, and pay special attention to ensure that you have not introduced network instability or new issues for other end users. Give yourself a time frame for evaluating the results: In most cases, if the issue goes away for more than 24 hours, it is resolved.
Finally, if you reach the point where you have evaluated several solutions and none of your fixes have worked, reevaluate your reasoning. If you can’t find a flaw in your approach, or you don’t find a fresh approach, escalate the issue to a senior system administrator or your network architect.
Troubleshooting Network Access
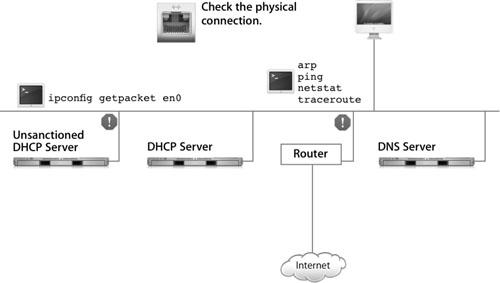
When a computer cannot access other computers on the network, first check the physical connection. Many network problems stem from loose or incorrectly wired cables. To thoroughly check the physical connection between two machines, you may need to check a series of switches for activation lights.
If the physical connection is active and you are working in a DHCP network environment, see whether the computer received a valid IP address and subnet mask from the DHCP server. Also check whether the computer can use Bonjour connections to servers.
You can also use several command-line tools to troubleshoot connectivity, as illustrated in the following figure.
Here are detailed descriptions of the command-line tools you can use to troubleshoot connectivity:
• ping: Use this command to send packets to hosts on the network and receive an answer in response. If you ping a host and don’t receive packets back, ping another host that you know is up and running to determine whether the issue is limited to the host in question. When using ping, remember that firewalls might not allow the traffic that is generated by the ping command. If you suspect a firewall is causing a computer not to answer, use telnet or another command that may penetrate firewalls.
• traceroute: Use this command to determine whether you have a routing problem. You trace the route to a particular host to determine at what point the route stops functioning. In addition, use this command to determine whether you have a deadlock that causes packets to go back to the original host. Using this command, you can also determine whether there is congestion on the network by looking at how long it takes packets to get through.
• arp: Use this command to show what hosts in the local subnet are known and verify that there are no duplicate entries. The arp –a command displays a table that lists the addresses of the computers on your local subnet and their corresponding MAC addresses. If the arp output lists the other systems on your network, it means that your network card is functioning properly but you might have a routing problem.
• netstat –nr: Use this command to display the routing table. You want to make sure that the default destination defined in your routing table points to a gateway and that the gateway is accessible.
In the following example, the default destination points to the 192.168.1.1 gateway:
>netstat –nr
Routing tables
Internet:
Destination Gateway Flags Refs Use Netif Expire
default 192.168.1.1 UGSc 9 3 en0
• scutil and ipconfig: Use these commands to show the state of your network configuration. You can also examine NetworkInterfaces.xml to look for any discrepancies. If you suspect that the source of the issue is an unsanctioned DHCP server, you can use the ipconfig –getpacket interface command (where interface is your network interface, such as en0) to display the last packet received from the DHCP server on your computer.
Note
Some sites do not allow Internet Control Message Protocol (ICMP) traffic. This can hamper the troubleshooting effectiveness of ping and traceroute on those networks.
Troubleshooting DNS and Domain Names
If you determine that you have no problems accessing other computers on the network, but you cannot connect to hosts using their domain names, it is likely that the error lies with the domain name lookup process. The following figure illustrates that the problem likely lies with the DNS server.
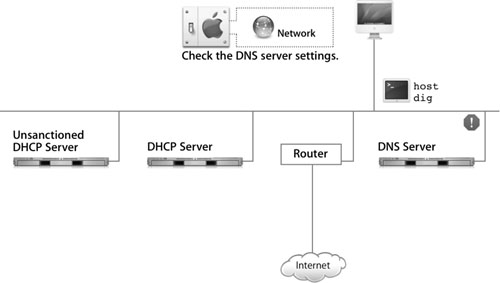
Make sure that the DNS server is properly set on the Network pane of System Preferences. Then use the following commands to figure out the issue:
• host: Use this command to perform a domain name lookup. If the command fails, it means either that the host you’re trying to connect to doesn’t have a valid DNS entry in the DNS zone files maintained by the DNS server, or that the DNS server is down. You can use the –a or –v option to get the entire DNS record.
• dig: This command performs a domain name lookup like host. In addition, this command displays the responses returned by the queried DNS servers. Analyzing the responses helps you determine whether the issue is the result of an error in the domain name’s DNS entry or a missing entry for the domain.
• nslookup: This command is deprecated. Use host or dig instead.
Another useful tool to resolve names is lookupd –d (used with options hostWithname: or hostWithInternet Address:). Lesson 11, “Planning and Deploying Directory Services,” covers lookupd in more detail.
Note
You can also use the Lookup pane of the Network Utility tool to perform domain name lookups.
Troubleshooting Network Services
If you are running services on your computer, and other computers are having difficulty reaching your machine, as shown in the following figure, you should ensure that the services are configured properly. Check the configuration files for each process; in this case, you would first examine the /System/Library/LaunchDaemons directory. Try to connect to these services locally from your own machine, such as ssh yourusername@127.0.0.1. If the service does not allow you to connect, then there is an issue with the service running locally on your computer.
You can also use tools such as netstat, which allow you to see network statistics as well as the different sockets and ports that you have open on your machine. For example, the netstat –an command displays the state of the ports that are currently being used.
In the output, entries can contain one of the following keywords:
• LISTEN: Indicates that the port on your computer is listening for requests.
• ESTABLISHED: Indicates an established connection and shows the address of the connected system.
• CLOSED: Indicates that the port is closed and might explain why other systems can’t access a particular service on your computer.
• CLOSE–WAIT: Indicates that a port is closed and is waiting for a defined period of time before returning to a LISTEN state (may indicate a Denial of Service attack).
When looking at the output of the netstat –an command, check for patterns that might indicate an issue. For example, if you notice that port 22 is being used by an unknown system when you know that only systems with certain IP addresses should be using the port, it is a sign of intrusion into your system. Also, if you notice that port 139 is closed when it’s supposed to be open, it’ll explain why Windows machines can’t access your computer.
One way to quickly check the status of ports is to use the following command:
netstat –an | grep LISTEN
Another command to use to list processes listening for Internet connections is the following:
sudo lsof –i | grep LISTEN
This command lists all open Internet files. Each entry lists the process that has opened the file and the port on which it’s listening.
Another thing to check when troubleshooting access to services is the firewall. Make sure that the firewall is not preventing other machines from connecting to you. You can use sudo ipfw list to see firewall rules or use the Firewall pane of System Preferences’ Sharing preference pane.
Use grep to filter output to show rules based on whether they allow access or deny it:
sudo ipfw list | grep allow
sudo ipfw list | grep deny
You should also check service-specific log files and run any service in question in the foreground or in debug mode. Most log files are found in either /var/log/ or /Library/Logs/.
Monitoring a Network
As system administrator, you must monitor the use of the machines you administer to make sure that their performance is acceptable and detect issues early on.
To monitor network activity, you can use the tcpdump command, which returns information contained in packets sent and received by network interfaces on your computer, as illustrated in the following figure. In other words, tcpdump lets you monitor the network traffic going in and out of your computer.
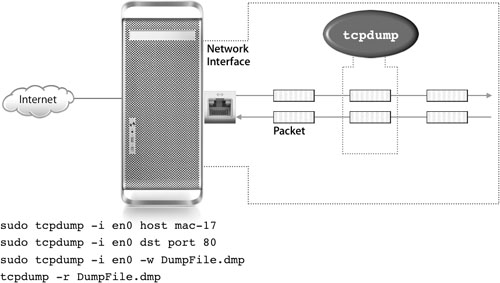
To run tcpdump, Mac OS X requires that you run the command as root using sudo. This requirement prevents unauthorized users from running tcpdump on your computer. Remember, packets can contain sensitive information, such as passwords and confidential information contained in email.
To use tcpdump effectively, you should determine what you’re looking for to avoid having to sift through tons of irrelevant packets. To that end, tcpdump provides many options and allows you to use Boolean expressions. For example, to print all packets arriving at or departing from mac–17.pretendco.com, use the following command:
sudo tcpdump –i en0 host mac–17
Monitoring network traffic using tcpdump is useful in cases of Denial of Service attacks. For instance, you can use the following command to monitor all incoming traffic destined to port 80 on your computer:
sudo tcpdump –i en0 dst port 80
If you detect an unusual number of requests coming from the same source, you can use the firewall rules on your computer to block all traffic coming from that source.
Note
You can create a script that takes output from tcpdump and analyzes it to detect attack patterns and alert the system administrator.
tcpdump is also useful when trying to determine whether packets are sent to the correct IP address and port.
When you run tcpdump, it will keep running until you stop it by pressing Control-C, using the kill command, or closing the Terminal window. If you stop tcpdump and close the Terminal window, you lose the packets that were captured. To store the packets in a file, use the –w option when running the command. For example:
sudo tcpdump –i en0 –w bonjour.dmp dst port 5297 or 5298
After you capture traffic, use the –r option to read the packets from the file:
sudo tcpdump –r bonjour.dmp
More Info
For more information about tcpdump, refer to its man page.
Using Ethereal
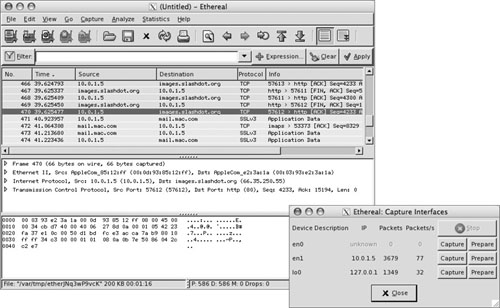
Ethereal is an open-source packet-sniffing tool that runs on an X Window system. This tool has a graphical user interface that lets you monitor packets in a user-friendly manner and offers features such as the ability to trace a set of related packets. In addition, it provides an easy way for creating filters (Boolean expressions) that you can use to display packets of interest.
To use Ethereal, you have to first install X11 for Mac OS X on your computer using the third Mac OS X installation DVD or the X11 package, which you can download from the Apple support website, www.apple.com/support. Once you have installed X11, locate, download, and install Ethereal from www.ethereal.com/download.html.
In addition to displaying packets, Ethereal has powerful analytical tools that display protocol hierarchy and capture options/output statistics, as shown in the following figures.
Monitoring Remotely
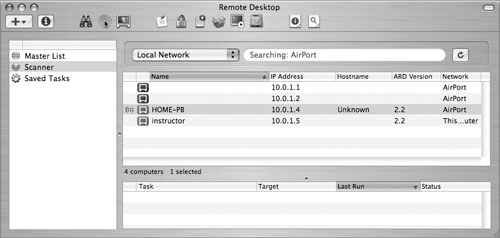
There will be times when you’ll need to do remote monitoring. When a computer is physically remote (such as in a data center or another building) or simply inaccessible for some reason (they must be network accessible, of course), you will rely upon remote monitoring tools. Two of those tools are ssh, for remote login from the command line, and Apple Remote Desktop (ARD), for remote management through a Mac OS X application.
ARD has three features that are useful for remote monitoring. As shown in the following figure, it allows you to observe and control the remote computer to run monitoring tools, it can pass commands from the administration software to selected machines, and it can check network performance to get a more qualitative report from a remote computer. One issue with ARD is that it currently doesn’t provide secure encrypted communications between computers, so it will be most useful within a corporate firewall.
ssh, on the other hand, is a command-line tool that provides secure encrypted login, making it suitable for connections to computers located anywhere. Using ssh, you can run any command-line tool or script on any computer to which you have administration access, including useful tools such as system_profiler, tcpdump, and netstat.
Remote access to a Mac OS X computer using ARD and ssh is disabled by default. To enable remote access using these two methods, you must enable ARD and Remote Login in the Services pane of System Preferences’ Sharing pane.
To start ARD via ssh, use the kickstart command. The following example shows how to activate ARD access for the user david and restart the processes:
$ sudo /System/Library/CoreServices/RemoteManagement/ARDAgent.app/Contents/Resources/
kickstart -activate -configure -access -on -users david -privs -all -restart -agent -menu
Monitoring With Log Files
Log files are an excellent source of information for troubleshooting and monitoring system and network activity. Log files might contain:
• More detailed information than what you see in error messages
• Informative messages that are not displayed anywhere else
• Progress messages
• Messages useful to a developer or technician assisting you with an issue
Commands and Tools
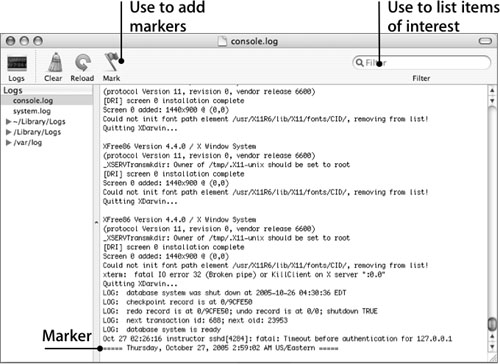
To monitor log activity, use Console, which provides a powerful search feature and allows you to add markers (log entries containing a timestamp) to separate log entries and make it easier to browse the log. You can also view logs using a text editor, however as shown in the following figure, Console makes it easy to view multiple log files while they are still being written to.
In addition to Console, you can use the tail –f command, which displays the contents of a log file. The command keeps running while it waits for additional entries, which the command displays as they are added to the log file. To stop the execution of tail –f, press Control-C or close the Terminal window in which the command is running.
When troubleshooting, you can use Console to log the sequence of events as you re-create the issue. The resulting log file can be useful in determining the cause of the issue.
To log a sequence of events:
1 Open the Console application, located in Applications/Utilities.
2 Click Logs in the toolbar.
3 Click the disclosure triangle next to a log to see more available logs.
4 Select the appropriate log and click Clear.
5 Perform the actions that produced the issue you are troubleshooting.
6 Read the messages that appear in the Console window.
Note
If you don’t understand the messages recorded in the log, you can still save the log file for a developer or technician helping you troubleshoot the issue.
When monitoring an activity, it’s essential that you keep an eye on logs related to the activity. For example, if you’ve enabled FTP access to your computer and want to keep potential attackers from using it as a network storage device for illegal material, monitor the /var/ log/ftp.log file regularly. You might detect that a host is continuously trying to access your computer at very short intervals (for example, every minute). In such a case, you would use the information in the FTP log to determine the source of the request and block it.
The following is a list of logs that you might want to monitor:
• /Library/Logs/console.log and /var/log/system.log: Use to monitor general system activity.
• /Library/Logs/Software Update.log: Use to determine whether important software updates have been performed.
• /var/log/daily.out: Use to get a daily synopsis of the state of a computer.
• /var/log/ftp.log: Use to monitor FTP activity.
• /var/log/httpd/access_log: Use to monitor personal Web sharing access activity.
• /var/log/httpd/error_log: Use to monitor failed Web sharing access attempts.
• /var/log/install.log: Use to monitor software installation activity.
• /var/log/ipfw.log: Use to monitor firewall activity.
• /var/log/mail.log: Use to monitor email activity.
• /Library/logs/panic.log: Use to monitor kernel panics.
The /etc/syslog.conf has information for the location of different log files.
Automation
One way to automate the process of log monitoring is to schedule commands or scripts that monitor log files to be executed automatically when a certain condition is met.
To automate the process of log monitoring:
1 Determine what you’re looking for in a particular log file.
In almost all cases, you’ll be looking for string patterns in log entries. For example, you might want to be notified every time the string “failed” appears in a log entry. The built-in command to use for finding patterns is grep. When searching a log file, grep returns the log entries that match the search criteria.
2 Determine the actions that must be performed when a certain condition is met.
For example, you might want an email sent to you every time the string “failed” appears in a log entry. You also might want to be emailed whenever a Denial of Service attack is detected.
3 Define the commands or scripts to run.
For example, if you want to be emailed whenever the string “failed” appears in an entry in system.log, use the following commands:
grep –i "failed" /var/log/system.log | mail –s "failed" [email protected]
Here, the grep command finds the entries or lines in the log file that contain the string “failed login attempt.” Then the output from the grep command is redirected as input to the mail command, which you use to send an email via postfix, the built-in program that Mail uses to send and receive email.
4 Schedule the running of commands or scripts.
The following is an example of a useful command combination to monitor the system profile to detect whether hardware components such as memory have been removed:
system_profiler SPHardwareDataType | grep –i memory Memory: 256 MB
This command combination searches the output generated by system_profiler SPHardwareDataType, which returns only core hardware data, for the word memory, and displays the results. Using a data type with system_profiler, such as SPHardwareDataType, is more efficient because system_profiler fetches only the relevant data instead of all system data, which can take a long time. To get a list of all available data types, enter the following:
system_profiler –listDataTypes
Using Other Third-Party Tools
In addition to the built-in tools mentioned earlier such as tcpdump, Ethereal, tethereal, and Console, you can use a host of third-party tools to monitor network and log activity. These include:
• Little Snitch: This customizable tool notifies you when an application is attempting to connect to the network and/or the Internet. For more information, go to www.obdev.at/products/littlesnitch.
• MacSniffer: This packet-sniffing tool acts as a front end or graphical user interface for tcpdump. MacSniffer displays the information in an easy-to-read form and lets you filter through packets using a library of filters that you can customize. For more information about MacSniffer, go to http://personalpages.tds.net/~brian_hill/macsniffer.html.
Adding Monitoring to Startup Items
System startup items are folders containing scripts or other programs that prepare a Mac OS X computer for normal operation. While launchd has taken over much of the role of starting most services, startup items still have a place in Mac OS X. Some of the system startup items provided by Apple are located in /System/Library/StartupItems. You should not modify the items in this folder, however, you can define your own custom startup items and store them in /Library/StartupItems.
You can add specialized behavior to the booting sequence using startup items. To create a startup item, make a subdirectory named to describe the behavior you are providing, create a shell script or program that has the same name as the subdirectory, and create a file containing a property list and having the name StartupParameters.plist, as illustrated in the following figure.
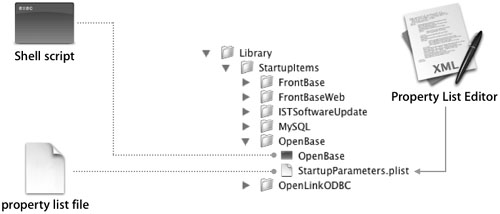
The StartupParameters.plist file must contain a set of key-value pairs that defines the startup item’s provided services and its dependency relationships to other services. The name of the startup item (the folder and executable name) does not necessarily have to be the same as that of a provided service. For example, the script Apache in the folder Apache provides the service HTTP.
When SystemStarter processes a startup item, it looks for an executable file with the name of the containing folder and runs that file with the argument start during system startup. Currently, the start argument is always supplied, because startup items are executed only at system startup. Apple reserves the right to modify SystemStarter to invoke startup items at other times with other arguments. For example, startup items could be executed at system shutdown with an argument of stop.
If you have installed the Developer Tools package, you can use the Property List Editor application in /Developer/Applications/Utilities/ to create an XML-style property list for StartupParameters.plist.
Incorporating Login Hooks
The preferred way to set a login or logout hook is through use of the defaults command with the key LoginHook or LogoutHook and the path of a script as the value. For example:
sudo defaults write com.apple.loginwindow LoginHook /User/david/myscript
Alternatively, you can change the line in the /etc/ttys file that tells the system to launch loginwindow on the Console Terminal.
You can modify that line to add the following options to loginwindow:
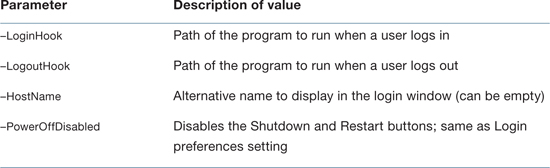
Here is an example of a loginwindow line from the ttys file that uses the –LoginHook option to invoke a program whenever a user logs in:
console "/System/Library/CoreServices/loginwindow.app/Contents/MacOS/loginwindow –LoginHook
/Users/David/Scripts/mailLoginToAdmin" vt100 on secure onoption="/usr/libexec/getty std.9600"
What You’ve Learned
• The Apple General Troubleshooting Flowchart is an example of a well-defined troubleshooting methodology to use whenever you diagnose issues.
• Pick the tools that are most appropriate for the issue you are troubleshooting, whether they are network tools, system tools, or file-system tools.
• Early detection of suspicious activity or issues can eliminate or reduce the damage that might be incurred if things go undetected.
• Scripts are powerful tools you can use to automate functions you want performed on a regular basis, as well as to monitor your computer. Scripts are an integral part of any system administrator’s repertoire.
• Mac OS X allows you to customize startup using startup items, which are scripts invoked at system startup, and through login hooks, which are scripts invoked when a user logs in from the login window.
References
Apple Knowledge Base Documents
The following Knowledge Base document (located at www.apple.com/support) provides further information about network issues.
Document 106796, “Mac OS X: Connect to the Internet, troubleshoot your Internet connection, and set up a small network”
Books
Orebaugh, Angela D. Ethereal Packet Sniffing (Syngress, 2004).
Sloan, Joseph. Network Troubleshooting Tools, 1st ed. (O’Reilly, 2001).
URLs
Mac OS X Downloads: www.apple.com/downloads/macosx
RFC 3164 (Syslog): www.faqs.org/rfcs/rfc3164.html
Network Troubleshooting Guide: http://support.3com.com/infodeli/tools/netmgt/tncsunix/product/091500/c1ovrvw.htm
Network Troubleshooting: http://compnetworking.about.com/cs/troubleshooting
Troubleshooting 101: “Lesson 7, Internet Issues”: www.apple.com/support/mac101/help/7
Syslog—all about it: www.monitorware.com/en/topics/syslog
Syslog Discussion and Help Forum: www.syslog.org
Ethereal: www.ethereal.com
MacSniffer: http://personalpages.tds.net/~brian_hill/macsniffer.html
Logwatch: http://www.logwatch.org
“Introduction to System Startup Programming Topics”: http://developer.apple.com/documentation/MacOSX/Conceptual/BPSystemStartup
Lesson Review
1. What’s the importance of following a methodology when troubleshooting?
4. What are the most important log files, and where are they located?
5. What’s one way to automate log monitoring?
Answers
1. Following a methodology ensures that you ask the right questions at the right time and that you’re able to troubleshoot in an effective and efficient manner.
2. A few are scutil, System Preferences, ipconfig, NetworkInterfaces.plist, and Network Utility.
3. Were you able to log on before, or is this the first time you’ve tried?
Do you know if anything changed recently on your system or in your settings? What is that?
Have you installed all current updates from Software Update (particularly any security updates)?
Is anyone else in the area having a similar issue?
Does the issue persist if you restart?
4. The system log found in /var/log/system.log; the console log found in /var/tmp/console.log; the panic log found in /Library/Logs/panic.log; and the install log found in /Library/Receipts/Mac OS X Log.txt.
5. Create a script that uses grep to detect patterns in logs and emails the results to you. Then, add an entry to the crontab file to run the script at a specific time interval.
6. Login hooks are used to customize login procedure. You can write scripts that can be run at login or logout.