
9
Applying Machine Learning to Clinical Trials and Pharmacovigilance
Clinical trials or clinical research is a crucial phase in the process of taking a drug or therapy to market. Before the clinical trial phase, the drug is tested in labs and on animals only. At the end of the pre-clinical research phase, highly promising candidates are identified, and they move to the clinical trial phase. This is the first time the drug or therapy is administered to humans. The clinical trial phase provides evidence that the drug or therapy is safe enough to be administered in humans and also has the desired effects (efficacy). The process can take anywhere between 10 and 15 years and follows strict guidelines and protocols. It is also a huge investment from drug manufacturers who spend billions of dollars on execution and support for clinical trials. Clinical trials can also be funded by government agencies and academic medical centers (AMCs) for research purposes, such as observing the effects of certain drugs on certain cohorts of patients. They are known as the sponsors of the clinical trial.
As you might have guessed, clinical trials are heavily controlled and regulated by the Food and Drug Administration (FDA) and the National Institutes of Health (NIH), who have strict rules for such studies. Everything from the place where the trials are conducted to the participants of the trial are pre-defined and carefully selected. The trials are supported by doctors, nurses, researchers, and a variety of other medical professionals who have specific roles. There are strict measures in place to maintain the confidentiality of participants during the trial ensuring only authorized personnel have access. The data gathered during clinical trials, especially the adverse events, have strict reporting guidelines and need to be submitted to the FDA and NIH in a timely manner.
Because of their highly controlled conditions, successful clinical trials are not a guarantee that the drug will perform as intended throughout its life cycle when administered to a larger number of patients. In fact, drugs need to be monitored throughout their life cycle for adverse effects. The process of detection, understanding, and prevention of drug-related problems, and then reporting this data to the authorities, is known as pharmacovigilance (PV).
In this chapter, we will dive into the clinical trial process. We will look at the important steps that a drug needs to go through before it is released for general use. Additionally, we will gain an understanding of how the agencies ensure regulations are followed and how they keep the public safe from adverse effects:
- Understanding the clinical trial workflow
- Introducing PV
- Applying ML to clinical trials and PV
- Introducing SageMaker Pipelines and Model Registry
- Building an adverse event clustering model pipeline on SageMaker
Technical requirements
The following are the technical requirements that you need to complete before building the example implementation at the end of this chapter:
- Complete the steps to set up the prerequisites for Amazon SageMaker as described here: https://docs.aws.amazon.com/sagemaker/latest/dg/gs-set-up.html.
- Create a SageMaker notebook instance by following the steps in the following guide: https://docs.aws.amazon.com/sagemaker/latest/dg/howitworks-create-ws.html.
- Create an S3 bucket, as described in Chapter 4, in the Building a smart medical transcription application on AWS section under Create an S3 bucket. If you already have an S3 bucket, you can use that instead of creating a new bucket.
- Open the Jupyter notebook interface of the SageMaker notebook instance by clicking on the Open Jupyter link from the Notebook Instances screen.
- In the top-right corner of the Jupyter notebook, click on New and then Terminal.
- Type in the following commands on the terminal screen:
$cd SageMaker
$git clone https://github.com/PacktPublishing/Applied-Machine-Learning-for-Healthcare-and-Life-Sciences-using-AWS.git
You should now see a folder named Applied-Machine-Learning-for-Healthcare-and-Life-Sciences-using-AWS.
Note
If you have already cloned the repository in a previous exercise, you should already have this folder. You do not need to do step 6 again.
- Onboard to SageMaker Studio Domain using the quick setup described at https://docs.aws.amazon.com/sagemaker/latest/dg/onboard-quick-start.html.
Note
If you have already onboarded a SageMaker Studio Domain from a previous exercise, you do not need to perform step 7 again.
- Familiarize yourself with the SageMaker Studio UI components: https://docs.aws.amazon.com/sagemaker/latest/dg/studio-ui.html.
Once you have completed these steps, you should be all set to execute the steps from the example implementation in the last section of this chapter.
Understanding the clinical trial workflow
Clinical trials are needed for any type of new medical intervention on humans. This includes drugs, therapies, certain types of medical devices, and procedures. The trials follow a plan or a protocol that is defined by the investigator in a protocol document. Depending on the goals of the trial, a clinical trial might aim to compare the safety and efficacy of a product (such as a drug or a device) or a procedure (such as a new therapy) by comparing it against a standard product or a procedure. In some cases, participants are given a drug with no active ingredient, also known as a placebo, to compare them against participants who receive the new drug. This helps determine whether the drug is effective and is working as expected. For example, a new drug being studied to lower blood sugar is given to some participants who have high blood sugar. This is compared to another set of participants who are given a placebo. The observations from the two sets of participants are monitored to see whether the participants who were given the new drug have normal sugar levels or not. In addition, the participants are monitored for any reactions or side effects as a result of taking this new drug. These are known as adverse events and need to be carefully monitored throughout the life cycle of the trial. Adverse events could include minor issues such as nausea, rashes, or headache. There are serious adverse events that might lead to hospitalization or might cause disability, permanent damage, or even death. Principal investigators of the trials ensure they take necessary steps and follow all regulatory aspects and ensure there are no serious adverse events in the trial.
Participants for a trial are carefully chosen based on the goals for the trial, as defined in the protocol. Participants must meet the eligibility criteria, also known as the inclusion criteria for a trial. Additionally, the protocol has details on exclusion criteria for the trial, which may disqualify a participant from the trial. Inclusion and exclusion criteria include demographic information such as age and gender. It might also include specific clinical criteria such as the stage of a certain disease or medical history.
Participation in clinical trials is mostly voluntary, and the protocol defines the number of participants required in the trial. Before becoming a participant in a clinical trial, a person must sign a document that acknowledges that they know the details of the trial and clearly understand their risks and potential benefits. This is known as informed consent. The participants sign the informed consent document and are free to drop from the trial at any time, even before the trial is complete. In general, the informed consent process is designed to protect the participants in the clinical trial. There are multiple review boards and agencies that review the study protocol, the informed consent document, and the overall study design to ensure the safety of the clinical trial participants. One such body is the institutional review board (IRB). They are responsible for reviewing all federally supported clinical studies in the US and consist of physicians, researchers, and members of the community.
Clinical trials help progress the medical field and help bring new drugs and therapies to market that could have profound benefits for future patients. It may have some risks, but the regulators review those carefully and ensure the risks are fairly reasonable when compared to the benefits.
The clinical trial workflow involves multiple steps that are carried out in phases. Now, let’s look at the various steps in more detail by taking a clinical trial for a new drug as an example:
- Study design: During the study design phase, the researchers determine the goals of the trials and the specific questions they are looking to answer. This includes the inclusion and exclusion criteria of the trial, the number of people who can participate, the length and schedule of the trial, and the dosage and frequency of the drugs. It also defines what data will be collected, how often it will be collected, and the rules of analysis and interpretation of the data. This is all available in the trial protocol document that is followed by the clinical trial.
- Phase 1: This is the phase when researchers test the drug on a few participants, usually less than 100. This phase determines how the new drug interacts with the body and carefully monitors the participants for side effects. It also determines the correct dosage of the drug and gathers initial data about how effective the drug is in a small group of participants.
- Phase 2: In phase 2, there are a few hundred patients recruited who have specific clinical conditions that the drug is expected to treat. The main purpose of phase 2 of the study is to determine the safety of the drug. The inputs from phase 2 help in the larger phase 3 study.
- Phase 3: This phase involves hundreds or even thousands of participants. This phase tries to mimic a real-world scenario of administering the drug to large portions of a population and determines whether the drug is beneficial. Because this is a much larger study with many more participants, this phase is able to detect adverse effects that might not have been evident in smaller groups participating in phases 1 and 2. The phase lasts several years and also determines the long-term effect of the drug.
- Phase 4: Although clinical trials are only conducted in these three phases for authorization by the FDA, sometimes a fourth phase of the clinical trial is also referenced. This refers to the post-market launch of the drug and how it performs on thousands of patients who are prescribed the new drug by doctors.
Before a clinical trial can begin in the US, the sponsors submit an application to the FDA to seek approval to begin the trial. This is known as the Investigational New Drug (IND) application process. The manufacturers include all information about the drug, the protocols, any relevant prior data, and details about the investigator for the trial. The FDA offers help to sponsors related to the submission of the IND application and answers any questions the sponsors might have in relation to the application. Once the application is submitted, the FDA has a certain amount of time (usually 30 days) to respond with its decision.
The US national library of medicine maintains a list of clinical trials at https://clinicaltrials.gov/. This is a resource where you can search through a variety of information about specific clinical studies such as their location, their type, their status, and details of the protocols.
While randomized controlled trials provide the necessary information to regulators about the safety and efficacy of the drug in a population with strict inclusion and exclusion criteria, sometimes, it is desirable to study the drug in non-controlled settings in a more diverse patient population. This is where real-world evidence (RWE)-based studies come in. Next, let’s understand RWE in more detail.
Understanding RWE studies
RWE studies are studies designed to understand the long-term effects of a drug on the wider population in uncontrolled settings, mimicking the use of the drug in the real world. RWE studies are done by collecting real-world data (RWD), which is not typically collected in a controlled clinical trial. RWD is passively collected from different sources such as electronic medical records (EMRs), claims and billing systems, prescriptions, and wearable devices. The data is then analyzed over a period of time to help regulators and healthcare providers understand how effective and safe the drug is in patients in their real-world treatment plans. It helps generalize the drug’s effects in a more realistic population of patients.
RWE studies have a wide application both in the pre- and post-launch stages of a new drug. The outcomes from these studies are beneficial for healthcare providers, payers, and regulators. In the pre-launch phase, it helps decide the specifics of the patient population to be included in the trial and helps payers and providers determine the correct treatment plan. Post-launch, it can help determine the correct pricing and coverage for the drug by payers. I can also help physicians determine the right messaging and value proposition for the drug.
Because of its wide scope of data collection and analysis, RWE studies are faced with the challenge of data integration and analysis. In a few cases, the data might be incomplete and might have inconsistencies such as duplicate records. Deriving meaningful information from RWD that is useful for policymakers and regulators involves robust data analysis and processing techniques. Technologies such as big data analytics, natural language processing, speech to text, and even computer vision play a big role in the analysis and interpretation of RWE.
Now that we have an understanding of the clinical trial process, let us look at PV in more detail.
Introducing PV
Before a drug is launched for use, it is tested in small populations under controlled settings, which prevents us from understanding how the drug would behave in the long term on large groups of people. PV refers to the activities and science related to the detection, assessment, and prevention of adverse effects related to medicines. It is designed to improve patient safety and confidence around the use of the drug. During clinical research, PV is conducted by monitoring the patients closely in controlled environments. Post-launch, PV is carried out via observational studies and post-market surveillance (PMS). While the data collected during a clinical trial is better in quality, it is quite limited. Hence, the post-market PV attempts to draw conclusions from a wider real-world dataset in uncontrolled settings.
The central element of post-market PV revolves around the concept of monitoring drug usage in the real world for extended periods of time. During the monitoring process, the data around adverse effects and the severity of those adverse effects are captured. Ultimately, the data is made available to healthcare professionals and patients to generate awareness about the drug’s risks. It may also need to be reported to regulatory agencies. For example, the safety issues related to FDA-regulated products are reported to the FDA using an individual case safety report (ICSR). PV data also helps policymakers and regulators understand trends and approve drug usage in new markets. It helps researchers carry out new R&D activities that improve the safety and efficacy of the drug and even develop new ones.
Now, let us understand how post-market PV is conducted by diving into the different stages of the PV process. There are two broad areas that the PV process can be divided into.
Signal generation
Signal generation is the process of identification of a new adverse drug reaction (ADR). One major source of signal generation is spontaneous reporting. Spontaneous reporting is the voluntary recording and sharing of clinical observations about ADR due to drug usage. This is done by physicians, pharmacists, and even pharmaceutical companies. The reports are investigated by PV staff and are maintained in a database. Since it is a voluntary process, the culture of reporting ADRs via spontaneous reporting varies greatly. It is also difficult to ascertain whether the ADR is due to the reaction from the drug or some other reason in the patient’s care plan. This is also known as signal versus noise and is a key challenge in signal generation. It does have its benefits because data about the ADR is immediately available following the drug launch. Another approach to signal detection is via case reports published in journals that alert physicians about possible hazards of a drug. This method is more rigorous but has limitations, as not all ADRs can be published in journals. In some cases, specialized cohort studies might be set up to generate signals about a new possible ADR. However, because these studies deviate from the real world and have a limited size, it does not guarantee successful signal generation. Organizations might also carry out large randomized trials to study safety concerns about drugs. Once a signal has been generated, the process moves toward the hypothesis testing phase.
Hypothesis testing
Once a concerning report about an ADR associated with a drug arises in the signal generation process, the next step is to prove that the ADR is caused by the drug and not any other factor. This is known as hypothesis testing. The key here is to assess causality between the clinical conditions in individual cases and the taking of a certain drug. The data from spontaneous reporting can be used to assess the hypothesis. For example, if the spontaneous reporting indicates a large number of similar ADRs associated with the drug, it can be further investigated. This is done via epidemiological studies that are observational in nature and improve our understanding of the drug’s safety. Once an ADR has been established, drug manufacturers may choose to include this information in the prescribing material of the drug. As you can imagine, including information about a drug having adverse reactions in the prescribing material of the drug can have huge implications. It might deprive patients of receiving the treatments that they need. It can also result in a lot of negative attention regarding the reliability of the drug if the reported events are of a serious nature. Therefore, it is extremely critical for the hypothesis to be fully tested and established before being associated with the drug.
The PV practice continues to be modernized with the use of technology in the detection and reporting of adverse reactions. However, the key ask remains the same: how can we make drugs safer for patients and reduce the risk of serious adverse reactions? Now, let us look at how ML can be utilized in clinical trials and PV to help reduce the risk to patients and also make the workflow more efficient.
Applying ML to clinical trials and PV
The clinical trial process is mostly sequential and generates large volumes of data in different modalities. These datasets need to be analyzed and processed for information retrieval. The information embedded in these data assets is critical to the success of the overall trial. The information from a previous step might inform how future steps need to be carried out. Moreover, regulatory requirements emphasize strict timelines and governance regarding how you process this information. ML can help automate the repeatable steps in a clinical trial process and help make the trial more efficient. Additionally, it can help with information discovery to better inform regulators and policymakers about future trials. Now, let us look at some common ways in which ML can be applied to clinical trials and PV.
Literature search and protocol design
During the study design phase, scientists need to search through a variety of literature from previous clinical trials to find similar compounds. The information is embedded in multiple documents in a variety of formats. It is also distributed in different sources such as remote file systems, websites, or content portals. ML-based information search and discovery can help crawl for information embedded within these documents and make them accessible to researchers via simple search queries in natural language. One common technique utilized in these search algorithms is graph neural networks. They allow you to train deep learning models on a graph representation of the underlying data.
Information retrieved from these searches can help you to design accurate clinical studies for new trials that take into account the findings and learnings from previous trials. AWS services such as Amazon Kendra allow you to easily create a graph-based search engine customized for your documents. To learn more about Amazon Kendra, refer to the following link: https://aws.amazon.com/kendra/.
Trial participant recruitment
A key step in the clinical trial is the recruitment of the right trial participants. As described earlier, trial participants are carefully selected based on the inclusion and exclusion criteria defined in the protocol document. Another key aspect to keep in mind while selecting the trial participants is their chances of dropping out from the trial. Participation is voluntary and participants are free to drop out at any time, even in the middle of the trial. Mid-trial dropouts can jeopardize the whole trial and delay the process considerably. Therefore, it is important to take multiple aspects into account, beyond just the inclusion and exclusion criteria, before selecting the participants. They could include the participants’ ability to travel to the trial site based on the distance of their residence and the site, the dependents they need to care for while they are participating in the trial, their ability to adhere to the schedule of the trial, and more. These aspects are captured using forms and surveys that volunteers need to fill out. The manual analysis of responses from these forms is time-consuming. Using ML can help automate the analysis of clinical trial recruitment forms and make the process more efficient. For example, named entity recognition (NER) models can recognize specific entities in the clinical trial form that are crucial for patient selection. Classification models can then classify possible participants or a regression model can compute a risk score for them to denote how likely they are to drop out mid-trial.
Adverse event detection and reporting
Safety is the highest priority in any clinical trial. Hence, there are strict regulations in place to report any safety issues such as adverse events to regulatory agencies in a timely manner. Adverse events in clinical trials could be reported in a variety of ways. For example, an ICSR might be used to report specific adverse events for individuals participating in the trial to the FDA. The information about adverse events comes from multiple sources. It might be self-reported by the participants or by the clinicians who are monitoring the patients. It might be reported by mediums such as emails, paper forms, or voice. As a result, it is becoming difficult to gather information about the safety of drugs in a clinical trial and report it in a timely manner to the regulatory agencies. ML models can be trained on safety data to identify possible adverse events from different sources of data. These models can then be applied to data generated in a clinical trial to detect adverse events. It can also monitor for the occurrence of adverse events in real time for participants in a remote trial. It might then be sent to investigators to manually verify and send to regulatory agencies. The process creates a more efficient way of detecting and reporting adverse events.
Real-world data analysis
During the post-market surveillance phase of the drug, real-world data needs to be continuously monitored. It is a crucial phase for the drug as it is being administered by doctors to real patients in uncontrolled environments for the first time. Unwanted outcomes in this phase could result in recalls for the drug, which can prove to be extremely costly for drug manufacturers. As described earlier, RWD is gathered from multiple sources such as EHR systems and payment/claims systems. RWD can also be collected from social media accounts and drug review websites. All this makes data analysis and the capturing of meaningful outcomes extremely difficult from RWD. ML has been successfully used on RWD for PV purposes. Classification models can help classify patients at risk of unwanted clinical outcomes as a result of taking the drug. These models can be built on multi-modal datasets such as voice, images, and clinical notes, which makes these models adapt to real-world scenarios. Ultimately, the predictive models help us to identify events before they happen, giving clinicians enough time to prevent them or make their impact as low as possible to help keep the patients safe.
As you can see, ML has an impact on all stages of the clinical trial and PV process. It helps design smarter trials, execute them more efficiently, and reduce or eliminate adverse events. Now, let us look at a feature in SageMaker that helps us create model pipelines. We will then use this to create an adverse events clustering model pipeline in the last section of the chapter.
Introducing SageMaker Pipelines and Model Registry
In previous chapters of this book, you were introduced to different options in SageMaker to process data, extract features, train models, and deploy models. These options provide you with the flexibility to pick the components of SageMaker that work best for your use case and stitch them together as a workflow. In most cases, these workflows are repeatable and need to be executed in different environments. Hence, you need to maintain them using an external orchestrating tool that helps you design the workflow and maintain it for repeated runs. This is where SageMaker Pipelines comes in.
SageMaker Pipelines is a model-building pipeline that allows you to create a visual directed acyclic graph (DAG) for the various steps of your model-building process and manage it as a repeatable workflow. The DAG is exported in JSON format and provides details about relationships between each step in the pipeline. You can pass the output of one step in your DAG as an input to another step, creating a sequential data dependency between the steps. This is then visually represented to make it easy for you to understand the flow of the pipeline and its various dependencies.
To make it easy for you to define the pipeline, SageMaker provides a Pipelines SDK. You can see more details about the Pipelines SDK at https://sagemaker.readthedocs.io/en/stable/workflows/pipelines/sagemaker.workflow.pipelines.html.
Let us now understand the construct of a basic pipeline and the functionalities it can support.
Defining pipeline and steps
A SageMaker pipeline consists of multiple steps and parameters. The order of execution of the steps is determined by the data dependencies between the steps and is automatically inferred.
Here is an example of a pipeline definition using the SageMaker Pipelines SDK in Python:
from sagemaker.workflow.pipeline import Pipeline
pipeline_name = f"mypipeline"
  pipeline = Pipeline(
      name=pipeline_name,
      parameters=[
          processing_instance_type,
          processing_instance_count,
          training_instance_type,
          model_approval_status,
          input_data,
          batch_data,
      ],
steps=[step_process, step_train, step_eval, step_cond],
  )
As you can see from the preceding code definition, the pipeline accepts a name that must be unique for each region. It also accepts steps in the pipeline such as processing and training. Lastly, the pipeline has a set of parameters such as input data and an instance count.
In addition to these parameters, you can also pass variables in your pipeline steps using pipeline parameters. Here is an example of how to do that:
from sagemaker.workflow.parameters import (
    ParameterInteger,
    ParameterString,
    ParameterFloat,
    ParameterBoolean
)
processing_instance_count = ParameterInteger(
    name="ProcessingInstanceCount",
    default_value=1
)
pipeline = Pipeline(
    name=pipeline_name,
    parameters=[
        processing_instance_count
    ],
    steps=[step_process]
)
As you can see from the preceding code, we defined a parameter called ProcessingInstanceCount and passed it as input when creating the pipeline.
A pipeline supports multiple types of steps that are common in a ML workflow. Some of the common steps are processing, training, tuning, and CreateModel. For a full list of steps and example code showing how to use them, take a look at https://docs.aws.amazon.com/sagemaker/latest/dg/build-and-manage-steps.html#build-and-manage-steps-types.
Caching pipelines
Sometimes, you need to run the same step with the same parameters multiple times when running a pipeline. SageMaker pipeline caching enables you to reuse the results from a previous execution, so you do not need to run the repeatable steps again. It checks for the previous execution with the same invocation parameters and creates a cache hit. Then, it utilizes the cache hit for subsequent executions instead of running the step again. This feature is available for a subset of steps supported by SageMaker Pipelines. To enable step caching, you must define a CacheConfig property in the following manner:
{
    "CacheConfig": {
        "Enabled": false,
        "ExpireAfter": "<time>"
    }
}
Enabled is a Boolean and is false by default. The ExpireAfter string accepts any ISO 8601 duration string. Here is an example of how to enable caching for a training step:
from sagemaker.workflow.pipeline_context import PipelineSession
from sagemaker.workflow.steps import CacheConfig

cache_config = CacheConfig(enable_caching=True, expire_after="PT1H")
estimator = Estimator(..., sagemaker_session=PipelineSession())
step_train = TrainingStep(
    name="TrainAbaloneModel",
    step_args=estimator.fit(inputs=inputs),
    cache_config=cache_config
)
The preceding code block enables caching for one hour on the training step.
There are other useful features within SageMaker Pipelines that allow you to create complex workflows and pass parameters between steps. Its flexible nature allows you to integrate multiple custom steps together. For a full review of the SageMaker Pipelines features, you can refer to the SageMaker developer guide at https://docs.aws.amazon.com/sagemaker/latest/dg/pipelines.html.
Often, it is the case that a pipeline might need to be run multiple times to produce different versions of the same model. Some of these models might not be suitable for deployment to production as their accuracies are not suitable. It is essential to maintain all versions of the model so that the ones ready for deployment can be approved and pushed to production. The SageMaker Model Registry allows you to do this. Let us look at the SageMaker Model Registry in more detail.
Introducing the SageMaker Model Registry
The SageMaker Model Registry supports model groups, which is a way to group together multiple versions of a model for the same use case. The models are maintained in a model package with an associated version number. The model package has the trained model artifacts as well as the inference code that is used to generate inference from the model. A model needs to be registered in a model group before it can be deployed. The registered model is part of a versioned model package that is maintained within the model group. You can view details of any model package using the list_model_packages method that is available in the SageMaker Python SDK. Additionally, you can delete a particular version if it doesn’t apply to the model group.
Another important feature of the SageMaker Model Registry is the ability to update the status of the model. There are three statuses that the model can be: Approved, Rejected, or PendingManualApproval. By default, the models are in PendingManualApproval. Here are the possible transitions that the model can have and their associated effects:
- PendingManualApproval to Approved – This initiates CI/CD deployment of the approved model version
- PendingManualApproval to Rejected – No action
- Rejected to Approved – This initiates CI/CD deployment of the approved model version
- Approved to Rejected – This initiates CI/CD to deploy the latest model version with an Approved status
Once the model has been approved, it is ready to be deployed as an endpoint for inference. These deployments are also allowed across accounts. This is handy when you want to move a model from a staging account (such as dev or test) to a production account. To learn more about the SageMaker Model Registry, please refer to the developer guide at https://docs.aws.amazon.com/sagemaker/latest/dg/model-registry.html.
Now that we understand the basics of SageMaker Pipelines and the Model Registry, let us use these concepts to build a pipeline for clustering adverse events associated with drugs.
Building an adverse event clustering model pipeline on SageMaker
Now let us build a pipeline to train an adverse event clustering model. The purpose of this pipeline is to cluster adverse events detected in drug reviews using an unsupervised clustering model. This can help investigators group drugs with certain reported clinical conditions together and facilitates investigations related to adverse events. We will read some raw drug review data and extract top clinical conditions from that data. Let us now look at the details of the workflow. Here is a diagram that explains the steps of the solution:

Figure 9.1 – The pipeline workflow
As shown in the preceding diagram, we use Amazon Comprehend Medical to extract clinical conditions from the raw drug reviews. These clinical conditions are reported by the end users as adverse events while taking the drug. We take the top five clinical conditions as relevant topics on which we would like to cluster. Clustering is an unsupervised learning technique that allows us to derive groupings from unlabeled data. For the purposes of this solution, we randomly choose 100 drugs from the raw dataset to limit the execution time for the processing step.
Next, we vectorize the extracted topics for each drug using a term frequency–inverse document frequency (tf–idf) vectorizer. This generates numerical representations of the topics, based on the frequency with which they occur in the corpus. For this step, we create a custom Docker container and run it on SageMaker Processing. To learn more about tf–idf, you can refer to https://en.wikipedia.org/wiki/Tf%E2%80%93idf.
Lastly, we create two clusters from these vectors to separate the topics into two groups. We deploy the model as a SageMaker endpoint and generate predictions for each drug in our sample.
The raw data processing, training, and registration of the trained model are part of a SageMaker pipeline. We will run the pipeline as a single execution that will read 100 drug reviews from the raw data, extract topics from each review, vectorize the topics, and train and register the model on the SageMaker Model Registry. Then, we will approve the model for deployment and deploy the model as a real-time endpoint to generate our cluster predictions for each drug.
The raw dataset for this application is available for download from the UCI ML repository at https://archive.ics.uci.edu/ml/datasets/Drug+Review+Dataset+%28Drugs.com%29.
You do not need to download this dataset manually. This is done by the processing script when we run it in the pipeline. So, let’s get started!
Running the Jupyter notebooks
The notebooks for this exercise are saved on GitHub at https://github.com/PacktPublishing/Applied-Machine-Learning-for-Healthcare-and-Life-Sciences-using-AWS/tree/main/chapter-09.
As you can see, we have two notebooks for this exercise. The first one creates the pipeline, and the second one deploys the model and generates predictions. We will also use the SageMaker Model Registry to approve the model before running the second notebook:
- Open the Jupyter notebook interface of the SageMaker notebook instance by clicking on Open Jupyter from the Notebook Instances screen.
- Open the first notebook for this exercise by navigating to Applied-Machine-Learning-for-Healthcare-and-Life-Sciences-using-AWS/chapter-9/ and clicking on adverse-reaction-pipeline.ipynb.
- Follow the instructions in the notebook to complete the exercise.
Once you have completed the steps of the first notebook, you have started a pipeline execution for our model pipeline. Let us use the SageMaker Studio interface to look at the details of our pipeline.
Reviewing the pipeline and model
Let’s take a closer look at our pipeline:
- Launch SageMaker Studio from the AWS console.
- In the left-hand navigation pane, click on the SageMaker resources icon, as shown in the following screenshot:

Figure 9.2 – The SageMaker resources icon in SageMaker Studio
- Select Pipelines from the drop-down menu. You should see a pipeline named adverse-drug-reaction, as shown in the following screenshot:

Figure 9.3 – The SageMaker pipeline screen
- Double-click on the adverse-drug-reaction pipeline. This will open up all the executions of the pipeline on the right-hand window.
- Click on the Graph tab at the top. This will show you a visual representation of your pipeline, as shown in Figure 9.4:
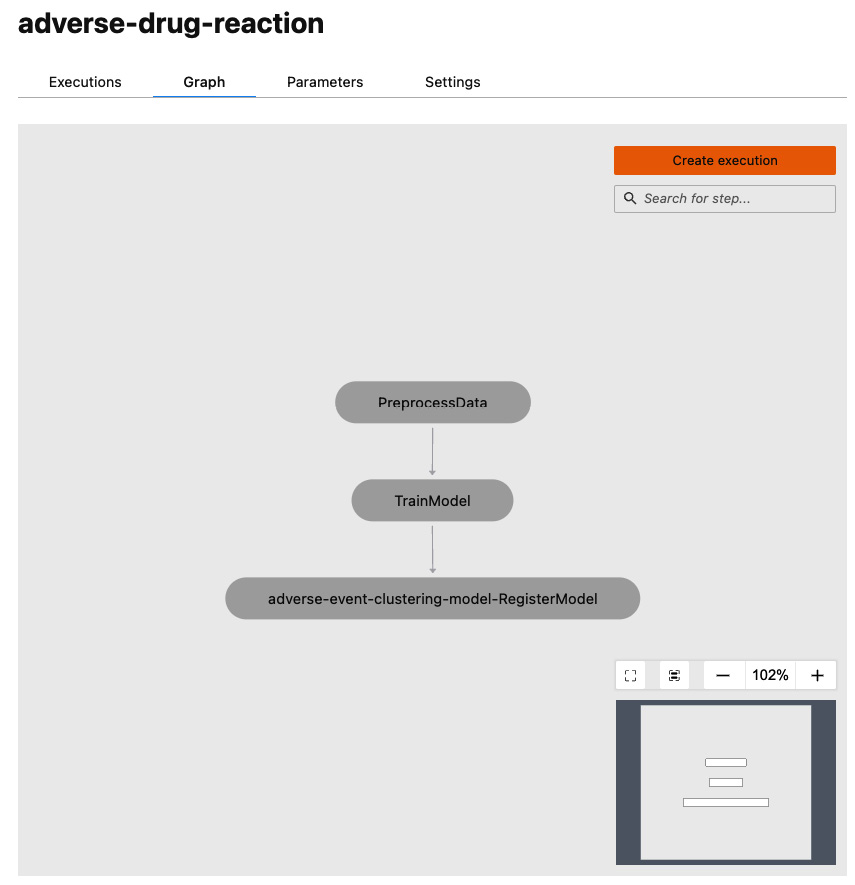
Figure 9.4 – The SageMaker pipeline graph
As you can see, our pipeline consists of three sequential steps to preprocess data, train the model, and register the model in the Model Registry.
- Go back to the Executions tab at the top. Double-click on the latest execution. This will open up the details of the execution.
- You might still have your pipeline in execution mode. Wait for all three steps to complete. Once the steps are complete, they should turn green. Examine the steps in the execution by clicking on them, as shown in the following screenshot:

Figure 9.5 – The PreprocessData step details
As you can see in Figure 9.5, you can look at the details of each step in our pipeline by clicking on them. For example, here I am looking at the logs from my preprocessing step.
Now let us look at the model that was registered by our pipeline in the SageMaker Model Registry. We will also approve the model for deployment after we examine it.
- Click on SageMaker resources in the left-hand navigation pane of SageMaker Studio. Select Model Registry from the drop-down menu. Double-click on the model group name: adverse-event-clustering. This will open up the models in this package, as shown in the following screenshot:
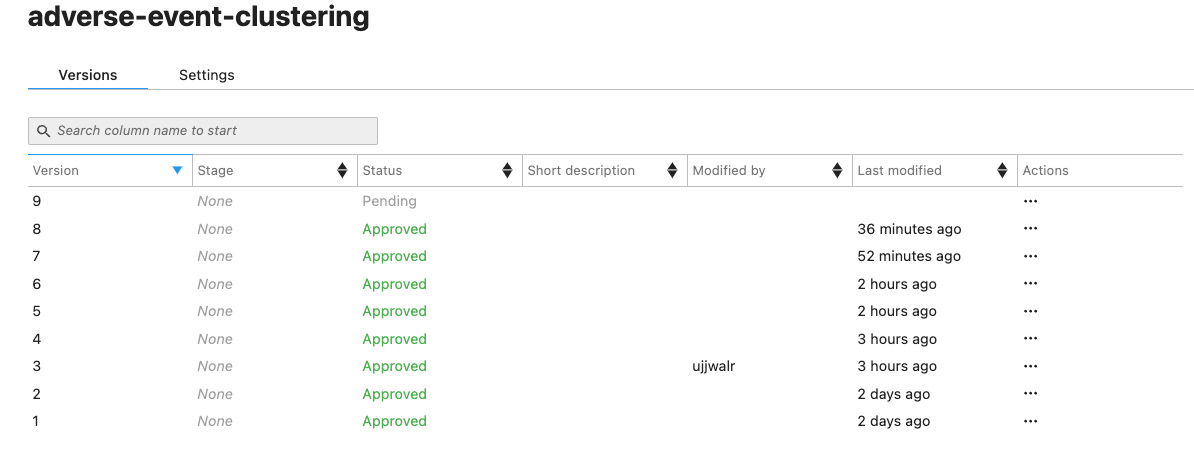
Figure 9.6 – Model versions
- The latest version of the model will show the status as Pending. Double-click on it. This will open the model details screen:

Figure 9.7 – The model version status
In my case, the model version is 9, but if this is your first time running this pipeline, your model version will be 1.
- Click on the Update status button in the top right corner. On the next screen, select Approve from the Status drop-down menu, as shown in Figure 9.10, and then click on Update status:

Figure 9.8 – Update model version status
We have just approved our model to be deployed for inference. You should now see that the status of the model is Approved in the model package screen that we accessed in step 11.
Next, we will deploy the approved model, run some predictions on it, and examine our results via a scatter plot.
Deploying model and running inference
The second notebook deploys the model and generates predictions. Before you perform the following steps, make sure the model in the registry is in the Approved state:
- Open the Jupyter notebook interface of the SageMaker notebook instance by clicking on Open Jupyter from the Notebook Instances screen.
- Open the first notebook for this exercise by navigating to Applied-Machine-Learning-for-Healthcare-and-Life-Sciences-using-AWS/chapter-9/ and clicking on adverse-reaction-inference.ipynb.
- Follow the instructions in the notebook to complete the exercise.
At the end of this notebook, you should see a scatter plot showing the clustering model inference output for the adverse reaction inputs. The plot should look similar to the following:

Figure 9.9 – Sample output of the clustering model
This concludes our exercise. Please make sure you stop or delete your SageMaker resources to avoid incurring charges, as described at https://sagemaker-workshop.com/cleanup/sagemaker.html.
Summary
In this chapter, we went into the details of how a new drug is tested for safety and efficacy before it can be launched in the market. We understood the various phases in the clinical trial workflow and looked at how regulatory agencies make policies to ensure the safety of patients and trial participants. We understood the importance of PV in the overall monitoring of the drug and looked into the details of real-world data. Additionally, we learned about how ML can optimize the clinical trial workflow and make it safer and more efficient. Finally, we learned about the new features of SageMaker called SageMaker Pipelines and Model Registry, which can aid in these processes. We also built a sample workflow to cluster adverse event data about drugs.
In Chapter 10, Utilizing Machine Learning in the Pharmaceutical Supply Chain, we will look at how pharma manufacturers are utilizing ML to maximize the return on multi-year investments and launching a new drug on the market.