
10
Utilizing Machine Learning in the Pharmaceutical Supply Chain
The pharmaceutical supply chain refers to the process and components involved in the manufacturing and delivery of drugs that patients need promptly. It is a complicated process that involves synchronization between multiple entities and systems. There are multiple stakeholders along the way, each with its own success criteria that define how the drug gets manufactured, distributed, and prescribed. The prescription drugs are sent directly to pharmacies that distribute them to patients in accordance with their prescriptions. Nonprescription drugs or over-the-counter (OTC) drugs are sold directly by retailers to consumers. In both cases, demand forecasting for the drug has a big influence on its manufacturing and distribution. Knowing how much of a particular drug would be needed at a particular pharmacy or store helps optimize manufacturing and distribution pipelines to ensure they can keep up with demand.
To ensure pharmaceutical manufacturers have the best returns on their investments and improve profitability, it is important for them to reinforce demand generation for their brand of drugs in an increasingly competitive market. One of the ways they do this is by investing heavily in sales and marketing for the drug. They allocate large budgets for marketing their drugs in the media and also hire large teams of pharmaceutical sales representatives who are compensated with commission for selling their drugs to physicians who can prescribe them and retailers who can sell them over the counter. Another important factor to consider is the price point of the drug. This has to be carefully balanced to take into account the investments made by the pharmaceutical companies in the research and manufacturing of the drug and also the profit margins they expect. There has been increasing scrutiny by policymakers on drug prices, with the increasing price of prescription drugs controlled largely by for-profit pharmaceutical companies.
ML plays a big role in making sure that drugs are manufactured in the right volume while reducing waste and are distributed based on demand, and that the right physicians and patients are targeted to ensure maximum success. It is also essential to track market performance based on which pharmaceutical companies can take timely corrective action in case things do not go as expected. In this chapter, we will understand the pharmaceutical supply chain and get into the details of how it functions. We will look at the important ways in which ML can optimize the pharmaceutical supply chain and ensure it’s run in the most optimal manner.
This chapter will cover the following topics:
- Understanding the pharmaceutical supply chain landscape
- Applying ML to the pharmaceutical supply chain and sales
- Introducing Amazon Forecast
- Building a pharmaceutical sales forecasting model using Amazon Forecast
Technical requirements
You need to complete the following technical requirements before building the example implementation at the end of this chapter:
- Complete the steps to set up the prerequisites for Amazon SageMaker, as described here: https://docs.aws.amazon.com/sagemaker/latest/dg/gs-set-up.html.
- Create a Simple Storage Service (S3) bucket, as described in Chapter 4, in the Building a smart medical transcription application on AWS section, under the Creating an S3 bucket heading. If you already have an S3 bucket, you can use that instead of creating a new bucket.
- Onboard to SageMaker Studio Domain using the quick setup, as described here: https://docs.aws.amazon.com/sagemaker/latest/dg/onboard-quick-start.html.
Note
If you have already onboarded a SageMaker Studio domain from a previous exercise, you do not need to perform step 3 again.
- Once you are in the SageMaker Studio interface, click on File | New | Terminal.
- Once in the terminal, type the following command:
git clone https://github.com/PacktPublishing/Applied-Machine-Learning-for-Healthcare-and-Life-Sciences-using-AWS.git
You should now see a folder named Applied-Machine-Learning-for-Healthcare-and-Life-Sciences-using-AWS.
Note
If you have already cloned the repository in a previous exercise, you should already have this folder. You do not need to do step 5 again.
- Familiarize yourself with the SageMaker Studio UI components: https://docs.aws.amazon.com/sagemaker/latest/dg/studio-ui.html.
Once you have completed these steps, you should be all set to execute the steps in the example implementation in the last section of this chapter.
Understanding the pharmaceutical supply chain landscape
The overall pharmaceutical supply chain landscape is constantly changing. This is due to the introduction of new technologies to streamline the flow of drugs across the different entities that take part in the process. There are three main entities when it comes to the overall landscape of the pharmaceutical supply chain industry:
- Drug manufacturers
- Distributors or wholesalers
- Consumers
Drug manufacturers
The pharmaceutical supply chain process starts from the manufacturing of the drug or biologic. They are manufactured by pharmaceutical organizations themselves in their own facilities or are outsourced to manufacturers who manufacture the drugs on their behalf. Drug manufacturers are responsible for ensuring the continuous supply of drugs for their consumers. They track market demand and make adjustments to their manufacturing volumes accordingly. It is also critical they do not over manufacture the drugs as the drugs have a very specific shelf life with a set expiry date. Specialty drug manufacturers, such as the ones that manufacture therapies using biologics in small batches, have very specific requirements around the demand that can be tracked more easily. This is due to the precise nature of the therapy and the circumstances in which it should be used. Drugs that are mass-produced in large batches, however, require more careful data analysis to determine the trends in demand across large groups of consumers. Manufacturers also have a say in the pricing of the prescription drug. The pricing depends on a number of factors, such as the cost of production, the demand for the drug, and the existing competition for the drug. The pricing decides the wholesale acquisition cost (WAC) of the drug.
Distributors or wholesalers
Drug manufacturers sell their products to consumers such as pharmacies, clinics and healthcare facilities, retailers, and other specialty institutions. In some cases, they may even sell them to health plans and government purchasers. It is difficult for drug manufacturers to track the supply chain demand across these large groups of consumers. As a result, they rely on wholesalers (distributors). Wholesalers act as a bridge between drug manufacturers and consumers. The manufacturers are responsible for distributing the drug to the wholesalers from the manufacturing facilities where the drugs are produced. This is far easier to accomplish as the number of wholesalers that manufacturers have to deal with is far fewer than a large number of direct consumers. The wholesaler acquires the drugs in bulk from manufacturers, manages the inventory of the drugs, and distributes the drugs to the consumers. In return, they receive a fee for their services and are also entitled to a discount due to bulk purchasing.
Consumers
Once the distributors have the drug, they send it to thousands of pharmacies, clinics, or facilities that can make it available to patients who need it. Pharmacies account for more than 70% of consumers in the prescription drug market. Pharmacies purchase the drugs from wholesalers at a pre-negotiated price under a contractual agreement. This price may be different from the WAC and depends on multiple factors, such as the size of the pharmacy chain, the proportion of the cost of the drug that the payers are willing to cover, and the out-of-pocket expenses for the patients. A key player in the middle of all these negotiations is a pharmacy benefit manager (PBM). PBMs help reduce the cost of prescription drugs by negotiating better rebates from manufacturers and pharmacies. They encourage the use of low-cost generics versus expensive brand medications and manage the overall prescription drug benefits.
It does seem like a straightforward operation, but the pharmaceutical supply chain industry has been facing multiple challenges lately. Let us summarize some of those in the next section.
Summarizing key challenges faced by the pharmaceutical supply chain industry
With the introduction of new drugs and therapies, unique ways of selling them are becoming more predominant. Specialized drugs and biologics require complex storage infrastructure and facilities to maintain conditions in which the drugs need to be stored. Moreover, there is increased scrutiny of increasing prescription drug prices and the role the pharmaceutical supply chain plays in the price of drugs. Drug manufacturers are required to maintain higher levels of transparency in the entire process to ensure regulators have visibility into details of the manufacturing process. All these factors are responsible for creating more complexities in the pharmaceutical supply chain life cycle. Moreover, manufacturers usually cannot pre-plan the manufacturing of new drugs until they are certain of their success in the clinical trial process. They have to wait for the drug to be cleared for production before they can start setting up the manufacturing facilities. This can cause supply shortages and results in bottlenecks that could cause disruptions in the manufacturing process. Lastly, it is a very competitive landscape, and drug manufacturers need to come up with new manufacturing and distribution strategies all the time to keep up with the competition and maintain profitability. All this introduces a need for regular modernization of supply chain processes.
At the end of the day, a thriving and robust pharmaceutical supply chain is good for us. It helps get much-needed medications to patients in a timely and cost-effective manner. Let us now look into the role that sales representatives play in this overall landscape.
Introducing pharmaceutical sales
The pharmaceutical sales industry is a highly competitive, fast-paced environment that involves selling medical products to consumers who can distribute them among patients. For prescription drugs, it is the physician who is the target consumer for the drug as physicians prescribe drugs to patients. In a situation where there are multiple brands selling drugs for treating the same conditions, physicians can provide an edge to one brand versus the other. To do this, however, is not easy. Drugs that treat common clinical conditions often consist of the same formula, and there are usually generic substitutes available at a far lesser cost. To help, pharmaceutical industries and distributors hire pharmaceutical sales representatives (pharma sales reps) who are tasked with increasing sales for a particular brand of drug.
A pharma sales rep is one of the most sought-after jobs in the country and it pays a high salary and commissions. However, it is also very demanding. Unlike other sales reps, pharma sales reps do not sell directly to patients. Instead, they utilize a variety of ways to influence providers to prescribe more of their drugs. There is no magic bullet or manual that helps them succeed at this. In fact, the process may vary based on who the provider is. They may visit a provider multiple times to educate them about the product they are trying to sell. In essence, they need to be knowledgeable about the product and must be able to answer questions that providers might have. They also need to be aware of the competitive landscape for the product, and they must know why their product is better than the competitors’.
The job of a pharma sales rep goes beyond their knowledge and domain experience. It has a lot to do with the rep’s networking and relationship-building skills. They need to maintain a long-term relationship with the providers they are targeting and visit them repeatedly to update them about their products. A lot of these visits may not result in any substantial outcome for the pharma company. Instead, the purpose of the visit is to keep the providers up to date about the company’s future plans and roadmap, discuss benefits and case studies of the product, address any questions about the products as they come up from patients who are receiving them, and also gather competitive intelligence.
Technologies play a huge role in giving sales reps an edge over their competitors. The sales data can uncover a variety of metrics that help reps improve their performance. It helps them target the right providers and analyze market sentiment to better inform them on the field. Let us now look at how ML can help improve the pharmaceutical supply chain and sales.
Applying ML to the pharmaceutical supply chain and sales
The evolution of the global pharmaceutical industry has introduced new challenges and complexities in the supply chain process. It needs to cater to new distribution mechanisms for therapeutics, adhere to new regulations around supply chain transparency, cater to storage requirements of specialized biologics, and also be flexible enough to handle changes. Moreover, the supply chain should be resilient enough to avoid disruptions. These disruptions can be caused by a variety of reasons such as natural disasters, equipment failures, shortage of raw materials, or even cyber-attacks on IT infrastructure.
ML can help reduce supply chain disruptions and optimize them to reduce waste and increase efficiency. Let us now look at some of the common ways in which we can apply ML to the pharmaceutical supply chain and sales workflows.
Targeting providers and patients
As described earlier, pharmaceutical sales involves visiting providers multiple times to educate them about the benefits of the product. These visits are time-consuming, and going about them randomly can waste a lot of time. Hence, finding the right target audience for the pharmaceutical product is essential.
One of the common ways that ML can help is by identifying probable providers who are more likely to prescribe the product. This can be done using a recommendation engine. A recommendation engine is an ML model that recommends the most important or relevant items to a consumer. Recommendation engines have a wide array of applications. For example, they can be used to suggest books to buyers based on their past reading habits, and they can suggest movies to users based on their past likes or dislikes of certain genres or categories. In the case of pharmaceutical sales, they can look at multiple features about the provider—such as their specialty, their past case details, and their patient population demographics—to determine how likely they are to prescribe a certain product. Similarly, recommendation engines can also be applied to patient populations to find cohorts of patients who can have the most positive outcomes from the use of the medical product. In fact, patients can also use them to get recommendations on providers, based on their clinical conditions. To make it easier for customers to create accurate recommendation engines, Amazon Web Services (AWS) provides Amazon Personalize, a fully managed service to create personalized recommendations for a variety of use cases. To learn more about Amazon Personalize, visit the following link: https://aws.amazon.com/personalize/.
Forecasting drug demand and sales outlook
Demand forecasting is an integral part of the pharmaceutical supply chain industry. It helps route drugs appropriately based on their projected demand, allows distributors to keep adequate stock, helps replenish raw materials based on expected spikes in demand, and also helps determine projected profits and revenue for a product. Forecasts are generated using a temporal attribute that stores the time feature. It defines the granularity of the forecast, such as yearly, monthly, and weekly. To generate a forecast, you need a dataset that has that temporal feature and an associated value you want to predict. For example, to forecast the monthly demand for a drug, you need data from past months that have the monthly sales quantities for the drug. It may require that you derive this dataset from raw transactional data in a sales database if it’s not readily available. In many cases, the forecast can be improved if we add more associated features to the dataset. These associated features help provide more context to the forecasting engine by adding features to the training data. Another way forecasts can become more complex is by adding an associated time series feature. This time series is not the attribute we are predicting but provides additional information about the forecast training dataset.
Forecasting algorithms utilize a range of simple statistical methods to complex deep learning (DL) neural networks (NNs) that understand the context between the target time series, additional features, and associated time series. The more complex the forecasting problem is, the more complex the feature engineering and modeling steps. To make it easy, AWS provides Amazon Forecast, a fully managed service to generate accurate forecasts from a variety of time series datasets. We will introduce Amazon Forecast in the next section and use it to build a pharmaceutical sales forecasting model.
Implementing predictive maintenance
Drug manufacturing equipment needs to be serviced and cared for regularly to avoid failures. A shutdown of the equipment can cause major disruptions in the drug supply chain. Moreover, since a lot of the supply chain steps are sequential, the impact of failures in the manufacturing facility can extend far beyond the facility itself and impact downstream drug distributions. A shutdown of a facility that manufactures drugs can cause major losses for the pharmaceutical company. Manufacturers can use ML models to carry out predictive maintenance of manufacturing equipment and prevent total shutdowns.
Sensors mounted on the equipment collect data at regular intervals. These datasets are then aggregated to look at trends around equipment performance. Models trained to predict the need for maintenance can then sound alarms and notifications in case maintenance is needed. If the equipment cannot be connected to a network for some reason, these models can be deployed directly on the equipment to generate real-time inference on equipment data. ML models can also help reduce manual errors in manufacturing processing by automating repeatable tasks. For example, computer vision algorithms can identify manufacturing defects using images from the manufacturing facility. The use of advanced analytics and ML in manufacturing facilities helps modernize manufacturing practices and is the basis of smart factories with an interconnected network of machines.
Understanding market sentiment and completive analysis
Market sentiment, taken from reviews about a drug, is an essential factor in predicting how successful it will be in the market. A bad review on a credible forum can cause a negative impact on sales of the product. Moreover, if the review contains information about serious side effects due to the drug, it may cause further scrutiny for the pharmaceutical company. While you cannot prevent bad reviews, it is still important to track them to understand the market sentiment around the drug. For example, if there are multiple reviews about a side effect from the drug that was not recorded in the trials, the scientists can proactively evaluate the drug for side effects and issue a warning if necessary. If, however, the side effect is a false alarm, you can use marketing channels and educational material to clear the air. This creates a proactive way of engaging your customer base rather than being reactive, whereby you wait for bad reviews to negatively impact the sales of the drug and then take corrective action. Another important aspect of market analysis is to understand the competitive landscape for the drug. For example, reviews that compare one drug to another might be from competitors, and the details in the comparison could be important to differentiate one product from another.
Natural language processing (NLP) algorithms can detect sentiments (positive, negative, neutral) from free text notes and associate them with the drug. They can also extract important information from reviews using named entity recognition (NER) and classify the reviews based on multiple categories. These techniques help reduce human dependency by reading these reviews and determining the ones that are of interest.
These are just some of the common applications of ML in the pharmaceutical supply chain. Over the years, as the supply chain industry is transformed and ML technology becomes more accessible, the applications of this technology in the pharmaceutical industry are only expected to grow. Now that we have a good understanding of the pharmaceutical supply chain and sales industry, let us dive into Amazon Forecast and use it to build a forecasting model for pharmaceutical sales.
Introducing Amazon Forecast
Amazon Forecast is a managed AI service from AWS that allows you to create accurate time series forecasting models. The service allows you to import time series datasets, preprocess and clean up the datasets for training, train a forecasting model, and deploy it to generate forecasts on future time intervals. You can then export these forecasts to visualize the results on reporting platforms such as Amazon QuickSight. You can also visualize the results on the AWS console or use the API to get real-time results.
Amazon Forecast provides multiple options when it comes to the choice of algorithms to use while training a model. They range from statistical methods to DL algorithms, and you can choose them based on factors such as the volume of the data, the number of missing values in the data, and also the complexity of the dataset. Let us look in more detail at the algorithms that Amazon Forecast provides.
Amazon Forecast algorithms
The models created by Amazon Forecast can use one of the following algorithms for training:
Note
You also have the choice of letting Forecast choose the optimal algorithm for you by choosing the AutoML option. This option lets Forecast choose the optimal algorithm to train the model.
- Autoregressive Integrated Moving Average (ARIMA): ARIMA is a statistical algorithm commonly used for time series forecasting. It learns by the extrapolation of seasonal oscillations in time series data and filtering out any noise that does not correlate to the seasonal patterns. It uses these patterns to predict future values in the time series. To learn more about ARIMA, look at the following link: https://en.wikipedia.org/wiki/Autoregressive_integrated_moving_average.
- Exponential Smoothing (ETS): ETS is another common statistical method used for time series forecasting. It computes a weighted average across all data points in the input time series. These weights decrease over time and are based on a smoothing parameter that remains constant. To learn more about ETS, look at the following link: https://en.wikipedia.org/wiki/Exponential_smoothing.
- Non-Parametric Time Series (NPTS): The NTPS algorithm is based on probabilistic methods and is especially useful for sparse time series with 0 values that occur in bursts. It uses past observations to predict future value distributions of a given time series. The time series in the dataset can be of different lengths as NTPS computes predictions for each time series individually. The NTPS algorithm has the following variants:
- NPTS: This variant assumes that recent values in the time series have more weightage than values in the distant past. As a result, it associates weights based on how far they are from the current time. Predictions are generated using all observations in the time series.
- Seasonal NPTS: This variant looks at the value from past seasons instead of looking at all observations. For example, for a daily forecast that predicts the value on day d, the algorithm learns by looking at the observations on day d in the past weeks. The weights become lesser as the observations move further into the past.
- Climatological forecaster: This variant of NPTS samples all observations from the past with uniform probability.
- Seasonal climatological forecaster: This variant of NPTS samples seasonal observations from the past with uniform probability.
- Prophet: Prophet is a Bayesian structural time series algorithm that is especially useful on datasets with extended time periods of detailed observations. It uses an additive regression model with a piecewise or logistic growth curve trend and is able to handle missing values or large outliners in the training dataset. For more details on Prophet, check out the following link: https://research.facebook.com/blog/2017/2/prophet-forecasting-at-scale/.
- Convolutional Neural Network – Quantile Regression (CNN-QR): CNN-QR is a proprietary model that can be used to predict one-dimensional time series using causal convolutional NNs (CNNs). It trains one global model from a large collection of time series and uses a quantile decoder to generate predictions. Because of its NN-based architecture, CNN-QR can generate forecasts with large and complex datasets. It is also useful for cold-start scenarios where there is little or no existing historical data. This algorithm is also computationally more expensive compared to other algorithms that are based on statistical methods.
- DeepAR+: DeepAR+ is a supervised learning (SL) algorithm based on recurrent NN (RNN)-based architecture. The algorithm trains a single global model based on hundreds of time series in your dataset. DeepAR+ can accept associated feature time series in addition to the target time series. Moreover, each target time series can have a number of categorical features. These categorical features allow the algorithm to learn the typical behavior of the target within a group. The algorithm also generates computed features based on the granularity of the target time series. For example, for an hourly forecast, the algorithm generates hour-of-day, day-of-week, day-of-month, and day-of-year features. Because of its NN-based architecture, the algorithm is suitable for large complex datasets with many associated features and time series. It is also computationally more expensive than other algorithms based on statistical methods.
As you can see, Amazon Forecast provides a variety of algorithms for different forecasting problems. To know more about these algorithms, you can visit the following link: https://docs.aws.amazon.com/forecast/latest/dg/aws-forecast-choosing-recipes.html.
Let us now take a look at the various steps you need to perform to generate a forecast using the Amazon Forecast service.
Importing a dataset
The first step in using Amazon Forecast is to create and import a dataset. The dataset is defined by its schema. During the import job, the forecast service assumes the exact same structure of the dataset as defined in the schema. The dataset is organized as a group within Forecast known as a dataset group, which consists of associated information in the form of complementary dataset files. Each dataset group consists of a target time series, related time series, and item metadata. The target time series file is the minimum required file for the forecast dataset and consists of the field that we want to predict in our forecast. The related time series dataset is a time series that is associated with the target time series, but it doesn’t have the target field in it. Lastly, the item metadata doesn’t consist of any time series but has fields related to the target. Note that both the related time series and item metadata are optional within a dataset group. Moreover, only DeepAR+ and CNN-QR algorithms can make use of the item metadata dataset.
Amazon Forecast also provides pre-defined dataset domains for forecasting problems in specific domains. These include domains such as retail, inventory planning, and workforce. It also provides a custom domain for any type of time series that does not fall into the pre-defined domain. Once a dataset and dataset group are created, you can train a predictor using that dataset.
Training forecasting models
The next step is to train a prediction model using our dataset. A key part of this step is the choice of the forecasting algorithm. As described earlier, Amazon Forecast provides a range of statistical and NN-based models for generating predictions. It is important to consider the choice of algorithm carefully and make sure you apply the right algorithm to the dataset and problem at hand. You may also choose the AutoML option to allow Forecast to choose the right algorithm for you based on the dataset, as mentioned previously. One great way to compare the accuracies of your own chosen algorithm and the auto predictor is to upgrade your own predictor to an auto predictor. This creates a new version of the trained model so that you can run comparisons against both versions of the model. To train a predictor, Amazon Forecast needs the dataset group, the forecast frequency (hourly, daily, weekly, and so on), and the forecast horizon, which is the number of time steps to generate in the forecast.
Amazon Forecast generates prediction metrics such as Root Mean Square Error (RMSE) and Weighted Quantile Loss (wQL) to evaluate the model performance. You may also choose to retrain your models when new data is available and monitor the performance of your model using the metrics generated by Forecast or using the built-in predictor monitoring feature. When you do this, the original predictor remains intact and a new predictor with a new Amazon Resource Name (ARN) is created. Once you have trained your prediction model, it is time to generate forecasts from it.
Generating forecasts
Forecast generation corresponds to the inference step in a typical ML pipeline. Amazon Forecast deploys the trained model as a predictor that is ready to be queried to generate forecasts. A forecast is generated for an item in the dataset. Once generated, you can query the forecast using the API provided by the service; while querying, you can define filter criteria as key-value pairs in the query corresponding to feature-value pairs in the dataset. You can also export the forecast results as a CSV file for integrating it with other services from AWS or for integration with other downstream systems. Lastly, you can explain the model predictions using the expandability features of Amazon Forecast. This allows you to generate impact scores for features that contribute to the model results.
There are other features in Amazon Forecast such as what-if analysis, which lets you mock up different scenarios about how a forecast may be impacted if you change the values of certain input features in the training data. It is done using a related time series dataset and models how changes to the baseline-related time series dataset will impact the forecast. To know more about all features and capabilities of Amazon Forecast, you can refer to the developer guide here: https://docs.aws.amazon.com/forecast/latest/dg/what-is-forecast.html.
Now that we understand the functionalities of Amazon Forecast, we will use this service to generate a time series forecast for predicting pharmaceutical sales in the next section.
Building a pharmaceutical sales forecasting model using Amazon Forecast
In this section, we will use Amazon Forecast to build a forecasting model to predict sales quantities for a drug. We will generate two different forecasts. The first one will be at the hourly granularity, and the second one will be at the daily granularity. We will then visualize the forecasts using a chart. Let’s begin by downloading the dataset.
Acquiring the dataset
The dataset for this exercise is available at the following link: https://www.kaggle.com/code/milanzdravkovic/pharma-sales-data-analysis-and-forecasting/data.
You can see the contents of the saleshourly.csv file here:
|
Download the files saleshourly.csv and salesdaily.csv from the above portal. Let us look at the contents of the two files in a bit more detail.datum |
M01AB |
M01AE |
N02BA |
N02BE |
N05B |
N05C |
R03 |
R06 |
Year |
Month |
Hour |
Weekday Name |
|
1/2/14 8:00 |
0 |
0.67 |
0.4 |
2 |
0 |
0 |
0 |
1 |
2014 |
1 |
8 |
Thursday |
|
1/2/14 9:00 |
0 |
0 |
1 |
0 |
2 |
0 |
0 |
0 |
2014 |
1 |
9 |
Thursday |
|
1/2/14 10:00 |
0 |
0 |
0 |
3 |
2 |
0 |
0 |
0 |
2014 |
1 |
10 |
Thursday |
|
1/2/14 11:00 |
0 |
0 |
0 |
2 |
1 |
0 |
0 |
0 |
2014 |
1 |
11 |
Thursday |
|
1/2/14 12:00 |
0 |
2 |
0 |
5 |
2 |
0 |
0 |
0 |
2014 |
1 |
12 |
Thursday |
Figure 10.1 – Contents of the saleshourly.csv file
The saleshourly.csv file consists of quantities of drugs sold at every hour. The datum column consists of timestamps corresponding to each hour. The M01AB to R06 column headings denote the names of the drugs. It also consists of Year, Month, Hour, and Weekday Name values for each hour the drug was sold.
Here, you can see the contents of the salesdaily.csv file:
|
datum |
M01AB |
M01AE |
N02BA |
N02BE |
N05B |
N05C |
R03 |
R06 |
Year |
Month |
Hour |
Weekday Name |
|
1/2/14 |
0 |
3.67 |
3.4 |
32.4 |
7 |
0 |
0 |
2 |
2014 |
1 |
248 |
Thursday |
|
1/3/14 |
8 |
4 |
4.4 |
50.6 |
16 |
0 |
20 |
4 |
2014 |
1 |
276 |
Friday |
|
1/4/14 |
2 |
1 |
6.5 |
61.85 |
10 |
0 |
9 |
1 |
2014 |
1 |
276 |
Saturday |
|
1/5/14 |
4 |
3 |
7 |
41.1 |
8 |
0 |
3 |
0 |
2014 |
1 |
276 |
Sunday |
|
1/6/14 |
5 |
1 |
4.5 |
21.7 |
16 |
2 |
6 |
2 |
2014 |
1 |
276 |
Monday |
Figure 10.2 – Contents of the salesdaily.csv file
The salesdaily.csv file consists of quantities of drugs sold every day. The datum column consists of the date when the drug was sold. The M01AB to R06 column headings denote the names of the drugs. It also consists of Year, Month, Hour, and Weekday Name values for each day the drug was sold.
We will use these two files to create two forecasting models to forecast the sale of a drug. The first one will be an hourly forecast, and the second one will be a daily forecast. To complete the exercise, proceed to execute the Jupyter notebook by following the steps in the next section.
Running the Jupyter notebook
The notebook for this exercise is saved on GitHub here: https://github.com/PacktPublishing/Applied-Machine-Learning-for-Healthcare-and-Life-Sciences-using-AWS/blob/main/chapter-10/pharma_sales_forecasting.ipynb.
The repository was cloned as part of the steps in the Technical requirements section. You can access the notebook from GitHub by following these steps:
- Open the SageMaker Studio interface.
- Navigate to the Applied-Machine-Learning-for-Healthcare-and-Life-Sciences-using-AWS/chapter-10/ path. You should see a file named pharma_sales_forecasting.ipynb.
- Select New Folder on the top of the folder navigation pane in SageMaker Studio, as shown in the following screenshot:

Figure 10.3 – SageMaker Studio UI showing the New Folder button
- Name the folder data. Next, click the Upload Files icon on the top of the navigation pane in SageMaker Studio, as shown in the following screenshot:
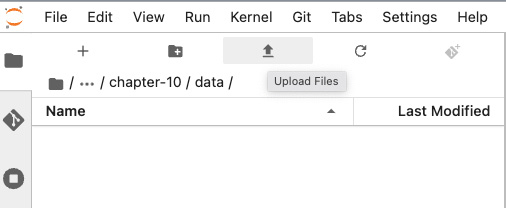
Figure 10.4 – SageMaker Studio UI showing the Upload Files button
- Upload the saleshourly.csv and salesdaily.csv files that you downloaded previously to the data folder.
- Go back one folder to Chapter-10 and click on the pharma_sales_forecasting.ipynb file. This will open the Jupyter notebook. Follow the instructions in the notebook to complete the exercise.
At the end of the exercise, we will have generated forecasts from two models for hourly and daily intervals.
This concludes our exercise. Please make sure you stop or delete your Amazon Forecast resources to avoid incurring charges, as described in the following link: https://docs.aws.amazon.com/forecast/latest/dg/manage-resources.html.
Summary
In this chapter, we learned about the pharmaceutical supply chain industry, the different entities involved, their roles, and the challenges that the industry faces today. We also learned about pharmaceutical sales and how pharma sales reps work to increase awareness and knowledge about their products. We looked at how ML is influencing the pharmaceutical supply chain industry by looking into common applications of ML in pharmaceutical supply chain and sales. We then learned about Amazon Forecast and its various features to create simple and complex forecasting models. Lastly, we used Amazon Forecast to build a pharmaceutical sales forecasting model.
In Chapter 11, Understanding Common Industry Challenges and Solutions, we will get an understanding of the challenges that the healthcare and life sciences industry faces when utilizing ML. We will also look at how to solve some of those challenges and adhere to regulatory requirements in the healthcare and life sciences industry.