Chapter | six
The dB Concept
CHAPTER OUTLINE
From dB to Power or Amplitude Ratio
When sound levels have to be specified, it is practical to do so in a manner that corresponds to the way in which the ear perceives them. Human hearing is approximately logarithmic with respect to the perception of both level and frequency. Logarithmic growth means that there is a constant proportion between the individual steps on the scale. For example, if 1 W is first imparted to a loudspeaker and then followed by 2 W, this will be experienced as a given step in perceived level. In order to experience an equivalent change of level again, not 3 W, but, rather, 4 W must be added – and 8 W for the next step. Here, there is a ratio of 2 between the individual steps.
In the calculation of dB, the base 10 logarithm is used. The base 10 logarithm of a number is that number which 10 must be raised to in order to give the number itself. Hence the logarithm of 100 = 2, because 102 = 100. Originally, the logarithm of the ratio between two power measurements was used (the Bel unit). Later, a tenth of this became preferred (the deciBel unit, abbreviated as dB).
In the calculation of dB, the base 10 logarithm is used. The base 10 logarithm of a number is that number which 10 must be raised to in order to give the number itself. Hence the logarithm of 100 = 2, because 102 = 100. Originally, the logarithm of the ratio between two power measurements was used (the Bel unit). Later, a tenth of this became preferred (the deciBel unit, abbreviated as dB).
The advantages of the dB unit are that large ratios can be described with the use of a maximum of 3 digits, and changes in a sequence will be the same throughout, expressed in terms of dB, regardless of whether the unit of measurement concerned is the volt, ampere, watt, and so on.
We will first look at the dB value for the ratio between the measurements of power. Power is measured in watts, so this transformation will apply to everything that can be measured in watts, in the form of acoustic as well as electrical power (this transformation will thus not apply to amplitude values such as sound pressure, current, or voltage).
dB–POWER RATIO
The ratio between two measurements of power is expressed in the following manner:
where
P0= the reference (i.e., the value against which the comparison is being made)
P1= the relevant value to be specified
Example: I have a new amplifier. The old one was rated at 100 W, and the new one at 200 W. What is the difference in dB?

The answer is that there is 3 dB more power in the new amplifier as compared to the old one.
dB–AMPLITUDE RATIO
The ratio between two amplitude values (for example sound pressure, current, or voltage) is expressed in the following manner:
where
a0 = the reference (i.e., the value to be compared against)
a1 = the relevant value to be specified
This expression can be reduced as the squaring is changed to multiplication when the logarithm is extracted:
Example: The input sensitivity of my amplifier is 0.775 V. The signal out of my mixer is only 0.3 V. What is the ratio expressed in dB?

The signal is –8.2 dB in relation to the input sensitivity. In other words, the signal is 8.2 dB below the level needed for full modulation of the amplifier.
Note that the dB value is positive when the ratio is above 1 and negative when the ratio is less than 1.
FROM dB TO POWER OR AMPLITUDE RATIO
One can calculate backwards from dB to power measurement ratios as follows:
Power ratio = 10(x [dB] /10)
Similarly, calculate backwards from dB to amplitude ratios as follows:
Amplitude ratio = 10(x [dB]/20)
Example: The sensitivity of a microphone in a catalog is stated as –56 dB re 1 V. What does that correspond to in terms of voltage?

The result must be multiplied by the reference, which is 1 V.
The answer is thus 1.58·10−3·1 [V], which is 1.58·10−3 V or 1.58 mV
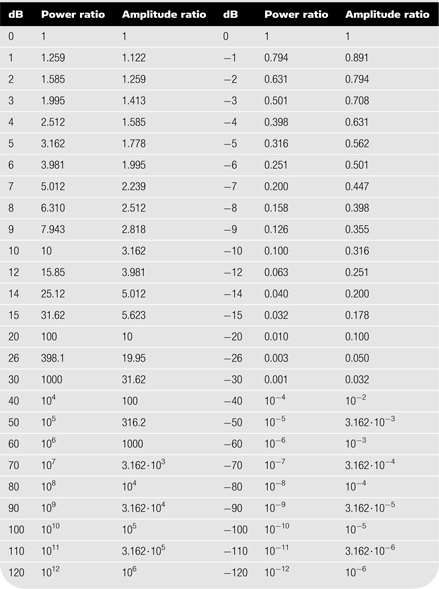
CONVERSION TABLE
Table 6.1 shows the conversion between power measurement ratios and dB as well as amplitude ratios and dB.
REFERENCE VALUES
In acoustics and electronics, specific reference values are used as a basis for the specified ratio in dB. In certain cases, the reference is stated directly, for example in the specification of sound pressure level: 60 dB re 20 μPa. This means that the sound pressure is 60 dB over 20·10−6 pascal, which equates to a sound pressure of 0.02 pascal.
Instead of specifying the reference in full, in some situations one or more letters can be appended after the “dB” to indicate the reference. Following are some examples of this usage:
dBμ: Reference relative to 1 μW (microwatt)
dBd: Antenna gain in relation to a half-wave dipole
dBFS: For digital equipment (reference to “Full Scale”)
TABLE 6.1 Convertion Between Power Ratios and Amplitude Ratios
dBi: Antenna gain in relation to omnidirectional antenna
dBk: Reference relative to 1 kW (kilowatt)
dBm: Reference relative to 1 mW (milliwatt) imparted at 600 ohm (often used incorrectly for the reference relative to 0.775 V RMS)
dBm0: Absolute power level (re 1 mW/600 ohm) at a point of 0 relative level
dBm0p: Absolute psophometric (frequency-weighted) power level re 1 mW/600 ohm at a point of 0 relative level
dBm0ps: Absolute psophometric (frequency-weighted) power level re 1 mW/600 ohm for a point of 0 relative level for program transmission (sound)
dBm0s: Absolute power level re 1 mW/600 ohm for a point of 0 relative level for program transmission (sound)
dBp: Reference relative to 1 pW (picowatt)
dBq0ps: Absolute and weighted voltage level re 0.775 V for a point of 0 relative level for program transmission (sound).
dBq0s: Absolute and unweighted voltage level re 0.775 V for a point of 0 relative level for program transmission (sound).
dBr: Relative specification in relation to an arbitrary reference, which must then be stated
dBrn: Relative specification in relation to noise floor; used in telecommunications
dBrs: Relative specification in relation to sound program level
dB SPL: Sound Pressure Level, with the reference 20 μPa
dBTP: (True Peak) Reference relative to the true peak of a signal.
dBu: Reference relative to 0.775 V RMS (in general the effective voltage that must lie over a resistance of 600 ohm in order for a power of 1 mW to be imparted); dBu is often used incorrectly for the reference relative to 1 μW
dBu0: Absolute voltage level re 0.775 V for a point of 0 relative level
dBu0s: Absolute voltage level re 0.775 V for a point of 0 relative level for program transmission (sound)
dBuv: American, reference relative to 1 μV
dBuw: American, reference relative to 1 μW
dBv: Often used in American data sheets for dBu (see dBu)
dBV: Reference relative to 1 V (volt)
dBW: Reference relative to 1 W (watt)
OTHER RELATIVE UNITS
VU: Understood as Volume Unit; used in audio metering. The change of 1 VU is a change of 1 dB. 0 VU has different definitions; however +4 dBm is commonly used. (See Chapter 12 on Standard Volume Indicator.)
LU: Loudness Unit; used in audio metering. Expresses the loudness of the program based on the electrical signal using frequency weighting (RL2B weighting, also called K-weighting) and by combining the level of all active channels to one single measure. Changing the level by 1 LU is a change of 1 dB.
Phon: Loudness unit, acoustic measure; equal to the sound pressure in dB re 20 μPa of an equally loud 1 kHz tone.
Sone: Measure of subjective loudness. One sone corresponds to 40 phons. A doubling/halving of the sone value corresponds to 10 phons (for example 2 sones equate to 50 phons).
Neper (Np): Used by the telephone companies.
1 Np = (20 lg e) dB ~ 8.686 dB.
1 dB = (0.05 ln 10) Np ~ 0.1151 Np.
WEIGHTED MEASUREMENTS
dB(A), dB(B), dB(C), dB(D) and dB(Z): These designations do not refer to a specific level, but rather to the fact that the signal has been measured with an inserted frequency weighting filter.
ADDITION OF dB
In order to find the total magnitude of two acoustic sound levels specified in dB the starting point will normally be that the two sound sources are not correlated (i.e., either the two signals do not resemble each other or they were recorded in a diffuse sound field). In practice, it is only in the near field between two loudspeakers that are reproducing the same sound where this condition would not be fulfilled.
The total sound level is calculated according to the following expression:
Example
What is 84 dB + 90 dB?

Nomogram (Addition)
One can avoid the work of performing the calculation by using a nomogram instead.
The difference is found between two sound levels (from the above mentioned example: 90 dB − 84 dB = 6 dB). This number is located on the horizontal axis. Then the vertical line is followed to the curve, after which you move horizontally to the left where the value 1.0 dB can be read. This value is then added to the highest level, which was 90 dB. The result is then (90 + 1.0) = 91.0 dB.

FIGURE 6.1 Nomogram for the addition of sound levels. The addition is performed on an energy basis and applies for uncorrelated sound sources (the sounds from the sources are different from each other) or sound sources in diffuse sound fields.
As the nomogram shows, two equally strong sound sources together would comprise a level that is 3 dB louder than the individual source. In practice, if the difference between the two sources is more than 10 dB then the weakest one can be ignored.
SUBTRACTION OF dB
Subtracting one sound level from another is related to the calculation of uncorrelated acoustic sound sources. This is calculated in the following way:
Example:
The noise level Lp1 in a server room is 60 dB re 20 mPa. What is the level when one server having a noise level Lp2 of 57 dB re 20 mPa is removed from the room?
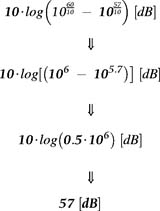

FIGURE 6.2 Nomogram for the subtraction of sound levels. The subtraction is performed on an energy basis and applies for uncorrelated sound sources (the sounds from the sources are different from each other) or sound sources in diffuse sound fields.
Thus the result is that the noise level is 57 dB re 20 μPa after removing one noise source.
Nomogram (Subtraction)
As with addition, subtraction can be performed using a nomogram.
The difference between the two sound levels is found (from the above mentioned example: 60 dB – 57 dB = 3 dB). This number is located on the horizontal axis. Then the vertical line is followed to the curve, after which you move horizontally to the left where the value −3 dB can be read. This (negative) value is then added to the highest level, which was 60 dB. The result is then (60 + (−3)) = 57 dB.
Notes
- A change of 1 dB is only just audible.
- A change of 3 dB is a clearly audible change.
- A change of 10 dB corresponds to a subjective doubling of the perceived sound pressure level.
- The addition of electrical and acoustic signals is covered later in Chapter 22 on summation of audio signals.