Chapter | twenty-six
Spectrum Analyzer
CHAPTER OUTLINE
In the analysis of sound, it has always been important to be able to describe the frequency content of a signal. The traditional method is to use a filter bank, containing a number of filters with relative bandwidths, for example 1/1 octave, 1/2 octave, 1/3 octave, or perhaps with narrower bandwidths depending on the purpose. The signal being filtered passes through one filter at a time. Once the signal for a filter has been detected and its value read or printed, the next filter is reviewed.
A more practical variant is the parallel analyzer, where each filter has its own detector. With this, the values can be read simultaneously in all frequency ranges. A basic sketch is shown below of the parallel analyzer, in which the same signal is run to many filters simultaneously.
1/1 OR 1/3 OCTAVE
Filters with a relative bandwidth are used when what is being measured must be heard, since the ear also perceives frequencies logarithmically. In many control rooms and PA systems, it is normal to use analyzers based on 1/3 octave. By doing so, frequency responses can be measured for loudspeaker systems, etc.

FIGURE 26.1 Principles of the parallel analyzer. The filters have a relative bandwidth, for example 1/3 octave.

FIGURE 26.2 The measurement of a room’s reverberation time can be performed by recording a shot in the room concerned. The decay is subsequently analyzed in octave bands. A time picture of a shot appears at the top. At the bottom, the decay is shown after the signal has been demodulated and made logarithmic.
In building acoustics, it is the case however that the absorption coefficients for materials are specified for each 1/1 octave. Hence it would be relevant to measure the reverberation time of a room in octaves. Alternatively, an average of the values in three 1/3 octaves can be calculated to obtain the octave value.
When measuring noise that is to be specified as noise rating (NR) or noise criterion (NC) curves, the analysis is always performed in 1/1 octave.
ANALOG OR DIGITAL
Now that digital technology has become common, analog filters by and large have not been made for measurements. Most of the filters used for these purposes today are based on FFT analysis, which is subsequently converted from a fixed to a relative bandwidth. It should also be mentioned though that information is not lost between the individual columns or “sticks” seen in FFT analysis. The areas between the frequencies are also taken into account.
One can, however, find octave or 1/3 octave analyzers that have two filter slopes to work with: one corresponds to the ISO standard for measurement filters, whereas the other represents the state of the art with much sharper filters that are obtained digitally as compared to standard filters defined in an analog manner.
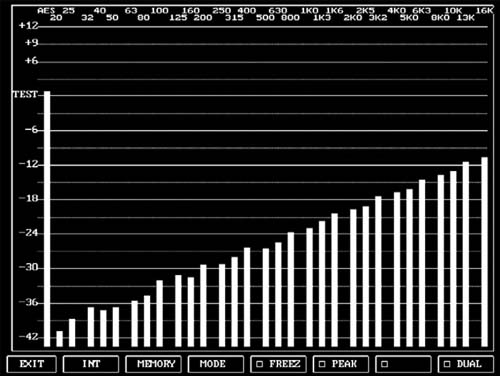
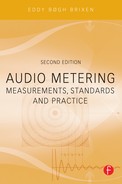
FIGURE 26.3 The spectrum for white noise analyzed in 1/3 octaves is shown here. White noise has constant energy per Hz. However, the filters have a constant relative bandwidth. This means that the individual frequency range covers more Hz the higher it lies in the frequency range. The column on the left shows the total level.
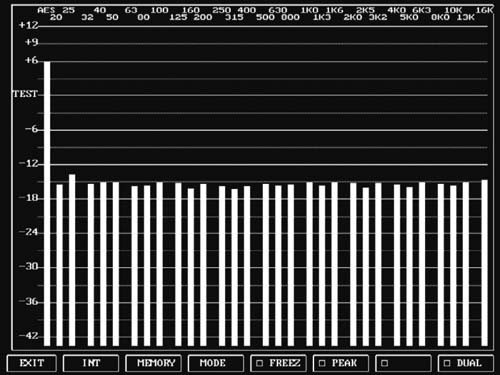
FIGURE 26.4 The spectrum for pink noise analyzed in 1/3 octaves is shown here. Pink noise has constant energy per octave; hence the horizontal curve made by the columns. The column on the left shows the total level.
FIGURE 26.5 Analysis of a 1000 Hz sinusoid using a 1/3 octave analyzer. This bandwidth is obtained using a conversion from an FFT spectrum. Regardless of whether computed FFT filters or analog filters are involved, there will always be “skirts” on the analysis when pure tones are analyzed.