Chapter | four
Signal Types
CHAPTER OUTLINE
Acoustic Measures of Musical Instruments
Sound is pressure that varies over time. Represented in electrical form, it is voltage or current that varies over time. This means that every sound – regardless of how many frequencies it might contain – can be described by a signal’s variation in time or waveform. Some of the more typical waveforms and their frequency content are discussed in this chapter.
PURE TONES
Pure tones are characterized by a sinusoidal waveform (see Figure 4.1). These are periodic signals that contain one and only one frequency. In practice, pure tones almost always occur as test signals only.

FIGURE 4.1 A pure (sinusoidal) tone contains one and only one frequency.
COMPLEX TONES
Complex tones are periodic signals that are based on a fundamental frequency with associated harmonic overtones. These signals are, among other things, characteristic of musical instruments. In musical contexts, overtones are referred to as partials or harmonics. When one refers to the frequency of a tone, what they are actually referring to in reality is the frequency of the fundamental frequency.

FIGURE 4.2 Five pure tones are shown here, corresponding to a fundamental tone, the associated second harmonic overtone (with an amplitude = 1/2 $ the fundamental tone), a third harmonic overtone (with an amplitude = 1/3 $ the fundamental tone), a fourth harmonic overtone (amplitude = 1/4 $ the fundamental tone), and a fifth harmonic overtone (amplitude = 1/5 $ the fundamental tone). At the bottom, these five pure tones are combined. The waveform approximates a saw tooth waveform. Note that all the curves here start at 0°. If the phase relationship (the phase angle) were different, then the resultant waveform would also have a different appearance.
The frequency of the harmonic overtones will be integer multiples of the frequency of the fundamental tone. If the fundamental tone is 100 Hz, then the second harmonic (second overtone) would be 200 Hz, the third harmonic 300 Hz, the fourth harmonic 400 Hz, etc.
SPECIAL WAVEFORMS
Among the periodic waveforms, there are typical waveforms such as a sinusoid, saw tooth, triangular, square, and pulse train (or pulse string). All of them have more or less characteristic frequency content.
The saw tooth wave is characterized by the fact that it contains the fundamental frequency and all harmonics in a specific proportion (the second harmonic has half the amplitude of the fundamental, the third harmonic has a third the amplitude of the fundamental, etc.).
The square wave is characterized by the fact that it contains the fundamental frequency and all the odd numbered harmonics in the same declining proportion as the saw tooth wave.
The square wave is known from, among other places, electro-acoustic equipment that is overloaded and thus “clips” the peaks off the signal. This is called harmonic distortion. The magnitudes of the harmonic overtones created are stated in relation to the fundamental tone and are expressed as percentages (i.e., total harmonic distortion (THD) equals xx%).

FIGURE 4.3 Special waveforms: Sawtooth, triangular, square and pulse train.
NOISE SIGNALS
Those signals for which no sensation of tone occurs are called noise. These are characterized by, among other things, all frequencies in a given range of frequencies being represented. Some well-defined electrical noise signals belong to this group, and are used as test signals:
White noise is a signal that contains constant energy per Hz bandwidth.
Pink noise is a signal that contains constant energy per octave (or 1/3 octave). The amplitude follows the function 1/f, which corresponds to it diminishing by 3 dB per octave or 10 dB per decade.
Brown noise is a signal where the amplitude diminishes by 1/f2, corresponding to 6 dB per octave or 20 dB per decade.
Real noise signals such as traffic noise or ventilation noise can, in addition to broadband noise, also contain audible tones. The spectral distribution may show that the primary content is found in a specific part of the frequency spectrum. For example, ventilation noise contains a primary content of low frequencies, and compressed air noise has a primary content in the high frequencies. Noise signals can also be a part of the sound of musical instruments, for example the “resin sound” of the strings or the air noise of various wind instruments.

FIGURE 4.4 Waveforms of white, pink, and brown noise (1-second excerpts).
THE VOICE AS A SOUND SOURCE
It is important to understand the characteristics of the sound of voice. While language can be something that groups of people have in common, the sound and character of the voice is unique from person to person. Our familiarity with speech, regarded as an acoustic signal, allows us to have a good reference as to how it should sound.
Sound Level
The level of the voice can vary from subdued to shouting. This level is naturally individual from person to person and thus difficult to assign a number to. The values in Table 4.1 represent the average sound level of speech of an adult.
The ability to understand speech is optimum when the level of the speech corresponds to normal speech at a distance of 1 meter, in other words a sound pressure level of approximately 58 dB re 20 mPa. (“re” means “with reference to.” Here, it is with reference to the weakest audible sound pressure level. See Chapter 6 on dB.)
The Spectrum of Speech
The spectrum of speech covers a large part of the total audio frequency range. Speech (Western languages) consists of vowels and consonant sounds. The voiced sounds in speech are generated by the vocal chords and then influenced by the resonances of cavities they pass through. Speech can be regarded as a fundamental frequency with a large number of harmonics. A whisper does not contain voiced sounds; however, the cavities that contribute to the formation of the different vowels will still act on the passing flow of air. This is how the characteristics of vowels may occur in a whisper.
TABLE 4.1 Average Speech Level as a Function of Listening/Recording Distance. There is an Approximately 20 dB Difference Between Normal Speech and Shouting.

In general, the mean value of the fundamental frequency – also called the pitch or f0 – is in the range of 110–130 Hz for men, and approximately one octave higher at 200–230 Hz for women. In both cases values outside these ranges occur. For children, f0 lies at around 300 Hz. The individual deviation from the base frequency is higher in tone languages (like Chinese) than in European languages like English or German. Also, the mood of the speaker affects the pitch.
The consonants are formed by air blockages and noise sounds created by the passage of air in the throat and mouth, and particularly the tongue and lips. In terms of frequency, the consonants lie mostly above 500 Hz.
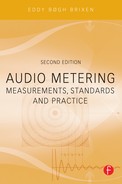
At a normal vocal intensity, the energy of the vowels normally diminishes rapidly above approximately 1 kHz. Note, however, that the emphasis in the speech spectrum shifts one to two octaves towards higher frequencies when the voice is raised. One should also note that it is not possible to increase the sound level for consonants to the same extent as for vowels. In practice this means that the intelligibility of speech is not increased by shouting in comparison to using a normal voice assuming the background noise is not significant. It is also worth knowing when recording speech that the speech spectrum changes with distance and angle.
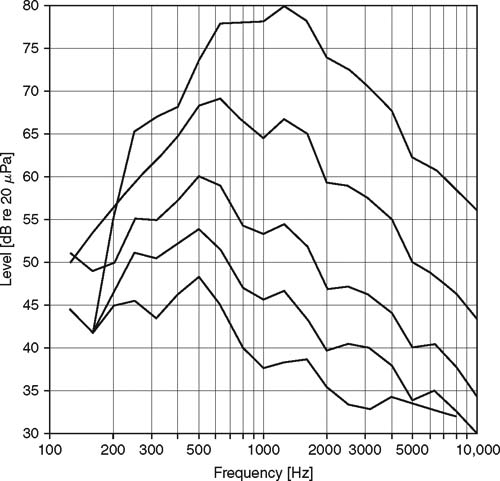
FIGURE 4.5 Male voices: Average 1/3-octave spectra for various levels of speech. Note that the energy is moved towards higher frequencies as the sound level of the voice is gradually increased.

FIGURE 4.6 Female voices: Average 1/3-octave spectra for various levels of speech.
Formants
If one listens to two or more people who are speaking or singing the same vowel at the same pitch (f0), the correct vowel is presumably recognized in all cases, although there will be a difference in terms of timbre.
The characteristics of the individual vowels are formed by the acoustic filtering of the signal from the vocal chords. The result is a number of formants, i.e., frequency ranges that are particularly prominent, which give the sound of the vowels, more or less regardless of the pitch of the voice. This sound-related formation of vowels is something that is fundamentally learned by the talker. In contrast, there will be frequency-related characteristics in the formant ranges of individual voices that are due to the individual anatomical differences from person to person. These differences are, along with other phenomena such as intonation, part of what makes it possible to differentiate one voice from another.

FIGURE 4.7 The position of the tongue is shown here for four vowels.

FIGURE 4.8 Placement of the formants for different vowels in English. The formants are marked from the bottom (lowest frequency) as 1st formant, 2nd formant, and 3rd formant.
Crest Factor
The crest factor expresses the relation between the peak level and the RMS level (see Chapter 5). The consonants can have relatively strong peaks, but limited energy content when viewed over a longer period of time. One can convince oneself of this by comparing the amplitude reading on a fast meter like TP (true peak) or PPM (peak programme meter) and a slower meter like VU (volume indicator) or LU (loudness unit), respectively. The crest factor is typically 10–15 (20–23 dB). This has significance when a voice is recorded or reproduced in an electro-acoustic system.
MUSICAL INSTRUMENTS
The sound of a musical instrument can be characterized by parameters such as pitch, tone, timbre, range of harmonics, overtones, attack, decay, and formants.
Tone
The tone of a musical instrument essentially consists of a fundamental frequency and a number of harmonics and overtones/partials. Characteristic noise sounds are added to this base.
The magnitude of the fundamental frequency may be very small compared to the rest of the spectrum. However, due to ears’ ability to define the fundamental frequency based on the interval between harmonics the pitch is in general correctly perceived. It is important to distinguish between the definition of harmonics and overtones or partials when looking at the the acoustics of musical instruments. Harmonics are always a mathematical multiple of the fundamental frequency. However, overtones are not always necessarily harmonic; in this case they are called inharmonic overtones.
Depending on the type of instrument the tone will be characterized by attack and by decay. Each partial may actually have different attack and decay patterns. Percussion instruments do not normally exhibit a sustained tone; however, by the stroke a resonance is excited.

FIGURE 4.9 The spectra of three different notes on the bassoon. At the lowest note the fundamental frequency is almost not present. Notice the formant range, 300e600 Hz.

FIGURE 4.10 The build up, attack, and decay of individual harmonics (piano).
The noise that is attached as a part of the characteristic sound is common for almost all musical instruments. Examples of this are the sound of the air leakage on the mouthpiece, the sound of resin on the bowed string, and the sound of different instruments’ moving mechanical parts.
Like the voice, many musical instruments also have formants, which are related to the physics of the instruments. For instance a bassoon consists of a tube of a given length. This “pipe” provides a natural emphasis of a given frequency range, in this case around 300–600 Hz (see Figure 4.9). No matter which note is played, the harmonics within this frequency band are always the strongest. The specific formants are regarded as the typical range of the instrument when filtered in a complex down-mix in order to avoid “mud” in the mix but still keep the characteristics of the individual instruments. In addition to the characteristics of the instrument itself, the musicians’ personal style and playing techniques also obviously play a role.
ACOUSTIC MEASURES OF MUSICAL INSTRUMENTS
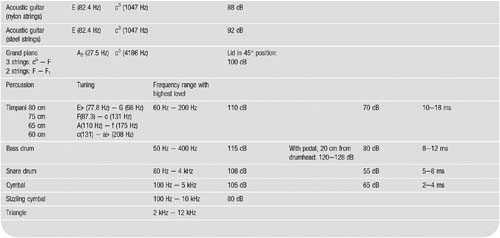
Table 4.2 contains some acoustical characteristics for a selection of musical instruments.
TABLE 4.2 Acoustical Properties of Musical Instruments


Bibliography
Brixen, E. B. (1998). Near field registration of the human voice: Spectral changes due to positions. 104, Amsterdam, The Netherlands: AES Convention. Preprint 4728>.
Dickreiter, M. (1989). Tonmeister technology. New York: Temmer Enterprices, Inc>.
Fletcher, H. (1953). Speech and Hearing in Communication. New York: Van Nostrand>.
Olson, H. F. (1952). Musical Engineering. New York: McGraw-Hill Book Company, Inc>.
Pawera, N. (1981). Microphones. Dachau: Arsis Baedeker & Langs Verlag GmbH.>
Traunmüller, H. and Eriksson, A. (1995). The frequency range of the voice fundamental in speech of male and female adults. Manuscript. Stockholms Universitet.