Chapter | eighteen
Polarity and Phase Reading
CHAPTER OUTLINE
Goniometer – Audio Vector Oscilloscope
In the production, recording, and transmission of stereo signals, it is not just the levels of the signals in relation to each other that need to be monitored, but also the polarity or phase relationship between them. This chapter describes some important instruments that are used for this purpose.
POLARITY
Polarity is a question of the audio signals being “in phase” or “out of phase,” meaning the positive parts of the waveform become negative and the negative becomes positive. If only looking at – or listening to – one channel (mono) audio being 180° out of phase, it is not always recognized as a problem. However, in professional audio no phase inversion should be accepted if not done on purpose.
Looking at the waveform of two channels the “out of phase” situation corresponds to only one of the two channels being inverted.
In analog audio this polarity problem is an error far more common than one would imagine. In loudspeaker manufacturing a very high proportion of units are actually born with reversed polarity by inadvertently swapping the voice coil leads on the soldering terminals. It is easy to go wrong in the soldering of connectors, patch bays, etc. Most power amplifiers retain polarity of the signal from input to output; however, others do not. So just having different amp brands powering the speaker systems may cause problems.
All equipment should retain the polarity from input to output. To check this, a number of devices of varying levels of sophistication are available. Basically a DC impulse (an impulse only deflecting in only one direction) is generated acoustically when including a microphone in the audio chain or electrically for the microphone or line inputs. The receiver detects the direction of the impulse electrically on the output or acoustically if the loudspeaker is included in the audio chain. The readout is basically an LED display indicating whether the received signal is in phase or out of phase when compared with the transmitted signal.
Please note that in some two-way or three-way loudspeaker systems the midrange speaker may be measured as being out of phase. This is due to the crossover technique if using 2nd order (12 dB/octave) filters. At the crossover frequency the phaseshift is +90° in one filter and –90° in the other. In order to make the loudspeaker units work together at this point the signal to one of the speakers is reversed.
THE PHASE METER
This instrument is used for stereo recording and monitoring. It has a scale ranging from “+1” to “–1” to show the current phase difference between the signals in the left and right channels. Instead of giving the phase angle in degrees, it displays the cosine of the phase angle (the phase difference).

FIGURE 18.1 The cosine function is shown here. When the phase angle between left and right is 0° the cosine is +1. When the phase angle is 180° the cosine is -1.
The cosine of an angle of 0° is +1.
The cosine of 90° is 0.
The cosine of 180° is –1.
If the left and right signals are completely in phase (i.e., the phase angle is 0°), then the instrument indicates “1.”
If the signals are completely out of phase (i.e. the phase angle is 180°), then the instrument indicates “–1.”
If the phase angle is 90°, the instrument indicates “0.”
If there is only a signal in one of the channels, then the instrument will also display “0” since this position is the neutral position.
When stereo signals are being recorded, the indication should normally lie between “0” and “1.”
Integration Time
Normally, the instrument is equipped with a relatively long integration or averaging time, typically 600 ms; this means that a slow indication is given, but it is still fast enough to show the phase relationship of varying signals at low frequencies.
FIGURE 18.2 The scale of the correlation or phase meter is shown above. It has values from +1 to –1.
Phase meters are normally used to assess recordings for gramophone records, where reversed phase at lower frequencies can be synonymous with the stylus just about having to leave the surface of the record if no compensation is performed. The instrument is, however, also used in all types of multichannel productions – in particular, for the production of multimedia sound files, especially when the audio is played back through matrix systems that generate multi-channel audio on the basis of two channels. When the instrument reads values below 0 the audio disappears into the rear channel.
GONIOMETER – AUDIO VECTOR OSCILLOSCOPE
The goniometer or “audio vector oscilloscope” is an instrument that can give a detailed picture of the relationships in a stereo signal – or between two arbitrary signals. The idea behind the instrument was developed by Holger Lauridsen, the Chief Engineer at Danmarks Radio in the 1940s and early 1950s. It involves an oscilloscope with one input being used for the X-deflection and the other input for the Y-deflection.
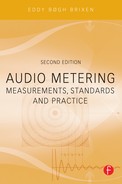
In comparison with a normal oscilloscope, the image is rotated by 45°. This means that, when the same signal is applied in the left and right channels (X and Y) it leads to a vertical deflection (a vertical line); if the signals are otherwise identical but in opposite phase, then a deflection will occur in the horizontal plane (horizontal line). When the signals are different, the display changes from straight lines to spatial figures. What is ingenious about the instrument is that it can show many different parameters in the stereo signal simultaneously.
As long as the major portion of the display lies within ±45° in relation to the vertical axis, then there is a high degree of mono compatibility. When the curves begin to bend at the top and bottom, it can indicate nonlinearity in the relationship between the two channels. This can arise if overloading or limiting is occurring in only one channel. It can stem from time delays between the channels that may arise in older digital systems or tape units.

FIGURE 18.3 The stereo signal is wide, but there is still a high degree of mono compatibility. Regarded as optimum.
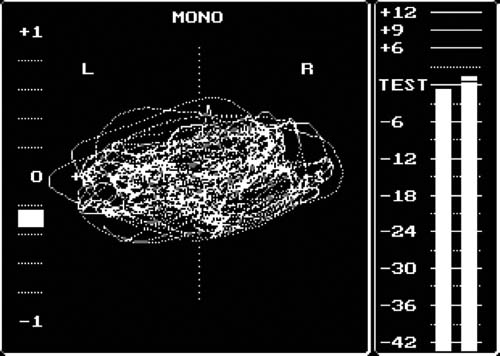
FIGURE 18.4 The stereo signal is too wide. The mono compatibility is small, i.e., some of the signal will disappear in mono.

FIGURE 18.5 The stereo signal is too wide. The mono compatibility is small, i.e., some of the signal will disappear in mono.

FIGURE 18.6 Signal only in the right channel.

FIGURE 18.7 Almost a pure mono signal in the two channels.
FIGURE 18.8 Almost a pure mono signal, but in opposite phases in the two channels.
SPECTRAL PHASE DISPLAY
This display is developed as a special analysis tool for digital audio workstations. It shows the phase difference, in degrees, between the left and the right channels recorded. Due to the various display colors frequency selective readings are possible. Hence it is possible to distinguish the phase of complex twochannel signals. The horizontal axis is time. The vertical axis is the phase (+/–180°), with 0° in the middle. As mentioned, the colors can be defined for different ranges of the frequency spectrum. See the Figures 18.3–18.8 for practical applications of this display.

FIGURE 18.9 This spectral phase display show three sets of microphones recording an organ in a small 12th century church. The first part is a mono (omnidirectional) microphone, the second part shows the phase distribution of a MS setup placed further away. The third microphone setup is a reversed XY setup. The fourth part show all three setups recorded simultaneously. This was created in Adobe Audition 3.

FIGURE 18.10 In this case the display is used for phase comparison between an extracted ENF-component (electric network frequency) and a fixed reference. This analysis is performed for authentication of digital recordings in the field of audio forensics; this was created in Adobe Audition 3.