The GNU debugger is gdb
. It was written and is maintained by
the Free Software Foundation. gdb is a powerful
tool for looking inside a running program and trying to figure out
why that program is not behaving as expected. Apple has modified
gdb to be aware of Objective-C syntax and
objects, and to work together with the PB and Terminal applications.
The gdb tool is located in the directory
/usr/bin. If you
click the Computer icon in the Finder’s toolbar and
then select Macintosh HD, you will not see /usr
listed.
Mac
OS X and the Finder hide many system details from the user, including
Unix system directories such as /usr/bin,
/bin, and /etc. You can
view these directories in the Finder using the Go to Folder sheet,
but you cannot see all directories in the Finder (e.g., the
.app directories are hidden). You can, however,
see all the filesystem directories in a Terminal shell — your
vehicle for exploring the guts of Mac OS X.
The easiest way to use the gdb debugger is in
PB. We’ll show you how to get started with that in
this section. First, we must have an application to work with, so
we’ll use a copy of the CircleView example
application that is bundled with the Mac OS X developer system.
When you debug a running program within PB, you can access some of
the most useful gdb commands graphically. You
can set breakpoints by clicking the mouse next to a line of code (a
breakpoint is a place where a running program
stops executing and control is returned to the debugger). When a
breakpoint is reached in a running program, the stack frame and the
variables on the stack will be displayed in the debugger window. You
can also use the buttons on the upper-right side of the PB window to
control execution. The up and down arrows will step you up and down
the call stack. The arrow over the parenthesis will execute a
gdb step command. The pause button will pause
execution, and the button with the triangle will continue program
execution.
Let’s try a few of these commands on a real example:
Open the Go to Folder sheet in the Finder and enter “/Developer/Examples/AppKit”.
Copy the
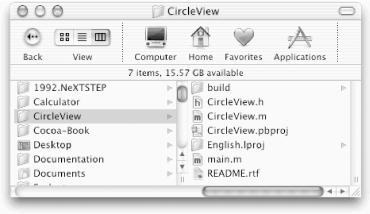
CircleViewfolder into your Home folder by Option-dragging the folder and dropping it on your Home icon. (If CircleView is not available, choose another example application in the same folder.)Click your Home icon and then click the
CircleViewfolder. You’ll see the files in the folder in column view, as shown in Figure 2-13.
Open the CircleView project in PB by double-clicking on the
CircleView.pbprojproject file in theCircleViewfolder.Click the build and run button above the Groups & Files pane in PB.
After a few seconds, the application will be built (compiled) and will run. The build and run button will turn into a stop button. The running CircleView application is shown in Figure 2-14.
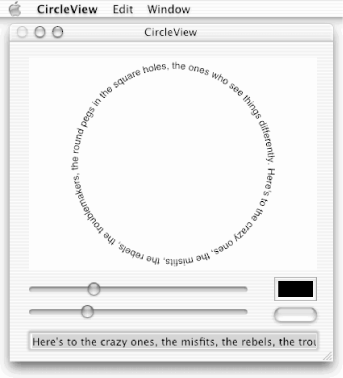
You can play with this fun little application by dragging the sliders, changing the text (try entering “Mac OS X”), changing the color, and clicking the nondescript button below the color well to animate the text.
Quit the CircleView application by clicking the stop button in PB’s toolbar (or quit CircleView directly).
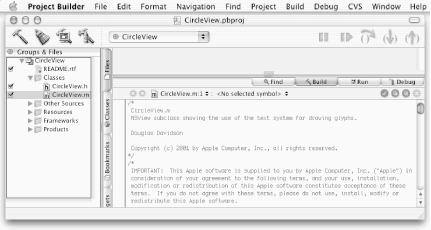
Back in PB, click the disclosure triangle next to Classes in the Groups & Files pane to see the
CircleView.handCircleView.mclass files.Single-click the
CircleView.mfile to open it in the lower-right pane in PB’s main window, as shown in Figure 2-15.
Press the up-down (“stepper”) arrows to the right of “<No selected symbol>” in the middle of the PB window, drag to “-setColor:”, and release the mouse button. This action takes you to the “-setColor:” method (like a function) in the
CircleView.mfile.Set a breakpoint by clicking the mouse in the white column to the left of “-(void)setColor:”. An arrow should appear, as in Figure 2-16.
In a moment we’ll run the CircleView program in
debug mode within PB. PB will run gdb in the
background and provide us with a nice graphical interface to many of
its commands. (If you want to see that gdb is
running in the background, look at your running processes in
ProcessViewer). We’ll test some of the graphical
commands available in PB, but first we’ll clean out
(remove) all of the derived build files in the project to ensure that
we start from scratch:
Clean the CircleView build files by clicking the clean active target (whiskbroom) button in PB’s toolbar. Click the clean active target (blue) button in the resulting sheet.
Now click the build and debug button in PB’s toolbar. The button displays a hammer and a bug spray can icon that turns into a stop button when the application runs.
The CircleView application should now be running in the foreground. Because we set the breakpoint at the setColor: method, we won’t reach it until we try to change the color.
Click the border of the color well in the CircleView window.
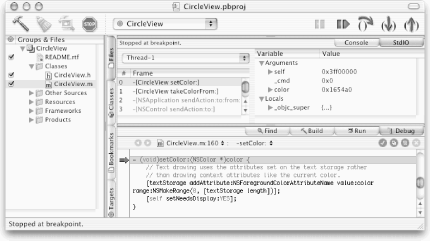
You might expect the Font window to appear, but it doesn’t because of the breakpoint. Your PB window should now look like the one in Figure 2-16. You can see the “Step into method or function call” button at the right of PB’s toolbar. This action executes one step (line of code). You can use it repeatedly to step through your program and debug it line by line.
Click the “Step over method or function call” button. This action steps out of the current method.
Click the “Continue execution” button. This action continues execution of the CircleView program.
Now reactivate CircleView, and the Font window will appear.
Quit CircleView.
PB made it easy for us to use gdb to debug
CircleView. Next, we’ll show you the
“hard” way, in a Terminal window.
You can run gdb directly in a Terminal window,
or from within GNU Emacs in a Terminal window. Either way, you must
specify the filename of the actual Mach executable file in the
/Contents/MacOS directory in the
“app wrapper,” rather than the
application directory itself (the directory that ends with
.app). Thus, to debug the program
CircleView.app with gdb at
the Terminal shell command line, type the text shown in bold below.
localhost>cd ~/CircleView/buildlocalhost>gdb CircleView.app/Contents/MacOS/CircleView...
gdb now starts up with about 10 lines of output.
Next, we’ll set the same breakpoint that we set
earlier, in PB (line 160 is where the setColor: method begins in
CircleView.m):
(gdb)b CircleView.m:160(gdb)help(gdb)quit
That’s enough to get you started. Now, to run
gdb from GNU Emacs, use the Emacs
command:[6]
M-X gdb <return>After this, Emacs will prompt you for:
Run gdb on file: /Users/mewhere /me is the user’s home
directory.
At this prompt, type the name of the file that you want to debug:
Run gdb on file: ~/CircleView/build/CircleView.app/Contents/MacOS/CircleViewThe advantage of using gdb from Emacs is that
Emacs will automatically split the screen into two windows, giving
you a gdb buffer in one and following the
program that you are debugging in the other. Many programmers find
this an effective way to work.
gdb is a complicated program with dozens of
commands. Fortunately, to get started you need to know only a few
basic commands.
Typically, when you are using gdb, you will set
a breakpoint and
then run your program until you reach that breakpoint. Your program
will then automatically stop running, and you will be free to inspect
the contents of the variables. Table 2-1 lists the
commands you would use to set breakpoints at a few sample locations.
To run your program, enter run in the Terminal
window. After your program reaches a breakpoint (or if your program
crashes), you will return to the gdb command
line. You can also interrupt your program’s
execution by typing Control-C. From the command line, you may find
the commands in Table 2-2 useful in debugging.
You can control program execution using the n
command in gdb to execute the next statement and
the s command to execute another step of your
program. The difference between these two commands has to do with how
they handle function calls. If the next statement to be executed is a
function call, the s command will step into the
function, whereas the n command will cause the
entire function to be executed and then stop the program. When you
are stopped within a program, the up command will
jump you up the call stack, while the down command
will take you down the call stack.
That’s enough of gdb for now.
Use gdb’s
help command to learn more.
[6] To type M-X gdb <return> into the Emacs editor, press the Esc key,
press the X key, type gdb, and press the Return or
Enter key.