7
Photoacoustic Imaging with Carbon Nanomaterials
Seunghyun Lee Donghyun Lee and Chulhong Kim
Pohang University of Science and Technology, Department of Creative IT Engineering, Republic of Korea
Chapter Summary
Photoacoustic imaging is a novel, noninvasive biomedical imaging modality that has evolved considerably over the last few decades. As a label‐free imaging modality using both endogenous and exogenous contrast agent it has shown many advantages to safely and effectively differentiate diseased tissue from healthy tissues at a deeper depth. While endogenous light‐absorbing objects in living subjects such as hemoglobin, melanin, and glucose, have been useful in imaging, the use of exogenous contrast agents can improve the detection sensitivity and specific tissue‐targeting capabilities of photoacoustic imaging modality further. The carbon nanomaterial has been found to be one of the best contrast agents for photoacoustic imaging, which has strong absorption properties and great biocompatibility. This chapter covers the basic introduction of photoacoustic imaging and the application of carbon nanomaterials contrast agent such as imaging‐guided therapy and multimodal imaging in photoacoustic imaging.
7.1 Introduction
In the field of biomedical imaging, high‐resolution volumetric optical imaging techniques have an important role in the diagnosis and treatment of diseases. However, due to strong photon scattering in a tissue, the penetration depth of these optical imaging modalities is limited to one optical transport mean free path (TMFP) in tissues (~1 mm in the skin). Photoacoustic (PA) imaging, however, overcomes this limited depth of penetration while maintain high‐resolution imaging by employing a hybrid imaging technique where acoustic waves induced by laser excitation on a target are detected and imaged for visualization. Utilizing the lower attenuation of acoustic waves compared to light in tissues, PA imaging has a much larger penetration depth, in tissues beyond optical diffusion limit of 1 mm. The penetration depth in PA image is several centimeters deep in tissues, e.g. 4–5 cm, and is limited by the depths to which photons can reach to generate acoustic waves.
Figure 7.1 shows the fundamental schematic of PA effects. A very short pulsed‐laser illuminates a target and the target absorbs light. This absorbed light energy is converted to thermal energy and results in pressure changes within the tissue. This pressure change within a tissue is proportional to the temporal change of temperature at the target. This pressure change leads to tissue volume expansion and contraction, resulting in broadband ultrasound wave being emitted. This ultrasound wave propagated through the medium by the tissue is detected by the ultrasound transducer to form depth‐resolved PA images (3D PA images).

Figure 7.1 Schematic of photoacoustic imaging. PA, PhotoAcoustic; US, UltraSound.
The PA wave generation and propagation begins with the initial PA pressure given by:
where p 0 is the local pressure rise, Γ is the Grueneisen parameter (dimensionless) indicating the PA efficiency of the absorber, η th is the rate at which light energy is converted into heat, F is the optical fluence (J/cm2 ), and μ a is the optical absorption coefficient. All the parameters in Eq. (7.1) directly influence the PA amplitude, thus the signal‐to‐noise ratio (SNR) in the image. Since the Grueneisen parameters, energy conversion rate and optical fluence are all constant parameters in the same tissue, the optical absorption coefficient of the target is a key factor in the PA image.
7.2 Photoacoustic Imaging Systems
Photoacoustic imaging systems are broadly categorized into two major categories: photoacoustic microscopy (PAM) and photoacoustic computed tomography (PACT). PAM has been studied widely with several scanning methods, optical beam delivery geometries, and optical‐ and acoustical‐ focusing methods [1–5]. The PAM typically uses a point‐by‐point raster scanning method using a single element transducer to acquire cross‐sectional B‐scan images and volumetric images. Thus, the PAM achieves a high resolution but the image acquisition time is relatively slow and depends on the pulsing rate of the PA excitation laser. The PACT, on the other hand, uses a multielement array‐type transducer and multichannel data acquisition boards (DAQs) to acquire data from multiple point simultaneously. Thus, the data acquisition time in PACT is much faster than PAM [6–9]. The PACT frame rate and imaging depth are much better compared to the PAM.
7.2.1 Photoacoustic Microscopy
PAM [10] images a target with a single‐element ultrasonic transducer and optical excitation focused in the quasi‐ballistic (typically≤1 mm in normal tissue) and quasi‐diffusive (1–10 mm) regimes. PAM creates a one‐dimensional image (A‐scan) for each point along Z‐axis where detected photoacoustic signals arrive at different times depending on the position of the target along depth. PAM creates a 2D axial image (B‐scan) by scanning along X‐Z axis and 2D traverse image by scanning along X‐Y axis to create a 3D depth‐resolved volume. PAM systems are categorized into two types: optical‐resolution PAM (OR‐PAM) [11, 12] and acoustic‐resolution PAM (AR‐PAM) [1, 13].
The OR‐PAM, shown in Figure 7.2a, provides high lateral resolution images with resolution ranging from few hundred nanometers to few micrometers with tighter optical focus than acoustic focus. The lateral resolution in OR‐PAM can be further enhanced by focusing the light with a high numerical aperture (NA) of the objective lens or by using a shorter optical wavelength excitation laser source. Because OR‐PAM is optimized for excellent lateral resolution, the penetration depth of OR‐PAM in tissue is limited to one optical TMFP (~1 mm). The OR‐PAM has been used in a wide range of biomedical applications such as cellular structure imaging (Figure 7.2c), microvascular vasodilation, vasomotion, and oxygen saturation (sO2) mapping in mice ears, brains, and irises.
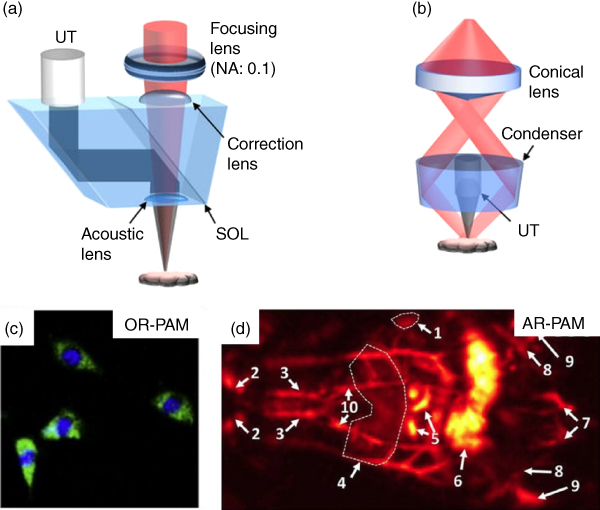
Figure 7.2 Typical examples of photoacoustic microscopy (PAM). (a) Reflection‐mode optical‐resolution photoacoustic microscopy (OR‐PAM). (b) Dark‐field acoustic‐resolution photoacoustic microscopy (AR‐PAM). (c) Unstained fibroblasts photoacoustic (PA) image superimposed at 422 and 250 nm using OR‐PAM. (d) Coronal (front) PA images processed along the Z‐axis at 850 nm. 1 spleen, 2 carotid artery and jugular vein, 3 subclavian vessels, 4 liver, 5 intestines, 6 cecum, 7 caudal vessels, 8 femoral vessels, 9 popliteal vessels, and 10 mammalian vessels.
Source: Figures reproduced with permission from [1, 10, 11].
Another form of PAM is AR‐PAM (Figure 7.2b). This system acquires the high‐resolution PA signals with much lower acoustic scattering in the tissue at depths that exceed the light diffusion limit. The AR‐PAM uses a conical lens and an optical condenser to deliver donut‐shaped light (dark‐field) to a target, where the acoustic focus is much tighter than optical focus and parallel acoustic detection. In AR‐PAM, the lateral and axial resolution and imaging depth can be determined by the center frequency and bandwidth of the ultrasound transducer used. The AR‐PAM has proven useful in deep‐tissue imaging (Figure 7.2d) due to much lower acoustic scattering. The deeper penetration depth and reasonable lateral resolution of AR‐PAM enable the visualization of hemodynamic changes in mice brains induced by electrical stimulations and the temporal changes in oxygenation alternating between high and low oxygen levels. AR‐PAM can also monitor the growth of melanoma cells in a tumor skin.
7.2.2 Photoacoustic Computed Tomography
PACT system displays tomographic images acquired using multielement ultrasound transducer and multichannel DAQs. Using the appropriate beam size and optical excitation power to cover the region of interest, a full‐field tomographic image of the sample can be acquired in real time with a single laser irradiation. Reconstruction algorithms such as filtered back projection algorithm, similar to the conventional X‐ray computed tomography (CT) system, would be required to reconstruct the image. PACT systems are classified based on the PA signal receiver geometry: (i) cylindrical detection [14, 15], (ii) planar detection [16, 17], (iii) spherical detection [18], and (iv) linear detection [19, 20]. In the next few paragraphs these systems are discussed briefly.
The cylindrical detection PACT system with a 512‐elements full‐ring array transducer with a central frequency of 5 MHz is shown in Figure 7.3a. One alternative to using a full‐ring array transducer is to use an arc array transducer [23]. With a 512‐channel preamplifier and parallel DAQs, this cylindrical detection PACT system acquires single‐impulse PACT image with a high spatio‐temporal resolution [23]. Thus, the developed system can acquire anatomical information and functional information, such as pulse wave of the arteries, oxygenation, and circulating melanoma cells in a mouse brain in real time, as shown in Figure 7.3b.


Figure 7.3 (a) Schematic of cylindrical detection photoacoustic computed tomography (PACT) system (b) Brain and lower abdominal cavity images. (c) Schematic of planar detection photoacoustic computed tomography (PACT) system. (d) In vivo mammalian tissue images in a mouse with a tyrosinase‐based genetic reporter. (e) Schematic of spherical detection photoacoustic computed tomography (PACT) system. (f) Photoacoustic (PA) mammographic images of healthy woman. (g) Schematic of linear detection photoacoustic computed tomography (PACT) system. (h) PA and ultrasound combined images of a human arm. PA, photoacoustic; US, ultrasound, TR, ultrasound transducer; FB, fiber bundle; PC, personal computer; OPO, optical parametric oscillator; UA, ulnar artery; RA, radial artery; T, tendon; GP, gelatin pad.
Source: Figures reproduced with permission from [16, 21–24].
The planar detection PACT system can be designed using a 2D array transducer or a Fabry‐Perot interferometer (FPI). An FPI‐based PACT system with a detection bandwidth of 22 MHz is shown in Figure 7.3c and has high sensitivity, SNR, contrast, and spatial resolution [16, 21]. A time‐reversal image reconstruction algorithm was used to reconstruct an image in this PACT system, achieving higher contrast and spatial resolution compared to the PAM systems, and could acquire high‐resolution images up to an imaging depth of 10 mm. The acquisition of in vivo mammalian tissue images using this system in a mouse with a tyrosinase‐based genetic reporter is shown in Figure 7.3d.
The spherical detection PACT system was developed with a 512‐element hemispherical array with a central frequency of 2 MHz PA mammography, as shown in Figure 7.3e [24]. This system uses a spiral scanning and reconstruct images using a universal back projection algorithm. The reconstructed anatomic structures and vasculature images of a healthy woman's breasts using this system are shown in Figure 7.3f.
The linear detection PACT system has been developed by combining PA imaging with conventional ultrasound imaging modality, as shown in Figure 7.3g. With this system, PA images and ultrasound images can be acquired simultaneously and overlaid with each other to providing complementary anatomical and functional information in one imaging space. The combined system was developed by integrating FDA‐cleared US imaging machine with a portable laser and optical beam delivery parts (Figure 7.3g) [22]. This system can acquire combined PA and ultrasound images at a frame rate of 5 Hz. An example image using this system is shown in Figure 7.3h, where the high‐sensitivity blood flow image obtained using PA are merged with anatomical ultrasound image of a blood vessels in a human arm to provide complimentary information. This type of system has numerous clinical applications, including breast cancer, thyroid cancer, and peripheral vascular diseases.
7.3 Photoacoustic Application of Carbon Nanomaterials
In PA imaging, as described before, the underlying tissue or object absorbs light and converts this absorbed light into heat energy, which is subsequently emitted as ultrasound signal. This emitted US signal is captured to form an image. The PA imaging technique utilizes endogenous chromophores, such as hemoglobin, melanin, and glucose, to visualize internal organs and vasculature noninvasively. However, the endogenous chromophores have low optical absorbance in the near‐infrared (NIR) region where the light penetrates deeper inside the biological tissue, resulting in less‐sensitive images at deeper depth. To supplement the weak PA contrast of endogenous chromophores in NIR region, numerous studies have proposed exogenous PA contrast agents such as dyes (methylene blue, indocyanine green (ICG), and Evans blue (EB)), metallic nanomaterials (gold and silver), organic nanomaterials, and carbon nanomaterials [25–34]. The advantages of these exogenous contrast agents are that they can be tailored for different size and shape and also can conjugate with other materials or proteins depending on the application. The requirements of an effective PA contrast agents are: (i) high photothermal conversion efficiency, (ii) photostability, (iii) biocompatibility, and (iv) biodegradability. It has been reported that the gold nanomaterials have high PA contrast and photostability but biocompatibility and biodegradability remain to be addressed [35, 36]. The Dyes have excellent biocompatibility and biodegradability but limited photostability and showed relatively low PA contrast. Recently, carbon nanoparticles contrast agents have been found to be a very useful exogenous contrast agent for PA imaging. Carbon nanoparticles have been found to be biocompatible to animals and human cells and provide high contrast imaging. Many studies have been conducted to solve the safety concerns of carbon nanomaterials already by controlling the particle size, shape, and surface coatings [27, 37–40]. The carbon nanoparticle PA contrast agents have been developed for various applications, including tumor targeting for early diagnosis, combined multimodal imaging such as fluorescent (FL), CT and magnetic resonance imaging (MRI), and image‐guided phototherapy. In the next section we describe these carbon nanoparticle PA contrast agents in detail and discuss their applications as well.
7.3.1 Carbon Nanomaterials for Photoacoustic Imaging Contrast Agents
Several studies have been conducted on light‐absorbing carbon nanostructures to improve PA imaging contrast with different structures such as nanotube, nanodot, graphene, and different conjugation with organic polymers, peptides, metallic nanoparticles, and dyes [25, 41, 42]. Tumor‐targeting cyclic Arg‐Gly‐Asp (RGD) peptide conjugated single‐walled carbon nanotubes (SWNT‐RGD), and PA contrast agents developed by Zerda et al. are shown in Figure 7.4a [25]. By coupling RGD peptides with SWNT through polyethylene glycol (PEG 5000) grafted phospholipid (PL‐PEG5000), they synthesized SWNT‐RGD of size of 2 nm in diameter and 50–300 nm in length. SWNT‐RGD showed strong optical absorbance at 690 nm optical wavelength in NIR window and the PA imaging was also performed using this optical wavelength of 690 nm. Since the SWND‐RGD have excellent binding ability to αvβ3, which are overexpressed in microvasculature around the tumor area, SWNT‐RGD can be delivered to the tumors effectively. An example image of the intravenously injected SWNT‐RGD in a U87MG tumor xenografts−bearing mouse is shown in Figure 7.4b. The tumor area can be clearly visualized in the post‐SWNT‐RGD‐injected image compared to pre‐injection. In addition, as shown in Figure 7.4c, the PA signal was enhanced approximately 80% more in post‐injection compared to the PA signal before SWNT‐RGD injection. These findings confirm that the PA imaging contrast SWNT‐RGD agent enhances tumor targeting, and thus tumor visualization.

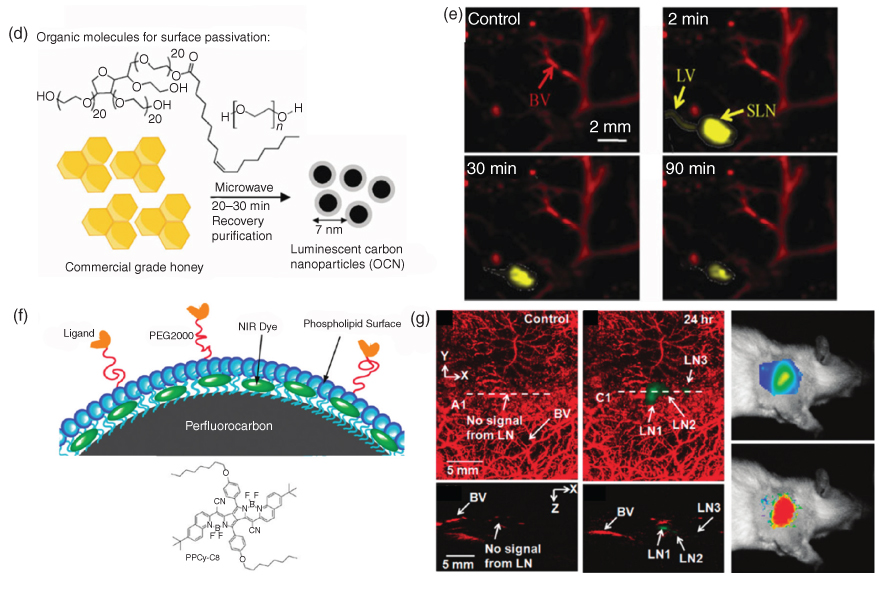
Figure 7.4 (a) Schematic of plain single walled carbon nanotubes (SWNT) and Arg‐Gly‐Asp (RGD) peptide conjugated SWNT‐RGD. (b) Tumor targeting photoacoustic (PA) images after SWCNT‐RGD i.v. injection. (c) PA signal enhancement profiles after SWNT‐RGD and plain SWNT injection. (d) Synthesis of polyethyleneglycol (PEG400) coated luminescent carbon nanoparticles (OCN) from commercial grade honey. (e) PA imaging of sentinel lymph nodes after OCN injection. (f) Schematic of NIR dye, pyrrolopyrrole cyanine (PPCy‐C8), loaded perfluorocarbon nanoparticles (PPCy‐C8/PFC). (g) PA images of sentinel lymph nodes after PPCy‐C8/PFC injection, and fluorescent images after PPy‐C8 injection. LN, lymph node; BV, blood vessels. (See color plate section for the color representation of this figure.)
Source: Figures reproduced with permission from [25, 41, 42].
PA contrast agents for sentinel lymph node (SLN) mapping have been widely studied with gold nanoparticles and organic dyes that are important clinically for the diagnosis of metastatic cancer. For PA SLN mapping, Wu et al. synthesized carbon nanoparticles from commercial food‐grade honey and passivated its surface with organic polymer using solvent‐free green synthesis [41]. The commercial honey was suspended as an organic polymer passivator or polyethyleneglycol (PEG400) and was heated in the microwave after purging with argon, as shown in Figure 7.4d, to synthesize nanoparticles. These synthesized nanoparticles were then centrifuged. The size of PEG400‐coated luminescent carbon nanoparticles (OCN) was 7–8 nm in diameter. The optical absorbance of the OCN was much higher than the blood in NIR windows, and the invisible SLN were clearly visualized in PA images after intradermal OCN injection, as shown in Figure 7.4e. The PA amplitude with OCN was enhanced approximately 60% immediately after OCN injection and decreased to 20% 90 minutes after injection (Figure 7.4e). These results confirm the OCN's clearance from SLN after circulating in the lymphatic system.
For SLN mapping in PA imaging, Akers et al. also developed NIR dye, pyrrolopyrrole cyanine (PPCy‐C8), and loaded perfluorocarbon nanoparticles (PPCy‐C8/PFC) as shown in Figure 7.4f [42]. Perfluorocarbon (PFC) compound is made of carbon and fluorine (replaced C‐H bonding to C‐F bonding) and is highly biocompatible; thus, it can be eliminated within three days from the body through lungs. Although the PPCy‐C8/PFC was synthesized by loading the NIR dye, which has a strong optical absorbance in NIR windows and strong fluorescence into PFC, fluorescence expression became very weak and the PA signal became very strong. From the in vivo PA imaging of SLN after PPCy‐C8/PFC injection and FL imaging of SLN after original PPCy‐C8 injection, the PA signal and fluorescence signal became stronger, as shown in Figure 7.4f,g.
In this section, we discussed several carbon nanostructures PA imaging contrast agents for SLN mapping and tumor targeting. Carbon nanostructure PA contrast agents are useful to improve PA contrast of specific tumors or organs that have low optical absorbance. The physical, optical absorption, and functional properties of the discussed carbon nanomaterials are summarized in Table 7.1.
Table 7.1 Physical, optical absorption and functional properties of the carbon nanomaterials for photoacoustic imaging contrast enhancement.
| Structure | Size (nm) | Excitation λ (nm) | Targeting capability | Conjugation | |
| SWNT‐RGD [25] | Nanotube |
Diameter: 2 Length: 50–300 | 680, 808 | Tumor | Peptide |
| OCN [41] | Nanoparticle | 7–8 | 650 | – | Polyethyleneglycol |
| PPCy‐C8/PFC [42] | Nanoparticle | 220 | 767 | – | Dye |
7.3.2 Carbon Nanomaterials for Multimodal Photoacoustic Imaging
The PA imaging modality images beyond the optical diffusion limit while maintaining high spatial resolution and providing high optical contrast (e.g. optical absorption) and functional information from the biological targets. PA imaging is still evolving clinically and technologically, including multimodal imaging, where complementary information from multiple modalities, such as ultrasound and PA, are put together to provide an integrated diagnostic information [27, 43–45]. The integrated imaging has great potential to collect complementary information from biological researches and clinical experiments. Fortunately, a PA imaging system lends itself for easy integration with other imaging modalities because of its hybrid nature, which combines light source and ultrasonic detection mechanisms to form an image.
Carbon‐nanomaterials‐based contrast agents, described previously, have demonstrated a potential for use in multimodal imaging for a variety of imaging techniques. The intrinsic optical properties of carbon nanomaterials are attractive for multimodal imaging because they have relatively broad optical absorption spectra in the NIR range called the biological window. The single‐walled carbon nanotubes emit NIR light at the optical excitation, and they have a strong and unique Raman scattering signal for detection and thus for imaging. In addition, carbon nanomaterials are the most suitable contrast agents for multimodal imaging because they are highly flexible in synthesis and functionalization.
Raman spectroscopy is a notable biosensing optical technology that provides structural fingerprints derived from molecular and electromagnetic radiation interaction [46, 47]. Sensitive chemical specificity and selective detection makes this technology very attractive for biosensing and preclinical use. However, common materials produce very weak Raman scattering signals; thus, metal nanomaterials are often used for surface‐enhanced Raman scattering (SERS). Since carbon nanomaterials are inherently strong to generate unique Raman signals, pure single‐walled carbon nanotubes (SWCNT) can be readily used as contrast agents for dual‐modal imaging of PA and Raman [25, 37, 48]. Pramanik et al. showed that high contrast‐to‐noise ratio (CNR) and great resolution images can be obtained for a noninvasive SLN PA mapping using SWCNT agent [37]. Figure 7.5a shows the transmission electron microscopy (TEM) images of synthesized SWCNTs, and the diameter of the SWNCT is about 2 nm. Figure 7.5b shows the fingerprint Raman spectrum of the SWCNTs obtained at 633 nm to confirm the uniform SWCNT Raman characterization. Due to the stronger optical absorption properties of SWCNT than that of blood over the NIR wavelength range, after SWCNTs are injected through the forepaw pad into the rat SLN region, it can be clearly and easily identified in the PA image, as shown with the red dashed circle in Figure 7.5c. Figure 7.5d–f [48], respectively, show how to detect, map, and quantify materials using SWCNTs obtained by PAM and Raman spectroscopy system. Figure 7.5d,e compare PA signals on the presence and absence of SWCNTs in a human breast cancer tissue. Compared to Figure 7.5d,e, it shows the high sensitivity and specificity of PAM from spotted SWCNTs, where OR‐PAM (laser excitation wavelength: 570 nm) clearly identifies SWCNTs from the artifacts, such as trace impurities, excess nuclear stains, dust, and small bubbles. Fingerprint Raman spectra were also obtained from Raman spectroscopy (laser excitation wavelength: 532 nm) to confirm the presence of SWCNTs in breast cancer tissues. SWCNTs can also be used for in in vivo test and the in vivo 2D image of PA and Raman images are shown in Figure 7.5g,h, comparing the targeting SWCNT and nontargeting SWCNT (data not shown) [25]. Zerda et al. improved the targeting ability of tumor‐bearing mice (shown in Figure 7.5g) by conjugating the cyclic RGD peptide with SWCNT. As shown in Figure 7.5g PA image (Figure 7.5g right), after four hours of administering of targeting SWCNTs through tail‐vein, the much stronger PA signals were detected near the tumor region than the case of nontargeting SWCNTs (data not shown). To confirm that the targeting SWCNT accumulated in tumors, tumors extracted from sacrificed mice were imaged with a Raman microscope. The materials were well visualized with a Raman microscope (Figure 7.5h) and quantification of materials accumulation was in both the PA and Raman techniques.
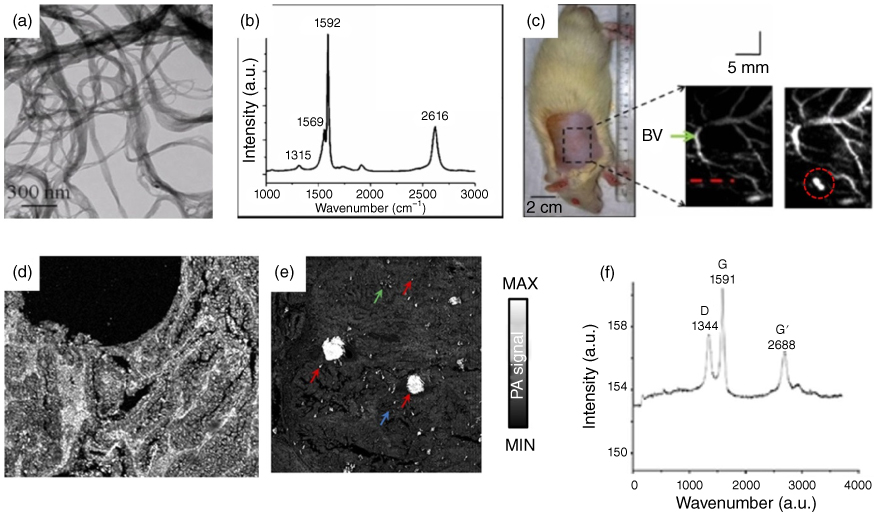

Figure 7.5 Multimodal imaging of photoacoustic (PA) and Raman with single‐walled carbon nanotubes (SWCNTs). (a) TEM image of SWCNTs. (b) A Raman spectrum of the SWCNT obtained at 633 nm. (c) Sentinel lymph node PA mapping of a Rat before and after SWCNTs injection; Optical‐resolution photoacoustic microscopy (OR‐PAM) image of the same human breast cancer tissue without (d) and with (e) SWCNTs. (f) Raman spectrum generated from SWCNTs using Raman spectroscopy. (g) In vivo PA imaging of tumor bearing mice after injection of targeting SWCNTs. (h) Ex vivo Raman imaging for verification of SWCNTs with Raman microscope. (See color plate section for the color representation of this figure.)
Source: Figures reproduced with permission from [25, 37, 48].
FL imaging is a noninvasive and inexpensive imaging modality used for a wide variety of applications, including biology research [49, 50]. When the excitation laser illuminates a target area, the molecules of the target absorb the light and are converted into light of other wavelengths, including FL light. FL imaging provides high sensitivity, down to a single molecule, for superficial imaging. Since FL imaging has a shallow penetration imaging depth while PA imaging has high penetration depth, these two modalities can be combined to provide complimentary information of underlying tissue. Both PA and FL imaging require light as a source; hence, it is relatively easy to integrate both modalities. Several contrast agents have been developed to get both FL and PA effects, namely tumor targeted theranostic probe (CPGA) [51], FL carbon dots (C‐dots) [52], ICG conjugated SWCNTs [53], and Evans blue conjugated SWCNTs [54]. Gao et al. [51] developed a multimodal FL/PA imaging agent by seeding gold nanoparticles onto graphene oxide (GO), as shown in Figure 7.6a with strong near‐IR absorption and photo‐conversion efficiency. The multimodal capability of the CPGA agents is shown in Figure 7.6b,c. After intravenous injection of CPGA, the CPGA accumulates in tumor blood vessels, gradually reaching a peak at six hours, as shown in the PA image (Figure 7.6c). Compared to control FL image (Figure 7.6b), the PA imaging (Figure 7.6c) shows a significant difference. PA image with CPGA shows a much higher resolution than the FL image.

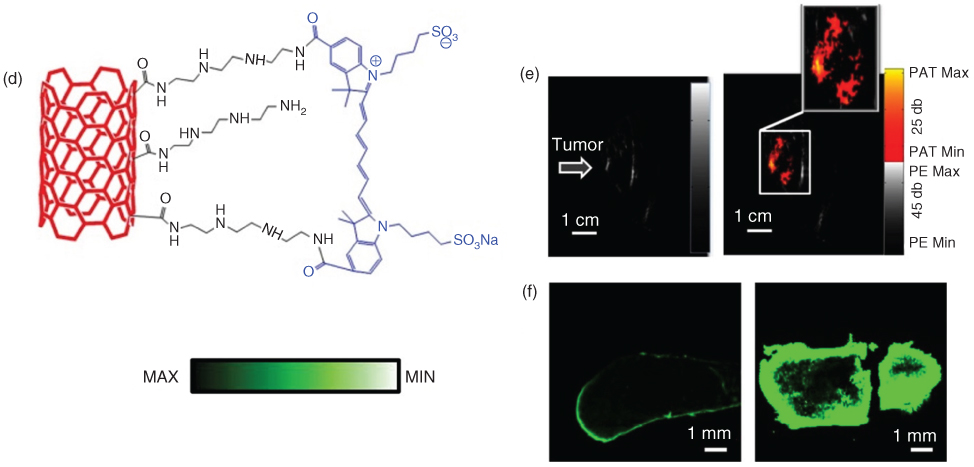
Figure 7.6 Multimodal imaging of photoacoustic (PA) and fluorescent (FL) with carbon nanomaterials. (a) Schematic of CPGA. (b) In vivo NIR FL imaging. and (c) PA imaging of tumor‐bearing mice before and after injection of CPGA. (d) Schematic of indocyanine green conjugated single‐walled carbon nanotubes (ICG‐SWCNT). (e) In vivo Ultrasound (left) and PA images at 80 minutes after injection (right) of ICG‐SWCNT acquired at tumor sites; (f) Ex vivo FL images of ICG‐injected tumor (left) and ICG/SWCNT‐injected tumor (right). (See color plate section for the color representation of this figure.)
ICG conjugated SWCNT (ICG/SWCNT) (Figure 7.6d) was introduced by Zhangneh et al. [53], and Figure 7.6e,f show the FL and PA results after the injection of this contrast agent. The absorption spectrum peak of ICG/SWCNT occurs at 750 nm and exhibits a 25‐fold higher absorbance than the nonconjugated SWCNT at the same wavelength. After intra‐tumor injection of ICG/SWCNT, strong PA signals are detected near the 4T‐1 tumor region (Figure 7.6e). The wavelength of the PA system used here was 755 nm and the energy density of the laser beam was kept at 8 mJ cm−2 . The weak PA signals were detected immediately after injection of the ICG/SWCNT, but the signal strength increased significantly at 80 minutes post‐injection. To visualize the distribution of ICG and ICG/SWCNT, the tumors were excised from the mice and FL images were acquired. The FL images in Figure 7.6f show a significant increase of ICG/SWCNT accumulation in the tumor region (Figure 7.6f, right).
Xie applied [54] EB/carbon nanotube‐based delivery system (ACEC) loaded with multifunctional albumin/Ce6 to visualize SCC‐7 tumor using FL and PA imaging. C‐dots with red luminescence (from 500 to 800 nm, with a peak at 640 nm) conjugated with polymer, polythiophene phenylpropionic acid (PPA) as a precursor, have broad absorption band, which enables C‐dots to generate FL and PA simultaneously [52]. The C‐dots were accumulated in tumors due to enhanced permeability and retention (EPR) effect, so stronger FL intensity can be seen near the tumor region than in other regions. Applications of C‐dot include any application where ICG is used as an agent, e.g. SNL mapping, bladder, and tumors imaging [50, 55, 56].
Graphene‐based nanocomposites can be used for PA and CT or PA and MRI dual‐modal imaging. X‐ray CT is a computer‐processed medical imaging method that provides cross‐sectional tomography using multiple X‐ray measurements taken from multiple angles. Graphene‐based nanocomposites not only have great potential as biomedical contrast agents for CT and MRI, they also have strong NIR absorption and high efficiency for PA signal generation [57–59]. In Kai's work [59], a new probe based on a reduced graphene oxide (RGO) iron oxide nanoparticle (IONP) nanocomposite were used as in vivo agents for PA and MRI multimodal imaging. For this in vivo testing, RGO‐IONP was supplemented PEG to improve biocompatibility. After i.v. injection of RGO‐IONP‐PEG into the 4T1 tumor‐bearing mice, strong PA and MR signals were detected near the tumor. Thus, in this study, graphene‐based nanocomposites using external radiative and intrinsic optical absorption properties exhibit high EPR effects, biodistribution, and multimodal capabilities for PA and MR imaging. A graphene‐based nanomaterial, GO/Bi2Se3/PVP, can be used as a dual‐modal agent for PA/CT imaging. Zhang et al. [57], developed GO/Bi2Se3/PVP (Figure 7.7a) by directly depositing Bi2Se3 nanoparticles on GO in the presence of polyvinylpyrrolidone (PVP). Bi‐based materials, Bi2Se3 nanomaterials exhibit strong X‐ray attenuation and thus can act as contrast agents for CT imaging. They also exhibit strong optical absorption properties in the NIR range, and thus can be used as PA contrast agents as well. When a nude mouse with Hela tumor was injected with GO/Bi2Se3/PVP, enhancement of CT signals in the 3D‐rendered CT image (Figure 7.7b, right) of Hela tumor was noticeable compared with the control group (Figure 7.7b, left). The CT cross‐sectional image in Figure 7.7c shows this enhancement. A signal that was not seen prior to injection appeared in tumor appeared compared to the CT image before injection of the contrast agent. As mentioned before, GO/Bi2Se3/PVP is also well suited for in vivo PA imaging. Figure 7.7d shows PA images before and after the GO/Bi2Se3/PVP injection, and the enhanced PA signal appears in the tumor region. The physical, optical absorption, and functional properties of the discussed carbon nanomaterials are summarized in Table 7.2.

Figure 7.7 Multimodal imaging of photoacoustic (PA) and computed tomography (CT) imaging with carbon nanomaterials. (a) Schematic of GO/Bi2Se3/PVP nanocomposites. (b) 3D volume rendering CT images before (left) and after (right). (c) CT cross‐sectional images of the tumor site before (top) and after (bottom) intratumoral injection of GO/Bi2Se3/PVP. (d) PA images acquired before and 30 minutes after intratumoral injection of GO/Bi2Se3/PVP.
Source: Figures reproduced with permission from [57].
Table 7.2 Physical, optical absorption, and functional properties of the carbon nanomaterials for photoacoustic (PA) combined multimodal imaging contrast agents. FL, fluorescent; MRI, magnetic resonance imaging.
| Structure | Size (nm) | Targeting capability | Imaging modalities | |
| SWCNT [37, 48] | Nanotube | Dia.: 1.4 | Tumor | PA, Raman |
| SWCNT‐RGD [25] | Nanotube | Len.: 50–300Dia.: 1.0–2.0 | – | PA, Raman |
| ACEC [54] | Nanotube | Dia.: 0.7–1.4 | Tumor | PA, FL |
| ICG/SWCNT [53] | Nanotube | Len.: 100–1000Dia.: 1.0 | Tumor | PA, FL |
| C‐dots [52] | Carbon dots | Dia.: 10 | Tumor | PA, FL |
| RGO‐IONP‐PEG [59] | Graphene | Dia.: ~50 | Tumor | PA, CT |
| GO/Bi2Se3/PVP [57] | Graphene | Dia.: ~150 | Tumor | PA, FL, MRI |
7.3.3 Carbon Nanomaterials for Photoacoustic Image‐Guided Therapy
Photothermal therapy (PTT) and photodynamic therapy (PDT) have been widely studied and reported in the literature using numerous kinds of agents, including metallic nanoparticles, organic nanoagents, and carbon nanoparticles [59–62]. Both PTT and PDT use light‐absorbing photosensitizers to selectively treat disease by irradiating diseased cells in which the photosensitizer is accumulated. PTT uses photosensitizers that effectively generate heat energy after the absorption of light, especially in the NIR region, for thermal ablation of abnormal tissues including tumor [63]. The novel advantage of PTT is its ability to selectively ablate tumor with minimal invasion while minimizing damage to surrounding normal tissue around the tumor. As both PTT and PA imaging employ photothermal effect of the photosensitizer, PA imaging and PTT can be easily combined using single nanoparticle conjugation for guiding and treatment.
In PDT, laser irradiation activates photosensitizers from ground state to active state. When the activated photosensitizers decays to a triplet excited state, high cytotoxic reactive oxygen species gets created due to reaction with molecular oxygen. With the photoactivated photosensitizers' toxicity, PDT effectively kills diseased tissue or micro vasculatures surrounding the tumor responsible for cancer cell nutrition [64]. Since the most dominant endogenous chromophore that provides high imaging contrast is hemoglobin, PA imaging provides vasculature information and functional information, including oxygenation and blood flow, which are well suited for monitoring the PDT process.
Lee et al., developed nitrogen‐doped carbon nanodots (N‐CNDs) that can be used as therapeutic agents and photoacoustic contrast agents [26]. N‐CNDs were synthesized by controlling nitrogen source and carbonizing organic acids with nitric acid and citric acid. Citric acid and nitric acid aqueous solution were first dehydrated by heating at 250 °C to form a polymer intermediate (Figure 7.8a). The carbonized cores were then developed by carbonizing these polymer intermediates. To inhibit unwanted intergranular aggregation, the oleylamine was grafted onto a core surface. Finally, N‐CNDs were made water soluble by replacing the grafted oleylamine with ethanolamine. The particle size was ~3 nm and the nitrogen content of the N‐CNDs was adjusted by changing the molarity of the nitric acid solution. N‐CNDs showed strong optical absorbance in the NIR region and a high thermal conversion efficiency. As a result, a strong PA signal was detected in the NIR region and the temperature raised up to 50 °C after 808 nm laser irradiation. Post N‐CNDs intradermal injection to the mouse, invisible SLNs become visible and can be clearly mapped in the PA images, as shown in Figure 7.8b. The PA signal in SLNs decreased after 30 minutes, which implies that N‐CNDs were degraded by the lymphatic system. Also, PTT was conducted on a HepG2 cancer‐bearing mouse after intratumoral injection of N‐CNDs to show the PA imaging contrast agent and PTT agent capability of N‐CNDs. Figure 7.8c clearly shows the effectiveness of N‐CNDS for PTT and also for the visualization of PTT through PA imaging.
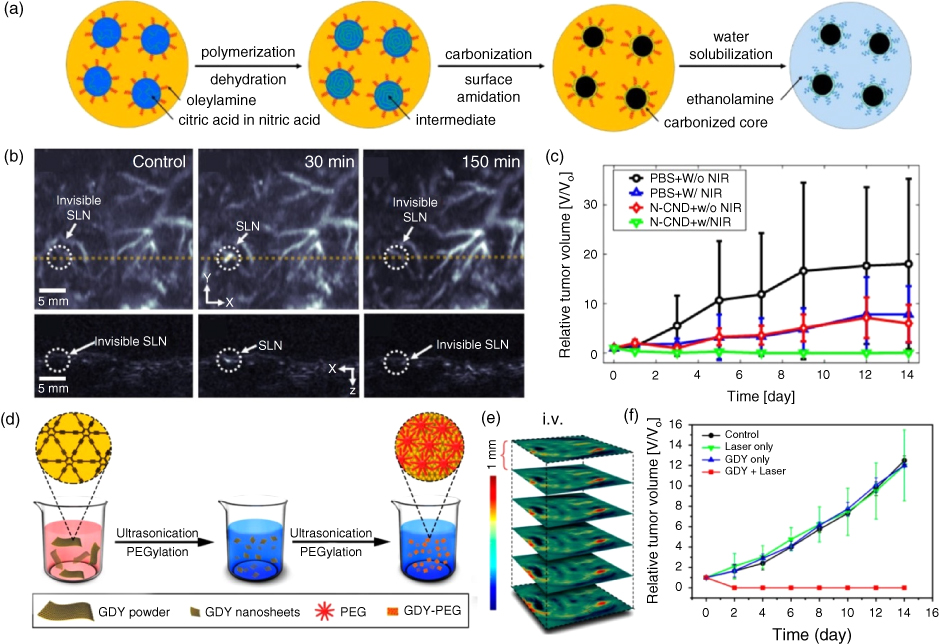
Figure 7.8 (a) Synthesis of nitrogen (N) doped carbon nanodots (N‐CND). (b) Photoacoustic (PA) imaging of sentinel lymph nodes after N‐CND injection. (c) Photothermal therapy (PTT) monitoring after PBS and N‐CND injection with laser irradiation and without irradiation. (d) Synthesis PEGylated graphdiyne (GDY‐PEG). (e) PA imaging of tumor after i.v. injection of GDY‐PEG. (f) PTT monitoring after i.v. injection of GDY‐PEG with laser irradiation and without laser irradiation. (See color plate section for the color representation of this figure.)
Two‐dimensional carbon nanostructure, graphdiyne (GDY), was studied by Li et al. [65] as PA imaging contrast agent and PTT agent. The GDY is a new 2D carbon nanostructure that was first introduced in 2010. It is composed of benzene rings and carbon−carbon triple bonds. It shows unique characteristics suitable for PA imaging and PTT, such as broad optical absorption spectrum, high photothermal conversion efficiency, and variable photoelectric properties. The GDY‐PEG was synthesized, shown in Figure 7.8d, to enhance the biocompatibility and water solubility by PEGylation. The PA amplitude spectra showed optical absorbance spectra in the NIR region and also linear correlation between PA signal intensity and concentration. After i.v. injection of GDY‐PEG into a 4T1 tumor‐bearing mouse, the PA signal increased gradually up to 12 hours in the tumor area (Figure 7.8e). Due to the high light‐to‐sound conversion efficiency of GDY‐PEG, the temperature increased by 30 °C when the 808‐nm laser was irradiated by GDY‐PEG with a power of 1 W cm−2 , and the tumor was completely ablated by the PTT (Figure 7.8f). These studies show the potential for biocompatible carbon nanomaterials as both a PA imaging agent and the PTT agent.
Chen et al. developed a maleic anhydride‐alt‐1‐octadecene‐poly(ethylene glycol) (C18PMH‐PEG) functionalized single‐walled carbon nanohorns (SWNHs), which shows strong optical absorption in the NIR region for PA image‐guided PTT [66]. The diameter of the SWNHs/C18PMH‐PEG was 100 nm, which is an optimal size to accumulate in cancer cells post i.v. injection due to EPR effects. The developed SWNHs/C18PMH‐PEG showed strong light absorbance in VIS‐NIR region, and the temperature increases after laser irradiation, resulting in the emission of ultrasound signals. After i.v. injection of SWNHs/C18PMH‐PEG, the tumor region and its boundary were clearly visible in the PA image due to the accumulation of conjugate in the tumor. The PTT to the in vivo 4T1 tumor‐bearing mouse was also performed by i.v. injection of the conjugate and laser irradiation.
To enhance the phototherapy efficiency, several studies have shown the potential of using carbon materials for PA image‐guided combined PTT &PDT treatment agent. Xie et al., developed albumin encapsulated Ce6/ECNTs (ACEC) by loading albumin and Chlorine e6 (Ce6) complex (albumin/Ce6) onto surface Evans blue modified single‐walled carbon nanotube (ECNTs) as shown in Figure 7.9a [54]. The albumin/Ce6 was prepared by encapsulating albumin onto Ce6 via high‐pressure homogenization. The ECNTs were prepared by the sonication of single‐walled carbon nanotube (SWCNT), Evans blue, and deionized water solution. Then ACEC was synthesized by centrifuging albumin/Ce6 and ECNTs dissolved deionized water solution for one hour. Due to modification of SWCNT surface with Evans blue, the complex had hydrophilic surface with high water solubility and improved linking with active molecules. A photosensitizer Ce6 enables both PTT and PDT synergistically and due to albumin encapsulation, the complex prolonged the nanoparticle circulation, which enhances tumor targeting efficiency. ACEC showed broad optical absorption band in UV‐VIS‐NIR region and also strong detection of PA and FL signal. The ACEC's tumor accumulation process was monitored by PA and FL imaging post i.v. injection of the agent to the SCC‐7 tumor‐bearing mouse, as shown in Figure 7.9b,c. The PA signal inside the tumor increased up to 24 hours and then decreased with time under the optical excitation wavelength of 808 nm. In addition, when effectiveness of treatment was compared with various combinations of substances, ACEC, which combines both PTT and PDT, ablated the tumor effectively (Figure 7.9d).

Figure 7.9 (a) Synthesis of albumin encapsulated Chlorine e6 (Ce6) loaded surface modified single walled carbon nanotube with Evans blue (ACEC). (b‐c) Photoacoustic (PA) and fluorescent imaging of tumor after i.v. injection of Ce6 and ACEC. (d) Photothermal therapy (PTT) and photodynamic therapy (PDT) monitoring. (e) Synthesis of gold nanorod@silica‐carbon dots (GNR@SiO2‐CDs). (f) PA imaging of tumor after i.v. injection of GNR@SiO2‐CDs; (g) PTT and PDT monitoring after i.v. injection of GNR@SiO2‐CDs with laser irradiation of different wavelength (635 nm for PDT, and 808 nm for PTT). (See color plate section for the color representation of this figure.)
Jia et al. also developed a complex that can do both PTT and PDT, gold nanorod@silica‐carbon dots (GNR@SiO2‐CDs) [67]. In GNR@SiO2‐CDs, gold nanorod served as PA contrast and PTT agent with high optical absorption, and the carbon dots acted as FL imaging and a PDT agent (Figure 7.9e). After i.v. injection of GNR@SiO2‐CDs into a B16‐F0 tumor‐bearing mouse, the FL and the PA signal increased in the tumor region for 24 hours. The tumor and the surrounding vasculatures were clearly visualized in the PA images with the FL optical excitation wavelength of 635 nm and the PA optical excitation wavelength of 680–980 nm range (Figure 7.9f). In addition, the PTT, PDT, and both PTT and PDT combined treatment efficiency were compared, via laser with different excitation wavelength (635 nm laser for PDT, and 808 nm laser for PTT) and using the difference in the peak optical absorption point of gold nanorod and carbon dots. Though the PTT‐ or PDT‐treated tumor showed delayed tumor growth compared to the tumor without any treatment, the size of the tumor increased with time. However, the tumor treated with combined PTT and PDT method totally removed the tumor with high ablation efficiency (Figure 7.9g).
In this section, we reviewed the synthesis and the evaluation of the carbon nanomaterials for PA image‐guided PTT and combined PTT & PDT. Since PA imaging and PTT both use light‐to‐heat conversion phenomena, the carbon nanomaterials with high photothermal conversion efficiency can be used both as a PA imaging contrast agent and PTT agent. To increase the phototherapeutic effect, several studies synthesized photosensitizers in the carbon nanomaterials and simultaneously applied PTT and PDT for cancer ablation. The physical, optical absorption, and functional properties of the carbon nanomaterials discussed here are summarized in Table 7.3.
Table 7.3 Physical, optical absorption, and functional properties of the carbon nanomaterials for photoacoustic image‐guided photothermal therapy (PTT) and photodynamic therapy (PDT).
| Structure | Size (nm) | Excitation λ (nm) | Targeting capability | Therapeutic capability | |
| N‐CNDs [26] | Nanodot | 3 | 680, 808 | – | PTT |
| SWNHs/C18PMH‐PEG [66] | Nanotube | 80–100 | 808 | Tumor | PTT |
| GDY‐PEG [65] | Graphdiyne | 360 | 808 | Tumor | PTT |
| ACEC [54] | Nanotube | 0.7–1.4 | 808 | Tumor | PTT, PDT |
| GNR@SiO2‐CDs [67] | Nanodot | 90 | 635, 808 | Tumor | PTT, PDT |
7.3.4 Conclusions and Future Perspective
In this chapter, we discussed several studies describing PA imaging methods and carbon‐based nanomaterials. The PA imaging is a powerful high‐resolution noninvasive biomedical imaging technique and has superior penetration depth compared to light diffusion limits of the other optical methods. The PA imaging has various clinical applications, e.g. vasculature networks and lymphatic mapping, multiscale organelle visualization, drug delivery monitoring, single red blood cells and cancer cells, and spectral molecular imaging. Carbon nanomaterials are excellent contrast agents for PA imaging due to their excellent biocompatibility, strong light absorption properties in biological windows and high light‐to‐heat conversion efficiency.
The light‐absorption properties directly affecting the PA signal are relatively low for carbon nanomaterials compared to gold nanoparticles, but the potential for PA biomedical imaging is substantial. The reason for this claim is the high flexibility of functionalization and synthesis of carbon nanomaterials for various biomedical uses. In addition, the broad absorption spectrum characteristics of carbon nanomaterials make spectral PA imaging difficult because they are hard to separate from other PA signal sources in the spectrum. However, due to the high optical stability of carbon nanomaterials, it is possible to overcome the difficulty by easily attaching various dyes with inherent absorption spectrum characteristics. The most dominant endogenous chromophore in PA imaging is hemoglobin, and the hemoglobin shows relatively low optical absorption in near infrared region over optical wavelength of 650 nm. In the case of SWNT‐RGD [25], which has the maximum optical absorption at 690 nm and has tumor targeting properties, it can be separated from the PA signal in the blood vessels when obtaining the PA image around the tumor. ICG/SWCNT [53], and ACEC [54] with maximum absorption peaks at 750 nm and 808 nm, respectively, are also carbon nanomaterials well suited for PA imaging because of their multimodal imaging (PA + FL) and therapeutic (PTT and PDT) capabilities.
Moreover, carbon nanomaterials can be processed relatively easily with a variety of sizes/shapes (carbon nanotube, carbon dots, carbon‐based quantum dots, and graphene). Various types of nanomaterials, such as gold nanostars, gold nanoprisms, and copper sulfide nanotriangles, have been widely used for PA imaging [68–70], and similar shaped carbon nanoparticles could be potential candidates for PA imaging. In general, the wider the surface area, the more light can be absorbed, showing the greater optical absorption at the same concentration of nanomaterials. However, simply increasing the size of the carbon nanomaterials is not optimal in terms of PA biomedical imaging, particularly in terms of biocompatibility. Therefore, it is expected that carbon nanomaterials with strong PA sensitivity at the same concentration, ease of functionalization for various clinical application, unique absorption spectrum characteristics, and appropriate size for cancer detection and delivery through the blood vessels are most suitable for PA biomedical imaging.
In the past few decades, a number of carbon nanomaterials studies have been performed using PA imaging techniques, including contrast enhancement, multimodal contrast agents, and therapeutic purposes. We believe combination of carbon nanomaterial agent with PA imaging offer an excellent clinical tool for clinical diagnosis, as well as therapeutic treatment and monitoring of diseased tissue or malignant tumors. In near future, this clinical tool will be deployed for real clinical studies.
Acknowledgments
This work was supported by MSIT (Ministry of Science and ICT), Korea, under the ICT Consilience Creative program(IITP‐2017‐R0346‐16‐1007) supervised by the IITP(Institute for Information & communications Technology Promotion), the National Research Foundation of Korea (NRF) grant funded by the Korea government (MSIP) (No. 2011‐0030075), a grant of the Korea Health Technology R&D Project through the Korea Health Industry Development Institute (KHIDI), funded by the Ministry of Health & Welfare, Republic of Korea (grant number:HI15C1817), the Pioneer Research Center Program through the National Research Foundation of Korea funded by the Ministry of Science, ICT & Future Planning (NRF‐2014M3C1A3017229), the Pioneer Research Center Program through the National Research Foundation of Korea funded by the Ministry of Science, ICT & Future Planning (NRF‐2017M3C1A3037762), and Industrial Technology Innovation Program (No. 10048358) of the Ministry of Trade, Industry & Energy, Republic of Korea.
References
- 1 Jeon, M., Kim, J., and Kim, C. (2016). Multiplane spectroscopic whole‐body photoacoustic imaging of small animals in vivo. Medical & Biological Engineering & Computing 54 (2–3): 283–294.
- 2 Kim, J.Y., Lee, C., Park, K. et al. (2015). Fast optical‐resolution photoacoustic microscopy using a 2‐axis water‐proofing MEMS scanner. Scientific Reports 5: 7932.
- 3 Wang, L., Maslov, K., Yao, J. et al. (2011). Fast voice‐coil scanning optical‐resolution photoacoustic microscopy. Optics Letters 36 (2): 139–141.
- 4 Yao, J., Maslov, K.I., Zhang, Y. et al. (2011). Label‐free oxygen‐metabolic photoacoustic microscopy in vivo. Journal of Biomedical Optics 16 (7): 076003.
- 5 Yao, J., Wang, L., Yang, J.‐M. et al. (2015). High‐speed label‐free functional photoacoustic microscopy of mouse brain in action. Nature Methods 12 (5): 407–410.
- 6 Brecht, H.‐P., Su, R., Fronheiser, M. et al. (2009). Whole‐body three‐dimensional optoacoustic tomography system for small animals. Journal of Biomedical Optics 14 (6): 064007.
- 7 Gamelin, J., Aguirre, A., Maurudis, A. et al. (2008). Curved array photoacoustic tomographic system for small animal imaging. Journal of Biomedical Optics 13 (2): 024007.
- 8 Li, G., Li, L., Zhu, L. et al. (2015). Multiview Hilbert transformation for full‐view photoacoustic computed tomography using a linear array. Journal of Biomedical Optics 20 (6): 066010.
- 9 Xia, J., Chatni, M.R., Maslov, K. et al. (2012). Whole‐body ring‐shaped confocal photoacoustic computed tomography of small animals in vivo. Journal of Biomedical Optics 17 (5): 0505061–0505063.
- 10 Wang, L.V. and Yao, J. (2016). A practical guide to photoacoustic tomography in the life sciences. Nature Methods 13 (8): 627–638.
- 11 Hu, S. and Wang, L.V. (2013). Optical‐resolution photoacoustic microscopy: auscultation of biological systems at the cellular level. Biophysical Journal 105 (4): 841–847.
- 12 Hai, P., Yao, J., Maslov, K.I. et al. (2014). Near‐infrared optical‐resolution photoacoustic microscopy. Optics Letters 39 (17): 5192–5195.
- 13 Park, S., Lee, C., Kim, J., and Kim, C. (2014). Acoustic resolution photoacoustic microscopy. Biomedical Engineering Letters 4 (3): 213–222.
- 14 Jose, J., Grootendorst, D.J., Vijn, T.W. et al. (2011). Initial results of imaging melanoma metastasis in resected human lymph nodes using photoacoustic computed tomography. Journal of Biomedical Optics 16 (9): 096021.
- 15 Laufer, J., Zhang, E., Raivich, G., and Beard, P. (2009). Three‐dimensional noninvasive imaging of the vasculature in the mouse brain using a high resolution photoacoustic scanner. Applied Optics 48 (10): D299–D306.
- 16 Laufer, J., Norris, F., Cleary, J. et al. (2012). In vivo photoacoustic imaging of mouse embryos. Journal of Biomedical Optics 17 (6): 0612201–0612208.
- 17 Heijblom, M., Piras, D., Brinkhuis, M. et al. (2015). Photoacoustic image patterns of breast carcinoma and comparisons with Magnetic Resonance Imaging and vascular stained histopathology. Scientific Reports 5: 11778.
- 18 Tang, J., Coleman, J.E., Dai, X., and Jiang, H. (2016). Wearable 3‐D photoacoustic tomography for functional brain imaging in behaving rats. Scientific Reports 6: 25470.
- 19 Kim, C., Erpelding, T.N., Jankovic, L. et al. (2010). Deeply penetrating in vivo photoacoustic imaging using a clinical ultrasound array system. Biomedical Optics Express 1 (1): 278–284.
- 20 Needles, A., Heinmiller, A., Sun, J. et al. (2013). Development and initial application of a fully integrated photoacoustic micro‐ultrasound system. IEEE Transactions on Ultrasonics, Ferroelectrics, and Frequency Control 60 (5): 888–897.
- 21 Jathoul, A.P., Laufer, J., Ogunlade, O. et al. (2015). Deep in vivo photoacoustic imaging of mammalian tissues using a tyrosinase‐based genetic reporter. Nature Photonics 9 (4): 239–246.
- 22 Kim, J., Park, S., Jung, Y. et al. (2016). Programmable real‐time clinical photoacoustic and ultrasound imaging system. Scientific Reports 6: 35137.
- 23 Li, L., Zhu, L., Ma, C. et al. (2017). Single‐impulse panoramic photoacoustic computed tomography of small‐animal whole‐body dynamics at high spatiotemporal resolution. Nature Biomedical Engineering 1 (5): 0071.
- 24 Toi, M., Asao, Y., Matsumoto, Y. et al. (2017). Visualization of tumor‐related blood vessels in human breast by photoacoustic imaging system with a hemispherical detector array. Scientific Reports 7: 41970.
- 25 De La Zerda, A., Zavaleta, C., Keren, S. et al. (2008). Carbon nanotubes as photoacoustic molecular imaging agents in living mice. Nature Nanotechnology 3 (9): 557–562.
- 26 Lee, C., Kwon, W., Beack, S. et al. (2016). Biodegradable Nitrogen‐Doped Carbon Nanodots for Non‐Invasive Photoacoustic Imaging and Photothermal Therapy. Theranostics 6 (12): 2196.
- 27 Cha, M.G., Lee, S.‐H., Park, S. et al. (2017). A dual modal silver bumpy nanoprobe for photoacoustic imaging and SERS multiplexed identification of in vivo lymph node. Nanoscale 9 (34): 12556–12564.
- 28 Jeon, M., Song, W., Huynh, E. et al. (2014). Methylene blue microbubbles as a model dual‐modality contrast agent for ultrasound and activatable photoacoustic imaging. Journal of Biomedical Optics 19 (1): 016005–016005.
- 29 Lee, C., Kim, J., Zhang, Y. et al. (2015). Dual‐color photoacoustic lymph node imaging using nanoformulated naphthalocyanines. Biomaterials 73: 142–148.
- 30 Li, X., Kim, C.‐Y., Lee, S. et al. (2017). Nanostructured phthalocyanine assemblies with protein‐driven switchable photoactivities for biophotonic imaging and therapy. Journal of the American Chemical Society 139 (31): 10880–10886.
- 31 Paproski, R.J., Heinmiller, A., Wachowicz, K., and Zemp, R.J. (2014). Multi‐wavelength photoacoustic imaging of inducible tyrosinase reporter gene expression in xenograft tumors. Scientific Reports 4: 5329.
- 32 Song, J., Kim, J., Hwang, S. et al. (2016). “Smart” gold nanoparticles for photoacoustic imaging: an imaging contrast agent responsive to the cancer microenvironment and signal amplification via pH‐induced aggregation. Chemical Communications 52 (53): 8287–8290.
- 33 Yao, J., Maslov, K., Hu, S., and Wang, L.V. (2009). Evans blue dye‐enhanced capillary‐resolution photoacoustic microscopy in vivo. Journal of Biomedical Optics 14 (5): 054049–054046.
- 34 Boisselier, E. and Astruc, D. (2009). Gold nanoparticles in nanomedicine: preparations, imaging, diagnostics, therapies and toxicity. Chemical Society Reviews 38 (6): 1759–1782.
- 35 Gad, S.C., Sharp, K.L., Montgomery, C. et al. (2012). Evaluation of the toxicity of intravenous delivery of auroshell particles (gold–silica nanoshells). International Journal of Toxicology 31 (6): 584–594.
- 36 Kim, J.‐W., Galanzha, E.I., Shashkov, E.V. et al. (2009). Golden carbon nanotubes as multimodal photoacoustic and photothermal high‐contrast molecular agents. Nature Nanotechnology 4 (10): 688–694.
- 37 Pramanik, M., Song, K.H., Swierczewska, M. et al. (2009). In vivo carbon nanotube‐enhanced non‐invasive photoacoustic mapping of the sentinel lymph node. Physics in Medicine and Biology 54 (11): 3291.
- 38 Koo, J., Jeon, M., Oh, Y. et al. (2012). In vivo non‐ionizing photoacoustic mapping of sentinel lymph nodes and bladders with ICG‐enhanced carbon nanotubes. Physics in Medicine and Biology 57 (23): 7853.
- 39 Zerda, A.D.L., Liu, Z., Bodapati, S. et al. (2010). Ultrahigh sensitivity carbon nanotube agents for photoacoustic molecular imaging in living mice. Nano Letters 10 (6): 2168–2172.
- 40 Zhang, J., Zhang, J., Li, W. et al. (2017). Degradable hollow mesoporous silicon/carbon nanoparticles for photoacoustic imaging‐guided highly effective chemo‐thermal tumor therapy in vitro and in vivo. Theranostics 7 (12): 3007–3020.
- 41 Wu, L., Cai, X., Nelson, K. et al. (2013). A green synthesis of carbon nanoparticles from honey and their use in real‐time photoacoustic imaging. Nano Research 6 (5): 312–325.
- 42 Akers, W.J., Kim, C., Berezin, M. et al. (2010). Noninvasive photoacoustic and fluorescence sentinel lymph node identification using dye‐loaded perfluorocarbon nanoparticles. ACS Nano 5 (1): 173–182.
- 43 Kim, J., Lee, D., Jung, U., and Kim, C. (2015). Photoacoustic imaging platforms for multimodal imaging. Ultrasonography 34 (2): 88.
- 44 Lee, D., Lee, C., Kim, S. et al. (2016). In vivo near infrared virtual intraoperative surgical photoacoustic optical coherence tomography. Scientific Reports 6: 35176.
- 45 Park, S., Jung, U., Lee, S. et al. (2017). Contrast‐enhanced dual mode imaging: photoacoustic imaging plus more. Biomedical Engineering Letters 7 (2): 121–133.
- 46 Malard, L., Pimenta, M., Dresselhaus, G., and Dresselhaus, M. (2009). Raman spectroscopy in graphene. Physics Reports 473 (5): 51–87.
- 47 Ferrari, A.C. (2007). Raman spectroscopy of graphene and graphite: disorder, electron–phonon coupling, doping and nonadiabatic effects. Solid state communications 143 (1): 47–57.
- 48 Avti, P.K., Hu, S., Favazza, C. et al. (2012). Detection, mapping, and quantification of single walled carbon nanotubes in histological specimens with photoacoustic microscopy. PloS One 7 (4): e35064.
- 49 Frangioni, J.V. (2003). In vivo near‐infrared fluorescence imaging. Current Opinion in Chemical Biology 7 (5): 626–634.
- 50 Chen, J., Liu, C., Zeng, G. et al. (2016). Indocyanine green loaded reduced graphene oxide for in vivo photoacoustic/fluorescence dual‐modality tumor imaging. Nanoscale Research Letters 11 (1): 85.
- 51 Gao, S., Zhang, L., Wang, G. et al. (2016). Hybrid graphene/Au activatable theranostic agent for multimodalities imaging guided enhanced photothermal therapy. Biomaterials 79: 36–45.
- 52 Ge, J., Jia, Q., Liu, W. et al. (2015). Red‐emissive carbon dots for fluorescent, photoacoustic, and thermal theranostics in living mice. Advanced Materials 27 (28): 4169–4177.
- 53 Zanganeh, S., Li, H., Kumavor, P.D. et al. (2013). Photoacoustic imaging enhanced by indocyanine green‐conjugated single‐wall carbon nanotubes. Journal of Biomedical Optics 18 (9): 096006–096006.
- 54 Xie, L., Wang, G., Zhou, H. et al. (2016). Functional long circulating single walled carbon nanotubes for fluorescent/photoacoustic imaging‐guided enhanced phototherapy. Biomaterials 103: 219–228.
- 55 Kim, C., Song, K.H., Gao, F., and Wang, L.V. (2010). Sentinel lymph nodes and lymphatic vessels: noninvasive dual‐modality in vivo mapping by using indocyanine green in rats—volumetric spectroscopic photoacoustic imaging and planar fluorescence imaging 1. Radiology 255 (2): 442–450.
- 56 Park, S., Kim, J., Jeon, M. et al. (2014). In vivo photoacoustic and fluorescence cystography using clinically relevant dual modal indocyanine green. Sensors 14 (10): 19660–19668.
- 57 Zhang, Y., Zhang, H., Wang, Y. et al. (2017). Hydrophilic graphene oxide/bismuth selenide nanocomposites for CT imaging, photoacoustic imaging, and photothermal therapy. Journal of Materials Chemistry B 5 (9): 1846–1855.
- 58 Wang, C., Ma, X., Ye, S. et al. (2012). Protamine functionalized single‐walled carbon nanotubes for stem cell labeling and in vivo raman/magnetic resonance/photoacoustic triple‐modal imaging. Advanced Functional Materials 22 (11): 2363–2375.
- 59 Yang, K., Hu, L., Ma, X. et al. (2012). Multimodal imaging guided photothermal therapy using functionalized graphene nanosheets anchored with magnetic nanoparticles. Advanced Materials 24 (14): 1868–1872.
- 60 Huang, X., El‐Sayed, I.H., Qian, W., and El‐Sayed, M.A. (2006). Cancer cell imaging and photothermal therapy in the near‐infrared region by using gold nanorods. Journal of the American Chemical Society 128 (6): 2115–2120.
- 61 Tian, B., Wang, C., Zhang, S. et al. (2011). Photothermally enhanced photodynamic therapy delivered by nano‐graphene oxide. ACS Nano 5 (9): 7000–7009.
- 62 Wang, C., Tao, H., Cheng, L., and Liu, Z. (2011). Near‐infrared light induced in vivo photodynamic therapy of cancer based on upconversion nanoparticles. Biomaterials 32 (26): 6145–6154.
- 63 Cheng, L., Yang, K., Chen, Q., and Liu, Z. (2012). Organic stealth nanoparticles for highly effective in vivo near‐infrared photothermal therapy of cancer. ACS Nano 6 (6): 5605–5613.
- 64 Dolmans, D.E., Fukumura, D., and Jain, R.K. (2003). Photodynamic therapy for cancer. Nature Reviews Cancer 3 (5): 380–387.
- 65 Li, S., Chen, Y., Liu, H. et al. (2017). Graphdiyne materials as nanotransducer for in vivo photoacoustic imaging and photothermal therapy of tumor. Chemistry of Materials 29 (14): 6087–6094.
- 66 Chen, D., Wang, C., Nie, X. et al. (2014). Photoacoustic imaging guided near‐infrared photothermal therapy using highly water‐dispersible single‐walled carbon nanohorns as theranostic agents. Advanced Functional Materials 24 (42): 6621–6628.
- 67 Jia, Q., Ge, J., Liu, W. et al. (2016). Gold nanorod@ silica‐carbon dots as multifunctional phototheranostics for fluorescence and photoacoustic imaging‐guided synergistic photodynamic/photothermal therapy. Nanoscale 8 (26): 13067–13077.
- 68 Li, X., Xing, L., Zheng, K. et al. (2017). Formation of gold nanostar‐coated hollow mesoporous silica for tumor multimodality imaging and photothermal therapy. ACS Applied Materials & Interfaces 9 (7): 5817–5827.
- 69 Bao, C., Beziere, N., Del Pino, P. et al. (2013). Gold nanoprisms as optoacoustic signal nanoamplifiers for in vivo bioimaging of gastrointestinal cancers. Small 9 (1): 68–74.
- 70 Gao, D., Sheng, Z., Liu, Y. et al. (2017). Protein‐modified CuS nanotriangles: A potential multimodal nanoplatform for in vivo tumor photoacoustic/magnetic resonance dual‐modal imaging. Advanced Healthcare Materials 6 (1).