10
Functionalized Carbon Nanomaterials for Drug Delivery
Naoki Komatsu
Graduate School of Human and Environmental Studies, Kyoto University, Japan
10.1 Introduction
Chemical functionalization of nanomaterials is important to control their physical properties [1, 2]. Since their applications frequently require the homogeneity in the physical properties of the components, many precise functionalization methods for nanomaterials have been developed in view of their applications from electronics and optics to biomedicine.
Nanomedicine has been attracting growing interest in terms of therapy and diagnosis, or so called theranostics. In the field, nanomaterials play a key role and hence they are chemically functionalized frequently to meet the requirements for the purpose [3]. In the nanomaterial‐based drug delivery system (DDS), for example, the following functions are required: the nanodrug has to disperse well in the blood to avoid embolism; circulate throughout the body to avoid leaking from the pores in the blood vessel and trapping in the reticuloendothelial system; accumulate in the targeting organ or tissue; and finally, release the loaded drug.
Among the nanomaterials in the DDS, carbon nanomaterials have the following characteristic properties: (i) basically inert, but functionizable at the functional groups such as carboxylic and hydroxyl ones on the surface, edge, and defect through organic transformation; (ii) variety of options in terms of shapes including zero‐dimensional (0D, fullerenes), one‐dimensional (1D, carbon nanotubes, CNTs), two‐dimensional (2D, graphene, G), and three‐dimensional (3D, nanodiamond, ND); (iii) commercially available; and (iv) fluorescence emission from semiconducting SWNTs [4], relatively small size graphenes [5] and color center in ND [6].
The carbon nanomaterials discussed in this chapter are graphene (Section 10.2) and ND (Sections 10.3 and 10.4). Graphene has a flat and hydrophobic surface consisting of sp2 carbons. It exhibits high affinity to the flat molecules, including π‐electrons such as triphenylene, as we reported quite recently [7]. Therefore, it has been utilized as carrier for anticancer drugs with flat and hydrophobic properties. In addition, it can work as photosensitizer in photothermal therapy, making it more fascinating as a bifunctional material in cancer therapy. However, the graphene‐based carriers that have been used so far are graphene oxide (GO), because the carrier is required to have sufficient dispersibility in a physiological environment [8–10]. The direct use of pristine graphene as a drug carrier, which will be described below, is the first example, as far as we know.
On the other hand, ND has been reported to be low toxicity or even nontoxic nanomaterial [11–14]. It is composed of the curved surface and core, not the flat surface and edge for graphene. As in the case of edge and defect in graphene, the ND surface is covered with various functional groups such as carboxylic and hydroxyl groups [15]. Although ND is categorized as an inorganic nanomaterial due to its robustness and chemical stability, the surface functionalities impart the organic characteristics to ND, enabling the control of the physical property by controlling the surface functionality. Recently, surface chemical functionalization of ND has been actively investigated in view of its applications [16–19]. In this chapter (Sections 10.3 and 10.4), chemical functionalization on ND for drug carrier will be described; the requisite functions of aqueous dispersibility, targeting specificity, and cytotoxicity are imparted to ND through stepwise surface chemical functionalization.
This chapter covers synthesis, characterization, and evaluation of the following three nanodrugs: chlorin e6 (Ce6)‐loaded graphene for cancer phototherapy [20]; Pt drug‐loaded nanodiamond for cancer chemotherapy [21]; and DNA‐loaded nanodiamond for gene therapy [22].
10.2 Direct Fabrication of Graphene‐Based Composite with Photosensitizer for Cancer Phototherapy
10.2.1 Fabrication of Graphene‐Based Composite with Chlorin e6 (G‐Ce6)
Liquid‐phase exfoliation of graphite has been well‐known as a scalable and practical approach for the preparation of graphene [23, 24]. We have found that the photosensitizer, Ce6, works as an exfoliant for graphene production; the pristine graphite was directly exfoliated to few layer graphene (FLG) in an aqueous solution with the aid of bath‐sonication (Figure 10.1a). Control experiment without Ce6 was also performed under the same conditions. As shown in Figure 10.1b, blackish and colorless supernatants were obtained after centrifugation at 3000 rpm (1029 g) for one hour in the presence and absence of Ce6, respectively. Despite poor or no solubility of both components in water, the G‐Ce6 showed good aqueous dispersibility. The enhanced dispersibility of the G‐Ce6 is attributable to the polarity induced by donation and acceptance of π‐electron in the complex, as discussed in our previous papers [25, 26].

Figure 10.1 (a) Molecular structure of Ce6. (b) Pictures of supernatants after exfoliation and centrifugation in the presence (left) and absence (right) of Ce6 in H2O [20]. (See color plate section for the color representation of this figure.)
10.2.2 Characterization of G‐Ce6
Typical atomic force microscopy (AFM) images of the G‐Ce6 dispersion are shown in Figure 10.2. Most of the plates have 1.2–2.5 nm in thickness, which corresponds to that of FLG. In the scanning transmission electron microscope (STEM) image (Figure 10.3), the plates exhibit high transparency, indicating thin graphene sheets. In the absorption spectra of the G‐Ce6 dispersion (Figure 10.4a), Q(I) band of free Ce6 at 655 nm shifts bathochromically after the exfoliation and centrifugation. Because of a poor solubility of Ce6 in water, free Ce6 is considered to be precipitated out during the centrifugation process, giving only G‐Ce6 in the supernatant. In addition to the red shift and broadening of the Soret and Q(I) bands of Ce6, the large upward shift of the baseline indicates existence of a significant amount of graphene in the supernatant. The proximity of the graphene and Ce6 and the formation of the electron donor acceptor (EDA) complex are supported by fluorescence quenching, as shown in Figure 10.4b.

Figure 10.2 Typical AFM image and height profiles of the graphenes after exfoliation with Ce6 [20].

Figure 10.3 STEM images of the exfoliated graphene [20].
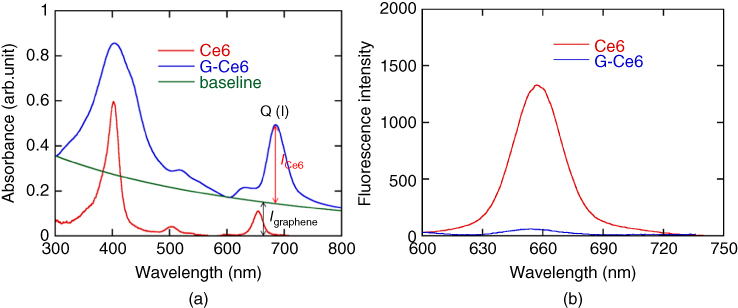
Figure 10.4 Absorption (a) and fluorescence (b, excited at 404 nm) spectra of Ce6 in H2O before and after the exfoliation of graphene. The absorbance contributed by graphene is indicated as baseline (gray trace) in the absorption spectra (a). Thin and thick arrows indicate the absorbance of Ce6 at Q(I) band and graphene at 660 nm, respectively [20].
In order to confirm the stability of the composite in water, the dispersion was monitored by the absorption spectra after one, three, and seven days (Figure 10.5). The absorbance continuously decreased for seven days, but no precipitation was observed even after more than one month. This indicates that Ce6 works not only as an exfoliant for graphite as mentioned above but also as a stabilizer for the graphene dispersion.
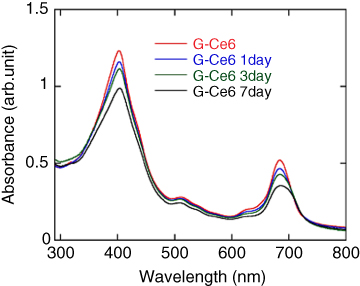
Figure 10.5 Absorption spectra of the graphene dispersion after 1, 3, and 7 days. The sample used here was prepared under the same conditions as those of the sample used for Figure 10.4. [20].
The baseline shift and peak intensity correspond to the graphene and Ce6, respectively, in the absorption spectrum (Figure 10.4a). The loading capacity is calculated to be 160 wt% in the following equations, where the extinction coefficients of Ce6 (ɑ Ce6 ) at 655 nm and graphene (ɑ graphene ) at 660 nm are 4910 and 3450 ml mg−1 m−1 , respectively, and optical path length (l) is 0.010 m.

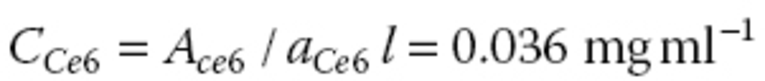

C graphene and C Ce6 denote concentrations of graphene and Ce6. Since the supernatant was diluted five times for the absorption spectra shown in Figure 10.4a, A graphene and A ce6 in the above calculation are derived from the actual absorbance of graphene (0.151) and Ce6 (0.350) in Figure 10.4a by multiplying with five.
The loading capacity of 160 wt% in the G‐Ce6 prepared in the above procedure is 10 times larger than that using functionalized GO as a carrier [27]. This is probably due to the larger flat area in the pristine graphene surface of the directly exfoliated graphene with Ce6 than that in the functionalized GO. The high Ce6 loading capacity in the G‐Ce6 is a significant advantage over the previously reported composites in addition to the facile and direct approach in our process.
In order to characterize the structure, G‐Ce6 was analyzed with Raman spectroscopy at the excitation wavelength of 488 nm. As shown in Figure 10.6a, typical Raman features of D‐, G‐, and G'‐bands were observed at 1356, 1577, and 2733 cm−1 , respectively, for the pristine graphite. After the exfoliation with Ce6, the baseline of the Raman spectrum shifts upward significantly. This is due to the fluorescence from Ce6, supporting existence of Ce6 [28]. In addition, the 2D band in the Raman spectra shifts significantly from 2733 cm−1 to 2708 cm−1 and the peak shape becomes much more symmetrical, indicating exfoliation of thin‐layer graphene. This result is consistent with those of AFM and STEM mentioned above (Figures 10.2 and 10.3). The intensity of the D band at 1356 cm−1 (I D ) relative to that of G band (I G ); namely I D /I G ratio, increases through exfoliation as shown in Figure 10.6a. This may be attributed to the edge rather than defect [29, 30], because the I D /I G ratio of the exfoliated graphene (0.21) is much smaller than those of the reduced GO (1.08–1.44) [31, 32]. Actually, the AFM and STEM observation in Figures 10.2 and 10.3 shows much smaller lateral size of the graphene than the graphite (more than 10 μm), which should increase the edge. The smaller I D /I G ratio secures higher planarity of graphene, facilitating the π−π stacking between graphene and Ce6, and thus realizing the high loading capacity (160 wt%) as mentioned above.
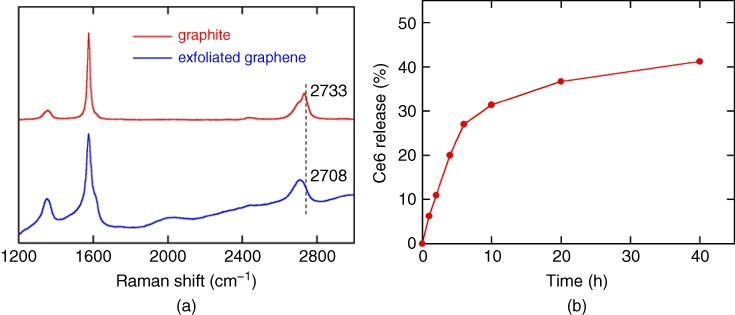
Figure 10.6 (a) Raman spectra of pristine graphite and exfoliated graphene at the laser wavelength of 488 nm. (b) The release profile of Ce6 from G‐Ce6 in PBS at pH 7.4 [20].
10.2.3 In vitro Evaluation of G‐Ce6 for Cancer Phototherapy
When the aqueous medium was replaced by phosphate buffer saline (PBS, pH 7.4) for cell experiment, no absorption corresponding to free Ce6 was observed in the absorption spectrum. This indicates that G‐Ce6 is quite stable through the medium exchange to PBS. The PBS dispersion did not show any precipitates after one week. However, drug release experiment through dialysis of the PBS dispersion of G‐Ce6 against PBS revealed that Ce6 was released gradually ( Figure 10.6b) without precipitation.
The PBS dispersion of G‐Ce6 was administered to HeLa cells with or without photoirradiation. The same experiments were also carried out using Ce6 in place of G‐Ce6. Neither free Ce6 nor G‐Ce6 exhibited any toxicity to HeLa cells at Ce6 concentration up to 0.20 μg ml−1 without light irradiation ( Figure 10.7a). In sharp contrast, significant cytotoxicity was observed in the presence of G‐Ce6 at the Ce6 concentration of more than 0.050 μg ml−1 under light irradiation. More than 96% cancer cells were killed at the Ce6 concentration of more than 0.10 μg ml−1 . This Ce6 concentration is 6–75 times less than that of other carriers such as GO [27, 33, 34], lanthanide‐doped nanoparticles [35, 36], conjugated polymers [37], and other types nanomaterials [38, 39], though some of the conditions such as laser power and kind of cancer cell are not the same. On the other hand, free Ce6 exhibited negligible cytotoxicity to HeLa cells up to 0.20 μg ml−1 even under light irradiation (Figure 10.7b). These contrast with and without carrier indicates that the Ce6 loaded on the graphene is delivered more efficiently into the cell. We could say that G‐Ce6 is one of the best phototherapeutic agents in terms of the drug‐loading capacity and the cell‐killing efficiency as well as the facile and scalable preparation process.

Figure 10.7 Cell viability of HeLa cells treated with G‐Ce6 or Ce6 at various concentrations without (a) or with (b) irradiation of 660 nm laser for two minutes. Error bars were based on four parallel measurements [20].
Since the contrast between G‐Ce6 and Ce6 under light irradiation, mentioned above, suggests a significant role of graphene for this process, the cellular uptake of Ce6 was evaluated by fluorescence activated cell sorting (FACS) of the HeLa cells treated with free Ce6 or G‐Ce6 at concentration up to 0.20 μg ml−1 under dark. Although the fluorescence intensities are proportional to the initial Ce6 concentration applied to the cells in both free Ce6 and G‐Ce6 (Figure 10.8), the fluorescence intensity is much larger in G‐Ce6 than Ce6 at the same Ce6 concentration. For example, the difference in the fluorescence intensity is two orders of magnitude with and without graphene at the Ce6 concentration of 0.20 μg ml−1 . This indicates that Ce6 supported by graphene was uptaken by HeLa cells much more than free Ce6 at the same Ce6 concentration. In other words, the graphene facilitated the uptake of the loaded drug by the cell. After being taken up as a composite, Ce6 may be released, as confirmed in the release experiment ( Figure 10.6b). Since the fluorescence of G‐Ce6 was much weaker than that of Ce6 by quenching (Figure 10.4b), the origin of the fluorescence in the FACS analysis (Figure 10.8) should be the Ce6 released from the G‐Ce6 after being taken up by the cell ( Figure 10.6b). Upon irradiation of the 660 nm laser at the cell taking up G‐Ce6, Ce6 released from G‐Ce6 inside the cell may generate reactive oxygen species (ROS) as PDT agent due to the effective absorption of the 660 nm light as shown in the black trace of Figure 10.4a. In addition, the photothermal effect of graphene may also work to kill the cancer cells upon light irradiation. Therefore, the mechanism for cytotoxicity under light irradiation shown in Figure 10.7b can be interpreted by PDT with Ce6 released from G‐Ce6, as well as by PTT with graphene complexed with Ce6 [39–42].

Figure 10.8 FACS analyses of HeLa cells after incubation with Ce6 and G‐Ce6 at various Ce6 concentrations (0.0062–0.20 μg ml−1 ) for 24 hours [20].
10.3 Polyglycerol‐Functionalized Nanodiamond Conjugated with Platinum‐Based Drug for Cancer Chemotherapy
10.3.1 Synthesis of Polyglycerol‐Functionalized Nanodiamond Conjugated with Platinum‐Based Drug and Targeting Peptide
As shown in Scheme 10.1, ND with 50 nm size (ND50) was coated with hyperbranched PG through ring‐opening polymerization of glycidol [43]. The resulting ND50‐PG dispersed stably at the concentration of ≱ 20 mg ml−1 in water; only a few or no precipitates were found over three months. While a large number of hydroxyl groups in PG gave excellent hydrophilicity, they can be utilized for further surface functionalization to add more functions.

Scheme 10.1 Surface engineering on ND50‐PG for conjugation with RGD peptide and Pt(II)‐based drug. (i) Glycidol, 140 °C, 20 hours; (ii) p‐TsCl, pyridine, 0 °C ~ r. t., overnight; (iii) NaN3, 90 °C, overnight; (iv) succinic anhydride, DMAP, pyridine, 0 °C ~ r. t., overnight; (v) RGD propargyl amide, copper(II) sulfate pentahydrate, sodium ascorbate, r. t., 48 hours; (vi) cisplatin, 0.5 M NaOH, pH 8.0, r. t., 72 hours [21].
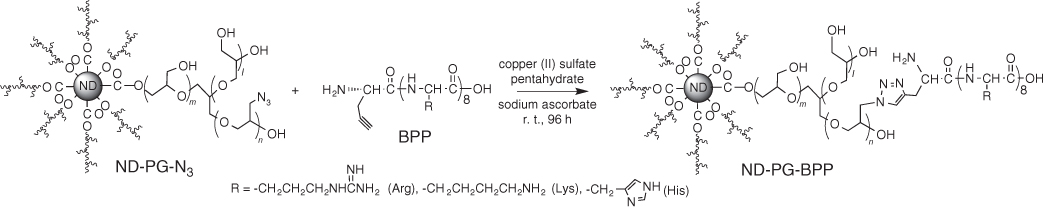
Scheme 10.2 Synthesis of ND‐PG‐BPP by click chemistry of ND‐PG‐N3 and BPP with alkynyl group [22].
In order to conjugate with a targeting peptide and load an anticancer drug, ND50‐PG was functionalized through organic transformations as shown in Scheme 10.1. After some of the hydroxyl groups of ND50‐PG were reacted with tosyl chloride (TsCl), the resulting tosylates (ND‐PG‐OTs) were substituted by azido groups to give ND‐PG‐N3 [22, 44, 45]. Carboxylic groups were introduced on ND‐PG‐N3 as ligands for the Pt‐based drug by nucleophilic ring‐opening of succinic anhydride at the hydroxyl groups [46, 47]. The resulting ND‐PG‐N3‐COOH was conjugated with RGD peptide through click chemistry of the azido groups with the propiolic amide of RGD peptide, yielding ND‐PG‐RGD‐COOH [44]. Finally, cis‐(NH3)2Pt(II) moiety was immobilized on the ND‐PG‐RGD‐COOH through ligand exchange of Cl− at the cisplatin with–COO− under a slightly basic condition, affording ND‐PG‐RGD‐Pt (Scheme 10.1) [46, 47]. ND‐PG‐Pt without RGD peptide was also prepared in a similar manner as a control from ND‐PG‐COOH.
10.3.2 Characterization of Polyglycerol‐Functionalized Nanodiamond and the Derivatives
All the ND‐based materials shown in Scheme 10.1 were analyzed with FTIR (Figure 10.9) [22, 44, 45]. The ND‐PG‐OTs was characterized with the two absorption bands at 1350 and 1176 cm−1 corresponding to asymmetric and symmetric stretchings of S=O bonds of the tosyl group, respectively ( Figure 10.9B). The substitution of OTs by N3 was confirmed clearly by disappearance of the two absorption bands of the S=O bonds and appearance of the characteristic strong absorption band at 2100 cm−1 corresponding to the azido group ( Figure 10.9C). Conjugation of carboxylic groups on the ND‐PG‐N3 was confirmed by the enhancement of the absorption band at 1730 cm−1 corresponding to the C=O stretching of carboxylic acid, while strong absorption band at 2100 cm−1 was intact (Figure 10.9D) [47]. The azido absorption band disappeared upon the click conjugation of the targeting peptide ( Figure 10.9E), indicating all the azido groups were converted to triazoles through click reaction. The immobilization of RGD peptide was verified by the absorption bands at 1650 and 1590 cm−1 , which correspond to the C=O stretching and N─H bending of amide bonds in the peptide, respectively [44]. After the drug loading, the absorption band of carboxylic acid (‐COOH) was partially consumed to give a new band at 1570 cm−1 attributed to C=O stretching of carboxylate (‐COO− ) which coordinated with the Pt(II) (Figure 10.9F).

Figure 10.9 FTIR spectra of (A) ND50‐PG, (B) ND‐PG‐OTs, (C) ND‐PG‐N3, (D) ND‐PG‐N3‐COOH, (E) ND‐PG‐RGD‐COOH, and (F) ND‐PG‐RGD‐Pt. Arrows indicate new absorption bands in each step [21].
Since only IR spectra ( Figure 10.9) is not sufficient for strict characterization of the ND50‐PG derivatives, the ND50‐PG derivatives were analyzed with solution phase 1 H‐ and 13 C‐NMR spectroscopies. Thanks to the good aqueous dispersibility (≱20 mg ml−1 ) of ND50‐PG, its derivatives shown in Scheme 10.1 also exhibited enough dispersibility to give decent NMR spectra as shown in Figure 10.10 and Figure 10.11.
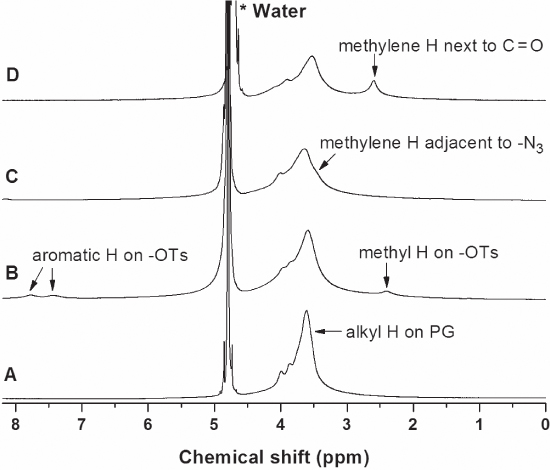
Figure 10.10 1 H NMR spectra of (A) ND50‐PG, (B) ND‐PG‐OTs, (C) ND‐PG‐N3 and (D) ND‐PG‐N3‐COOH in D2O [21].
While the PG hydrogens are observed around 3.6 ppm in all the 1 H‐NMR spectra of ND50‐PG ( Figure 10.10A) and its derivatives (Figure 10B–D) [22, 45], ND‐PG‐OTs showed the broad and relatively weak signals at 7.7 and 7.4 ppm and 2.3 ppm corresponding to the aromatic and methyl hydrogens, respectively (Figure 10.10B). Since only S=O functionality was characterized on the IR (Figure 10.9B), the 1 H‐NMR spectrum ( Figure 10.10B) complements the IR in the characterization of ND‐PG‐OTs. The NMR signals from the tosyl group disappeared after the reaction of ND‐PG‐OTs with sodium azide ( Figure 10.10C), indicating the complete substitution of the tosyl group. The shoulder appeared at ca. 3.4 ppm is assigned to the methylene hydrogens adjacent to azido groups of the ND‐PG‐N3 [45, 48], supporting the nucleophilic substitution of tosylate by azido. Introduction of carboxylic groups through ring‐opening of succinic anhydride are confirmed by a characteristic signal at 2.6 ppm (Figure 10.10D), which corresponds to the methylene hydrogens next to carbonylic groups in ND‐PG‐N3‐COOH.
13 C NMR spectra (Figure 10.11) fully support the characterization of the ND50‐PG derivatives by IR (Figure 10.9) and 1 H‐NMR spectra (Figure 10.10) mentioned above. In addition, the characteristic sp3 carbon signals of the diamond core were clearly observed at 35 ppm in all the 13 C NMR spectra shown in Figure 10.11 [49]. In the spectrum of ND‐PG‐OTs (Figure 10.11B), two kinds of the aromatic carbons and the methyl carbon at the tosyl groups are detected at 130 and 127 ppm, and 21 ppm, respectively. In the case of ND‐PG‐N3 (Figure 10.11C), the signal at 53 ppm is assigned to the methylene carbons adjacent to azido groups. In Figure 10.10, the carbons next to carbonyl groups are found at 29 ppm, and the carbonyl carbons at ester and carboxylic acid are clearly detected at 172 and 173 ppm. However, the dispersibility of ND‐PG‐RGD‐COOH and ND‐PG‐RGD‐Pt is not sufficient to give decent 13 C‐NMR spectra, because the conjugation with RGD peptide decreased their dispersibility.
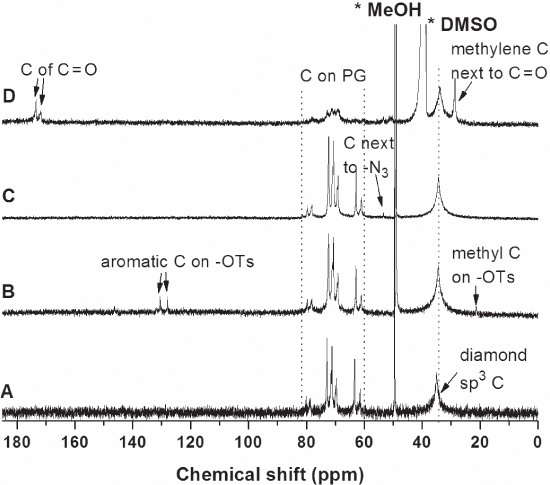
Figure 10.11 13 C NMR spectra of (A) ND50‐PG, (B) ND‐PG‐OTs, and (C) ND‐PG‐N3 in D2O and (D) ND‐PG‐N3‐COOH in DMSO‐d6 [21].
Although the aqueous dispersibility of ND‐PG‐Pt and ND‐PG‐RGD‐Pt was not sufficient for NMR analysis, they can be readily dispersed in water and Dulbecco's modified Eagle's medium (DMEM) with concentration of >1.0 mg ml−1 . The aqueous dispersions of ND‐PG‐Pt and ND‐PG‐RGD‐Pt showed a narrow size distribution with hydrodynamic diameters of 59.5 ± 14.9 and 64.1 ± 15.0 nm, respectively. The content of platinum in ND‐PG‐Pt and ND‐PG‐RGD‐Pt were estimated up to 17% and 14%, respectively, based on the measurement of inductively coupled plasma‐atomic emission spectroscopy (ICP‐AES).
10.3.3 In vitro Evaluation of Polyglycerol‐Functionalized Nanodiamond Conjugated with Platinum‐Based Drug for Cancer Chemotherapy
The drug efficacy of the Pt(II)‐based prodrugs was compared with and without ND‐PG and targeting peptide. U87MG and HeLa cells were incubated independently in the presence of cisplatin, ND‐PG‐Pt, and ND‐PG‐RGD‐Pt for 24 hours at the normalized platinum concentrations of 0–20 μg ml−1 as shown in Figure 10.12a,b. While cisplatin showed cytotoxicity to both U87MG and HeLa, ND‐PG‐Pt was almost nontoxic to both cells. ND‐PG‐RGD‐Pt exhibited sharp contrast; little toxicity for HeLa cells (Figure 10.12B), but similar toxicity to cisplatin for U87MG cells (Figure 10.12A). The cytotoxicity of these platinum drugs is found to be closely related with the platinum levels inside the U87MG and HeLa cells, which were quantified after 24‐hour treatment (Figure 10.12C). The platinum contents in both types of cells were highest upon the cisplatin treatment and lowest upon the ND‐PG‐Pt treatment. ND‐PG‐RGD‐Pt exhibited only slightly higher platinum level than ND‐PG‐Pt in the HeLa cells. In sharp contrast, the platinum level in U87MG cells treated with ND‐PG‐RGD‐Pt is significantly higher than that treated by ND‐PG‐Pt and is close to that of the cisplatin‐treated cells. We can conclude that PG surface coating has stealth effect, hence ND‐PG‐Pt avoids nonspecific cell uptake and lacks cytotoxicity in both types of cells. On this basis, ND‐PG‐RGD‐Pt is considered to enter only into U87MG, but not HeLa, by virtue of RGD targeting and releases the loaded platinum‐based drug to exert selective cytotoxicity.

Figure 10.12 (A) and (B): Cell‐killing effect of cisplatin, ND‐PG‐Pt and ND‐PG‐RGD‐Pt. Concentrations were normalized to platinum up to 20 μg ml−1 . Treatment duration was 24 hours (n = 3). (C) Platinum levels (normalized to protein concentrations) in U87MG and HeLa cells after 24‐hour treatment of cisplatin, ND‐PG‐Pt and ND‐PG‐RGD‐Pt containing 2.5 μg ml−1 of platinum. Values are means ± SD (n = 3). Student's t‐test was performed (* and # p < 0.05, ## p < 0.01) [21].
10.4 Polyglycerol‐Functionalized Nanodiamond Hybridized with DNA for Gene Therapy
10.4.1 Synthesis and Characterization of Polyglycerol‐Functionalized Nanodiamond Conjugated with Basic Polypeptides
In order to immobilize the plasmid DNA through electrostatic interaction, basic polypeptide (BPP) was conjugated onto ND50‐PG via ND‐PG‐N3. The ND‐PG‐N3 was prepared through organic transformation on the surface of ND50‐PG as shown in Scheme 10.2. The BPP with alkynyl group was reacted with ND‐PG‐N3, giving ND‐PG‐BPP (Scheme 10.2) [16, 22, 44, 50].
A series of the reactions from ND‐PG to ND‐PG‐BPP were monitored by FTIR (Figure 10.13). Similar spectra (Figure 10.13a–c) to those shown in Figure 10.9A–C were obtained in the preparation of ND50‐PG, ND‐PG‐OTs, and ND‐PG‐N3, respectively. After the click conjugation of the BPP, the azido absorption band in ND‐PG‐N3 disappeared in Figure 10.13d–f, indicating the complete conversion of azido groups to triazoles. The immobilization of polypeptides was confirmed by the absorption bands at 1650 and 1590 cm−1 , which correspond to the C=O stretching and N─H bending of amide bonds in the polypeptide, respectively. In the case of ND‐PG‐His8, absorption peaks at 624 and 657 cm−1 are attributed to C─H bending of the imidazole rings in the polyhistidine (Figure 10.13f [22]).
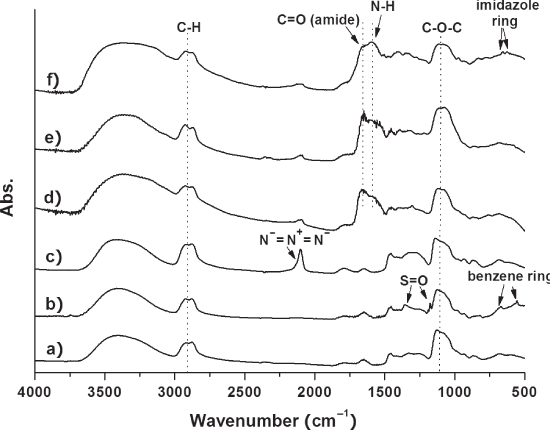
Figure 10.13 FTIR spectra of (a) ND50‐PG, (b) ND‐PG‐OTs,( c) ND‐PG‐N3, (d) ND‐PG‐Arg8, (e) ND‐PG‐Lys8, and (f) ND‐PG‐His8. Arrows indicate new absorption bands in each step [22].
The hydrodynamic diameter of ND‐PG‐BPP in water, determined by dynamic light scattering (DLS), significantly increased to larger than 150 nm (Table 10.1), indicating that ND‐PG‐BPP aggregated in the dispersions. Since ND‐PG‐BPP has positive zeta potential as shown in Table 10.1, the charges may be connected by some anions to assemble the particles. In spite of such large diameters, ND‐PG‐BPP still had dispersibility of >1.0 mg ml−1 but decreased in its stability (Figure 10.14 [22]).
Table 10.1 Hydrodynamic diameter and zeta potential of nanoparticles in Milli‐Q water.
| Nanoparticle | Hydrodynamic diameter a (nm) | Zeta potential (mV) |
| ND50 | 52.8 ± 20.3 | – 46.7 ± 3.5 |
| ND50‐PG | 66.9 ± 14.8 | – 36.7 ± 1.7 |
| ND‐PG‐Arg8 | 372 ± 105 | + 44.1 ± 1.9 |
| ND‐PG‐Lys8 | 176 ± 44 | + 38.7 ± 1.4 |
| ND‐PG‐His8 | 195 ± 64 | + 14.2 ± 0.5 |
a Mean diameter ± SD was determined by DLS on the basis of number distribution [22].

Figure 10.14 Picture of the dispersion of (a) ND50‐PG (20 mg ml−1 ), (b) ND‐PG‐Arg8, (c) ND‐PG‐Lys8 and (d) ND‐PG‐His8 (b – d, 1.0 mg ml−1 ) in water [22]. (See color plate section for the color representation of this figure.)
10.4.2 Characterization of Polyglycerol‐Functionalized Nanodiamond Hybridized with Plasmid DNA
To analyze the surface charge of the nanoparticles, the zeta potential was measured for ND50, ND50‐PG, and ND‐PG‐BPP at neutral pH in Milli‐Q water (Table 10.1). ND50 exhibited relatively high negative zeta potential of – 46.7 ± 3.6 mV probably because of acid dissociation of a large number of carboxylic groups on the surface. The PG coating of ND50 made the zeta potential slightly positive from –46.7 ± 3.6 to –36.8 ± 1.7 mV. This is probably because some of the carboxylic groups (protic functional groups) are converted to ester (aprotic ones) through the ring‐opening polymerization of glycidol. After immobilization of polypeptides, the zeta potentials turned into plus (+14.2, 38.7, and 44.1 mV) due to the protonation to the basic groups in the peptides; imidazole, amine, and guanidine. These zeta potentials of the ND‐PG‐BPP; ND‐PG‐His8 (+14.2 ± 0.5 mV), ND‐PG‐Lys8 (+38.7 ± 1.4 mV), and ND‐PG‐Arg8 (+44.1 ± 1.9 mV), are proportional to the pKa values of the side chains in these basic amino acids: His (6.0), Lys (10.5), and Arg (12.5), as shown in Figure 10.15.
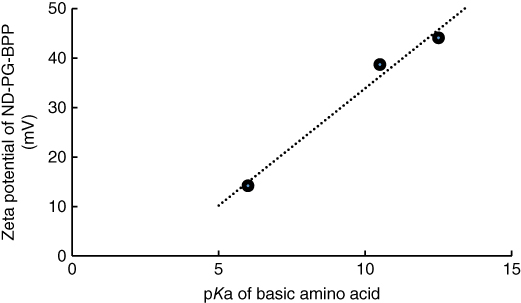
Figure 10.15 Linear relationship (correlation coefficient: 0.98) between pKa of His, Lys, and Arg with zeta potential of ND‐PG‐His8, ND‐PG‐Lys8, and ND‐PG‐Arg8.
The positive surface charge of ND‐PG‐BPP enables complexation with negatively charged DNA through electrostatic interaction. In order to confirm the DNA complexation with the ND‐PG‐BPP, we carried out an agarose gel retardation assay. The result of the electrophoresis is shown in Figure 10.16 [22]. When the weight ratio between ND‐PG‐BPP and pDNA increases, the pDNA bands become darker in the cases of ND‐PG‐Arg8 and ND‐PG‐Lys8. On the other hand, the brightness of the pDNA bands does not change in ND50‐PG and ND‐PG‐His8. These results indicate that ND‐PG‐Arg8 and ND‐PG‐Lys8 with higher positive zeta potential formed complexes with the pDNA, while ND50‐PG and ND‐PG‐His8 lacking enough positive charges were not able to form complex with the pDNA. In particular, ND‐PG‐Arg8 with the highest positive zeta potential completely retarded the pDNA at a low NP: pDNA weight ratio (30:1).

Figure 10.16 Electrophoretic migration of pDNA, NP (ND50‐PG or ND‐PG‐BPP), and NP / pDNA mixtures at various weight ratios [22].
10.5 Conclusions and Perspectives
Graphene and ND have been demonstrated to work as drug and gene carriers. From the chemical point of view, the drug and gene are immobilized in various ways. The flat π‐conjugated molecule, Ce6, was supported on the surface of graphene through van der Waals interaction. This indicates that graphene can be used as a good carrier for the drug with flat π‐conjugation, if the conjugate has good dispersibility under physiological conditions. In our case mentioned in Section 10.2, partial electron transfer may occur between Ce6 and graphene to make the composite polar and hence dispersible in an aqueous solution. The metal‐based drug like cisplatin was immobilized through coordination bonding [20]. In Section 10.3, the core was functionalized with hydrophilic polymer, PG, and the carboxylic ligand for Pt immobilization. Since the coordination bonding between carboxylate and Pt is labile under acidic conditions, Pt drug was released in lysosome and reached to nucleus to kill the cancer cells [21]. The electrostatic interaction efficiently conjugated nucleic acid, which was mentioned in Section 10.4. To immobilize plasmid having negative charge, BPP with positive charge was conjugated on the surface of the hydrophilic ND‐PG [22].
The cancer drug should be immobilized firmly to the nanocarrier, when the conjugate circulates the body through blood vessels. Once it reaches the targeted cancer tissue, the drug should be released to recognize the environmental difference in the tumor. An appropriate connectivity between the drug and the carrier is one of the key factors in the DDS.
Size and shape of the conjugates are also the point in the cancer theranostics. While EPR effect depending on nanocarrier size is well known in the targeting cancer therapy [51], the shape such as flat and sphere is not clear in the DDS efficiency. Therefore, in vivo application is required by use of the above‐mentioned three kinds of nanodrugs.
Advantage of carbon nanomaterials over other inorganic ones is in that a variety of organic reactions can be applied to the surface to impart requisite functions [15]. However, PG functionalization has been found to be employed for various metal oxide nanoparticles such as iron oxide [44, 52], titanium oxide [53], and zinc oxide nanoparticles [54]. In addition, the PG‐functionalized metal oxide nanoparticles have been derivatized in a similar manner to the ND mentioned above. Therefore, the advantage of carbon nanomaterials over inorganic ones become less significant due to the versatility of the PG functionalization. Since basic technology for engineering the surface of various nanomaterials has been established for not only nanocarbons [2, 43, 45], but also metal oxide nanoparticles [3, 44, 52–54], we should continue to apply our nanodrugs to cancer cells and mice and optimize the design of the nanodrugs.
Acknowledgments
The author thanks all the collaborators involving in the works which have been mentioned above. Especially, Dr. Li Zhao (Soochow University, China), Dr. Gang Liu (Wuhan University of Science and Technology, China) and Prof. Xiao Chen (Wuhan University, China) contributed to these works a lot. The author also acknowledges Prof. Hideto Kojima (Shiga University of Medical Science) and the following grants to promote the above research: Science and Technology Incubation Program in Advanced Region (JST) and Industrial Technology Research Grant Program (NEDO). The author also acknowledges the following grants to promote the above research: Science and Technology Incubation Program in Advanced Region (JST), Industrial Technology Research Grant Program (NEDO) and JSPS Japan‐Russia Bilateral Joint Research Program.
References
- 1 Komatsu, N. and Zhao, L. (2016). Polyglycerol‐functionalized nanoparticles for biomedical imaging. In: Carbon Nanoparticles and Nanostructures (ed. N. Yang, X. Jiang and D.‐W. Pang), 139–159. Springer.
- 2 Zhao, L. and Komatsu, N. (2015). Surface functionalization of nanodiamond for biomedical applications: Polyglycerol grafting and further derivatization. In: Chemical Functionalization of Carbon Nanomaterials: Chemistry and applications (ed. V.K. Thakur and M.K. Thakur), 650–663. CRC Press.
- 3 Zhao, L. and Komatsu, N. (2014). Synthesis, size separation, characterization and surface engineering of superparamagnetic iron oxide nanoparticles for biomedical applications. In: Magnetic Nanoparticles Synthesis, Physicochemical Properties and Role in Biomedicine (ed. N.P. Sabbas), 95–111. Nove publisher, New York.
- 4 Liu, G., Yasumitsu, T., Zhao, L. et al. (2012). Preferential extraction of left‐ or right‐handed single‐walled carbon nanotubes by use of chiral diporphyrin nanotweezers. Org. Biomol. Chem. 10 (30): 5830–5836.
- 5 Fuyuno, N., Kozawa, D., Miyauchi, Y. et al. (2014). Drastic change in photoluminescence properties of graphene quantum dots by chromatographic separation. Adv. Opt. Mater. 2 (10): 983–989.
- 6 Chang, Y.‐R., Lee, H.‐Y., Chen, K. et al. (2008). Mass production and dynamic imaging of fluorescent nanodiamonds. Nature Nanotechnol. 3: 284–288.
- 7 Liu, G. and Komatsu, N. (2016). Efficient and scalable production of 2D material dispersions using hexahydroxytriphenylene as a versatile exfoliant and dispersant. ChemPhysChem 17: 1543.
- 8 Reina, G., Gonzalez‐Dominguez, J.M., Criado, A. et al. (2017). Promises, facts and challenges for graphene in biomedical applications. Chem. Soc. Rev. 46 (15): 4400–4416.
- 9 Bitounis, D., Ali‐Boucetta, H., Hong, B.H. et al. Prospects and challenges of graphene in biomedical applications. Adv. Mater. 25 (16): 2258–2268.
- 10 Shen, H., Zhang, L., Liu, M., and Zhang, Z. (2012). Biomedical applications of graphene. Theranostics 2 (3): 283–294.
- 11 Vaijayanthimala, V. and Chang, H.‐C. (2009). Functionalized fluorescent nanodiamonds for biomedical applications. Nanomedicine 4: 47–55.
- 12 Xing, Y. and Dai, L. (2009). Nanodiamond for nanomedicine. Nanomedicine 4: 207–218.
- 13 Mochalin, V.N., Shenderova, O., Ho, D., and Gogotsi, Y. (2012). The properties and applications of nanodiamonds. Nature Nanotechnol. 7 (1): 11–23.
- 14 Schrand, A.M., Hens, S.A.C., and Shenderova, O.A. (2009). Nanodiamond particles: properties and perspectives for bioapplications. Crit. Rev. Slid State Mater. Sci. 34: 18–74.
- 15 Takimoto, T., Chano, T., Shimizu, S. et al. (2010). Preparation of fluorescent diamond nanoparticles stably dispersed under physiological environment through multi‐step organic transformations. Chem. Mater. 22: 3462–3471.
- 16 Krueger, A. and Lang, D. (2012). Functionality is key: recent progress in the surface modification of nanodiamond. Adv. Funct. Mater. 22 (5): 890–906.
- 17 Krueger, A. (2008). New carbon materials: biological applications of functionalized nanodiamond materials. Chem. Eur. J. 14: 1382–1390.
- 18 Krueger, A. (2008). The structure and reactivity of nanoscale diamond. J. Mater. Chem. 18: 1485–1492.
- 19 Krueger, A. (2008). Diamond nanoparticles: jewels for chemistry and physics. Adv. Mater. 20: 2445–2449.
- 20 Liu, G., Qin, H., Amano, T. et al. (2015). Direct fabrication of the graphene‐based composite for cancer phototherapy through graphite exfoliation with a photosensitizer. ACS Applied Materials & Interfaces 7 (42): 23402–23406.
- 21 Zhao, L., Xu, Y.‐H., Qin, H. et al. (2014). Platinum on nanodiamond: a promising prodrug conjugated with stealth polyglycerol, targeting peptide and acid‐responsive antitumor drug. Adv. Funct. Mater. 24 (34): 5348–5357.
- 22 Zhao, L., Nakae, Y., Qin, H. et al. (2014). Polyglycerol‐functionalized nanodiamond as a platform for gene delivery: Derivatization, characterization, and hybridization with DNA. Beilstein J. Org. Chem. 10: 707–713.
- 23 Ciesielski, A. and Samori, P. (2014). Graphene via sonication assisted liquid‐phase exfoliation. Chem. Soc. Rev. 43 (1): 381–398.
- 24 Du, W., Jiang, X., and Zhu, L. (2013). From graphite to graphene: direct liquid‐phase exfoliation of graphite to produce single‐ and few‐layered pristine graphene. J. Mater. Chem. A 1 (36): 10592–10606.
- 25 Rahman, A.F.M.M., Wang, F., Matsuda, K. et al. (2011). Diameter‐based separation of single‐walled carbon nanotubes through selective extraction with dipyrene nanotweezers. Chem. Sci. 2 (5): 862–867.
- 26 Peng, X., Wang, F., Komatsu, N. et al. (2009). Optical resolution and diameter‐based enrichment of single‐walled carbon nanotubes through simultaneous recognition of their helicity and diameter with chiral monoporphyrin. J. Phys. Chem. C 113 (21): 9108–9113.
- 27 Tian, B., Wang, C., Zhang, S. et al. (2011). Photothermally enhanced photodynamic therapy delivered by nano‐graphene oxide. ACS Nano 5 (9): 7000–7009.
- 28 Yang, H., Hernandez, Y., Schlierf, A. et al. (2013). A simple method for graphene production based on exfoliation of graphite in water using 1‐pyrenesulfonic acid sodium salt. Carbon 53: 357–365.
- 29 Casiraghi, C., Hartschuh, A., Qian, H. et al. (2009). Raman spectroscopy of graphene edges. Nano Lett. 9 (4): 1433–1441.
- 30 Khan, U., Porwal, H., O'Neil, A. et al. (2011). Solvent‐exfoliated graphene at extremely high concentration. Langmuir 27: 9077–9082.
- 31 Mohanty, N., Nagaraja, A., Armesto, J., and Berry, V. (2010). High‐throughput, ultrafast synthesis of solution‐ dispersed graphene via a facile hydride chemistry. Small 6 (2): 226–231.
- 32 Tung, V.C., Allen, M.J., Yang, Y., and Kaner, R.B. (2009). High‐throughput solution processing of large‐scale graphene. Nature Nanotechnol. 4 (1): 25–29.
- 33 Cho, Y. and Choi, Y. (2012). Graphene oxide‐photosensitizer conjugate as a redox‐responsive theranostic agent. Chem. Commun. 48 (79): 9912–9914.
- 34 Li, F., Park, S.‐J., Ling, D. et al. (2013). Hyaluronic acid‐conjugated graphene oxide/photosensitizer nanohybrids for cancer targeted photodynamic therapy. J. Mater. Chem. B 1 (12): 1678–1686.
- 35 Wang, C., Cheng, L., Liu, Y. et al. (2013). Imaging‐guided ph‐sensitive photodynamic therapy using charge reversible upconversion nanoparticles under near‐infrared light. Adv. Funct. Mater. 23 (24): 3077–3086.
- 36 Wang, C., Tao, H., Cheng, L., and Liu, Z. (2011). Near‐infrared light induced in vivo photodynamic therapy of cancer based on upconversion nanoparticles. Biomaterials 32 (26): 6145–6154.
- 37 Gong, H., Cheng, L., Xiang, J. et al. (2013). Near‐infrared absorbing polymeric nanoparticles as a versatile drug carrier for cancer combination therapy. Adv. Funct. Mater. 23 (48): 6059–6067.
- 38 Huang, X., Tian, X.‐J., Yang, W.‐l. et al. (2013). The conjugates of gold nanorods and chlorin e6 for enhancing the fluorescence detection and photodynamic therapy of cancers. Phys. Chem. Chem. Phys. 15 (38): 15727–15733.
- 39 Liu, T., Wang, C., Cui, W. et al. (2014). Combined photothermal and photodynamic therapy delivered by pegylated MoS2 nanosheets. Nanoscale 6 (19): 11219–11225.
- 40 Yong, Y., Zhou, L., Gu, Z. et al. (2014). WS2 nanosheet as a new photosensitizer carrier for combined photodynamic and photothermal therapy of cancer cells. Nanoscale 6 (17): 10394–10403.
- 41 Cao, J., An, H., Huang, X. et al. (2016). Monitoring of the tumor response to nano‐graphene oxide‐mediated photothermal/photodynamic therapy by diffusion‐weighted and bold MRI. Nanoscale 8 (19): 10152–10159.
- 42 Jiang, B.‐P., Hu, L.‐F., Shen, X.‐C. et al. (2014). One‐step preparation of a water‐soluble carbon nanohorn/phthalocyanine hybrid for dual‐modality photothermal and photodynamic therapy. ACS Applied Materials & Interfaces 6 (20): 18008–18017.
- 43 Zhao, L., Takimoto, T., Ito, M. et al. (2011). Chromatographic separation of highly soluble diamond nanoparticles prepared by polyglycerol grafting. Angew. Chem. Int. Ed. 50 (6): 1388–1392.
- 44 Zhao, L., Chano, T., Morikawa, S. et al. (2012). Hyperbranched polyglycerol‐grafted superparamagnetic iron oxide nanoparticles: synthesis, characterization, functionalization, size separation, magnetic properties, and biological applications. Adv. Funct. Mater. 22 (24): 5107–5117.
- 45 Zhao, L., Shiino, A., Qin, H. et al. (2015). Synthesis, characterization, and magnetic resonance evaluation of polyglycerol‐functionalized detonation nanodiamond conjugated with gadolinium(III). complex. J. Nanosci. Nanotechnol. 15 (2): 1076–1082.
- 46 Gu, J., Su, S., Li, Y. et al. (2010). Surface modification−complexation strategy for cisplatin loading in mesoporous nanoparticles. J. Phys. Chem. Lett. 1 (24): 3446–3450.
- 47 Ye, L., Letchford, K., Heller, M. et al. (2010). Synthesis and characterization of carboxylic acid conjugated, hydrophobically derivatized, hyperbranched polyglycerols as nanoparticulate drug carriers for cisplatin. Biomacromolecules 12 (1): 145–155.
- 48 Zhang, Y., He, H., and Gao, C. (2008). Clickable macroinitiator strategy to build amphiphilic polymer brushes on carbon nanotubes. Macromolecules 41 (24): 9581–9594.
- 49 Komatsu, N., Kadota, N., Kimura, T., and Osawa, E. (2007). Solution‐phase 13 C‐NMR spectroscopy of detonation nanodiamond. Chem. Lett. 36 (3): 398–399.
- 50 Meinhardt, T., Lang, D., Dill, H., and Krueger, A. (2011). Pushing the functionality of diamond nanoparticles to new horizons: orthogonally functionalized nanodiamond using click chemistry. Adv. Funct. Mater. 21 (3): 494–500.
- 51 Maeda, H. (2010). Tumor‐selective delivery of macromolecular drugs via the EPR effect: background and future prospects. Bioconjugate Chem. 21 (5): 797–802.
- 52 Zhao, L., Yang, H., Amano, T. et al. (2016). Efficient delivery of chlorin e6 into ovarian cancer cells with octalysine conjugated superparamagnetic iron oxide nanoparticles for effective photodynamic therapy. J. Mater. Chem. B 4 (47): 7741–7748.
- 53 Qin, H., Maruyama, K., Amano, T. et al. (2016). Hyperbranched polyglycerol‐grafted titanium oxide nanoparticles: synthesis, derivatization, characterization, size separation, and toxicology. Mater. Res. Express 3 (10): 105049.
- 54 Zhao, L., Takimoto, T., Kimura, T., and Komatsu, N. (2011). Polyglycerol functionalization of ZnO nanoparticles for stable hydrosol in physiological media. J. Indian Chem. Soci. 88: 1787–1790.