
Chapter 1
What are Chemical Sensors?
1.1 Chemical Sensors: Definition and Components
The definition of an electrochemical biosensors given in ref. [1] can be adapted slightly to provide a general definition of the chemical sensor as follows. A chemical sensor is a self-contained device that is capable of providing real-time analytical information about a test sample. By chemical information we understand here the concentration of one or more chemical species in the sample. A target species is commonly termed the analyte or determinand. Besides chemical species, micro-organisms and viruses can be traced by means of specific biocompounds such their nucleic acid or membrane components. Physical sensors are devices used to measure physical quantities such as force, pressure, temperature, speed, and many others.
The first (and also best known) chemical sensor is the glass electrode for pH determination, which indicates the activity of the hydrogen ion in a solution.
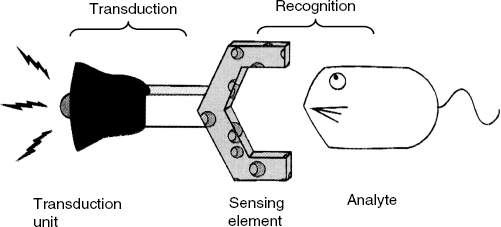
When operated, a chemical sensor performs two functions, recognition and transduction, which are exemplified by the allegory in Figure 1.1. First, the analyte interacts in a more or less selective way with the recognition (or sensing) element, which shows affinity for the analyte. The sensing element may be composed of distinct molecular units called recognition receptors. Alternatively, the recognition element can be a material that includes in its composition certain recognition sites. Beyond this, the recognition element can be formed of a material with no distinct recognition sites, but capable of interacting with the analyte. In a chemical sensor, the recognition and transduction function are integrated in the same device. An analytical device with no recognition function included is not a chemical sensor but a concentration transducer.
Figure 1.1 An allegory of a chemical sensor. A sensor is an assembly of a receptor and a signaling (transduction) unit. Adapted with permission from [3]. Copyright 1995 The Royal Society of Chemistry.
Biosensors are chemical sensors in which the recognition system is based on biochemical or biological mechanisms. It is good to be aware of the fact that synthetic, biomimetic materials, that perform in the same way as materials of biological origin, have been developed and utilized in recognition elements.
As a result of the analyte interaction with the sensing element, certain physical or chemical properties of the sensing element vary as a function of the analyte concentration. In order to allow the user to assess this variation, a chemical sensor converts the above change into a measurable physical quantity. This process is called signal transduction (or, simply, transduction) or signaling. The word transduction is derived from the Latin “transducere,” which means “to transfer or translate.” A device that translates information from one kind of system (e.g., chemical) to another (e.g., physical) is called a transducer [2].
The sensing element and the transducer can be distinct components packaged together, in direct spatial contact, in the same unit. In certain types of chemical sensor, no physical distinction between the sensing element and the transducer can be made. Notwithstanding this, a distinction between the recognition and transduction functions as particular physical or chemical processes does exist.
The concept of the molecular sensor appears often in the literature. A molecular sensor is a molecule containing two distinct units. One of them is able to bind the analyte (e.g., an ion) in a selective way, while the second unit changes some physicochemical property (e.g., light absorption or emission) in response to binding of the analyte [3]. Therefore, recognition and signaling are performed by the same molecule.
By analogy with molecular sensors, the concept of nanosensor has been developed. A nanosensor is a submicroscopic hybrid assembly including nanoparticles and molecular compounds featuring both recognition and signaling functions.
Molecular sensors and nanosensors are not chemical sensors in the sense of the above definition because the transducer is missing. Rather, such species can be considered as advanced analytical reagents. Notwithstanding this, molecular sensors and nanosensors can in principle be used to produce a true sensor upon integration with a transducer device.
The next two sections summarize the main recognition and transduction methods used in chemical sensors.
1.2 Recognition Methods
1.2.1 General Aspects
As a broad variety of recognition methods are utilized in chemical sensors, a general description of the recognition process is hardly achievable. Details on various recognition methods are given in the relevant chapters. Here, only a summary approach to this topic is presented.
A series of recognition processes occurs according to the following reaction scheme in which A is the analyte, R is the recognition receptor and P is a product of the analyte–receptor interaction:
The double arrow indicates that the recognition process is a reversible process at equilibrium. Reversibility of the recognition process arises from the fact that the product P involves noncovalent chemical bonds, such as ionic bonds, hydrogen bonds and van der Waals interactions. The recognition process can be characterized by its equilibrium constant ![]() which is defined as:
which is defined as:
where symbols c represent concentrations of the species indicated by subscripts. This equilibrium constant indicates the affinity of the recognition receptor for the analyte. Great affinity results in a high value of the equilibrium constant. If the sensor response depends on the product concentration, the response will be determined by the concentration of the analyte in the sample.
An essential characteristic of the recognition process is its selectivity, which is the capacity of the sensor to respond preferentially to the analyte and not to another species B also present in the sample and acting as an interferent. The receptor–interferent interaction can be represented as follows:
(1.3) ![]()
The affinity of the receptor for the species B is indicated by the following equilibrium constant:
(1.4) ![]()
Sensor selectivity for the analyte is determined, in general, by the ratio of the above equilibrium constants and good selectivity is obtained if ![]() . More specific definitions of selectivity are given in the chapters addressing particular classes of chemical sensor.
. More specific definitions of selectivity are given in the chapters addressing particular classes of chemical sensor.
It is important to note that certain recognition methods do not produce a well defined product, as shown in Scheme (1.1). In such cases, the interaction of the analyte with the sensing element is of a physical nature, such as gas sorption on a solid with no chemical reaction. In such cases, the monitoring of the recognition process can be performed by the measurement of a physical property of the sensing element, which depends on the analyte concentration in the sample.
The next sections present in summary form some of the common recognition methods used in chemical sensors.
1.2.2 Ion Recognition
Ion sensors were the first type of chemical sensors to be developed and produced on a large scale. The pH glass electrode was the first widely used ion sensor. It is based on the pioneering work of F. Haber and Z. Klemensiewicz (1908) and became commercially available by 1936 along with the Beckman pH-meter. Sensors for other ions (cations or anions) have been developed further.
Electric charge, which is the distinctive property of ions, is suitable for ion recognition. Therefore, ion recognition can be performed by various materials and reagents that have an electric charge opposite to that of the analyte ion.
Selectivity in electrostatic ion recognition arises from additional properties of the sensing material, such as the size of the ionic receptor site or some peculiarity of the analyte–receptor site, such as partial covalent character of the analyte–receptor bond.
Initially, ion sensors were based on solid materials, such as glass, or crystalline materials including selective recognition sites. By 1967–1968, molecular ion receptors were introduced. A molecular ion receptor can be a hydrophobic organic ion incorporated into a hydrophobic polymer membrane. As expected, this approach results in moderate selectivity. Superior selectivity has been obtained by using neutral ion receptors that interact with the analyte ion through a number of polarized atoms included in its structure.
Transduction in ion sensors is performed mostly by means of the effect of the ion charge upon the properties of the ion-recognition element. Typically, transduction in ion sensors is performed by potentiometric or optical methods.
1.2.3 Recognition by Affinity Interactions
Affinity interactions involve reversible multiple binding of two chemical species through noncovalent bonds, such as ionic bonds, hydrogen bonds, and van der Waals interactions. The product of an affinity interaction is a molecular association complex. In order for such a complex to form, the involved species should be complementary with respect to shape and chemical reactivity. For example, if one species displays a positively polarized hydrogen atom, the second one should display an electron donor atom placed such that it is able to form a hydrogen bond in the complex. The strength of the complex is indicated by its stability constant, which is similar to the equilibrium constant in Equation (1.2). Owing to the multiplicity of chemical bonding, association complexes of this type can be very stable.
Affinity interactions are very common in biological systems. An example of this type is represented by lectin proteins that recognize carbohydrates and form association complexes with such compounds.
A common type of affinity interaction is represented by the antibody–antigen interaction. Antibodies are glycoproteins produced by the immune system to identify and neutralize pathogen micro-organisms such as bacteria and viruses. The part of the pathogen that interacts with the specific antibody is called the antigen. The antibody–antigen interaction is an immunochemical reaction. Antibodies can be extracted from the blood of animals inoculated with an antigen, but can also be obtained from cell cultures.
In the clinical laboratory, immunochemical reactions are used for diagnostic purposes. Using specific antibodies as recognition receptors, pathogens can be identified. Conversely, using an antigen receptor, a specific antibody can be identified, which allows the detection of possible infection by a particular pathogen.
Besides pathogen or antibody detection, antibodies are used to recognize various protein molecules. Small organic molecules as such do not produce an immune response. However, an antibody specific for a small molecule is produced by an organism inoculated with a compound formed of this molecule attached to a protein. In this way, antibodies specific to certain small molecules can be obtained and used for analytical purposes.
Certain synthetic materials mimic the behavior of affinity reagents of biological origin. Molecularly imprinted polymers should be first mentioned in this respect. Molecularly imprinted polymers are polymeric material containing cavities with the size and shape matching the analyte molecule. In addition, the cavity includes functional groups that can bind reversibly to the analyte. Another class of synthetic affinity receptors are the nucleic acid aptamers that are synthetic nucleic acid molecules designed so as to form strong associations with certain small molecules or proteins.
All the above affinity recognition methods have found applications in the development of chemical sensors for a broad range of target species, including pathogenic micro-organisms, proteins and organic molecules.
1.2.4 Recognition by Nucleic Acids
In living organisms, nucleic acids function as supports for the storage and transfer of genetic information. In general, storage of genetic information is performed by deoxyribonucleic acids (DNAs) while transfer of information within cells is performed by ribonucleic acids (RNAs).
Nucleic acids are composed of a polymeric backbone onto which nucleobases are grafted. There are four nucleobases in DNA compositions, namely adenine (A), cytosine (C), guanine (G), and thymine (T). In RNAs, thymine is replaced by uracil (U). A sequence of three nucleobases codifies an amino acid and a sequence of nucleobase triplets codifies the primary structure of a protein.
Significantly, hydrogen bonds can only form between two distinct pairs of nucleobases, which are G-C and A-T in DNAs (or A-U in RNAs). This permits two complementary nucleic acids to form a double-strand association complex in a process called hybridization. Nucleic acid hybridization is a particular kind of affinity interaction that involves only hydrogen bonding between well-defined pairs of nucleobases.
Nucleic acid hybridization is the basis of the recognition process in nucleic acid sensors. A short nucleic acid forms the receptor (usually termed the capture probe) which is able to recognize by hybridization a particular nucleic acid sequence in the analyte nucleic acid.
Nucleic acid assays are of interest to clinical diagnosis, in the detection of genetic anomalies and also in the identification of pathogen micro-organisms. In forensic science, DNA testing assists in the identification of individuals by their particular DNA profiles.
1.2.5 Recognition by Enzymes
Enzymes are protein compounds that function as catalysts in chemical reactions occurring in living systems. The compound converted by the catalytic action of the enzyme is called the enzyme substrate. The catalytic property is selective to a particular substrate or to a particular functional group in a class of compounds.
Most chemical sensors rely on recognition processes at equilibrium as indicated by Scheme (1.1). In contrast, recognition by enzymes is a dynamic process which involves three main steps: First, the target compound (substrate) is bound to the active site of the enzyme to form a substrate–enzyme complex in a process similar to that in Scheme (1.1). The bound substrate undergoes a further chemical conversion, possibly with the participation of other coreagents. Finally, products are released and the active site of the enzyme returns to its initial state. This sequence is repeated with another substrate molecule as long as the substrate and coreagents are still present.
Many enzymes preserve their catalytic activity after isolation from a biological material and can be incorporated as recognition agents in the sensing element of a sensor. Transduction in enzymatic sensors can be achieved by measuring the steady-state concentration of a product or a coreagent involved in the enzymatic process.
There are various of enzymes in chemical sensors. First, enzymatic sensors can be designed for the purpose of substrate determination. Secondly, enzymatic sensors can be utilized in the determination of inhibitors, which are chemical species that affect the enzyme activity. Thirdly, enzymes can be employed as transduction labels in sensors based on affinity recognition. Hence, enzymes occupy a central role in the framework of chemical-sensor science.
1.2.6 Recognition by Cells and Tissues of Biological Origin
As shown before, enzymes form an important class of recognition receptors utilized in chemical sensors. Although isolated enzymes were initially used, it was soon realized that enzymes incorporated in biological materials (such as cells or tissues) can perform better due to the fact that they are in their natural environment. This leads to the development of a new class of chemical sensor in which the recognition is performed by cells or tissues of biological origin.
Application of biological cells and tissues is, however, much broader, as such entities can react to chemical stimuli by modifications in their metabolic processes. A metabolic modification leads to changes in the consumption of oxygen or to excretion of particular chemical species. Such modifications are exploited for transduction purposes.
1.2.7 Gas and Vapor Sorption
Determination of gases and vapors is a topic of great interest in various areas, including the monitoring of air quality, control of hazardous gases and vapors in industrial environmental and physiological investigations.
General recognition methods for gases and vapors are based on sorption either at the surface of (adsorption) or within (absorption) a solid material used for recognition. Depending on the target compound, various materials are used for gas and vapor recognition, including certain metals, polymeric materials or inorganic materials. Sorption can be a purely physical phenomenon or can be accompanied by chemical reactions that modify the chemical state of the analyte or that of the recognition material.
1.3 Transduction Methods
1.3.1 General Aspects
It is possible to distinguish two main transduction strategies, namely chemical transduction and physical transduction.
Chemical transduction is performed by monitoring the change in the chemical composition of the sensing element in response to the recognition process. In other words, the change in the concentration (or amount) of the product P is measured. If the primary product P is not detectable, one can resort to the monitoring of a coreagent or secondary product of the recognition process.
If none of the compounds involved in the recognition process is detectable, one can resort to product labeling by a detectable species called a signaling label (or a transduction label). The label can be a simple molecular species or a nanoparticle that can be detected by available physicochemical methods. Widely used labels are certain enzymes that allow indirect transduction. More specifically, an enzyme label catalyzes a chemical reaction that produces a readily detectable species.
Physical transduction focuses not on the chemical composition but on a specific physical property of the sensing element that is affected by its interaction with the analyte. Common physical transduction methods are based on the measurement of mass, refractive index, dielectric properties or electrical resistivity. Such methods are, as a rule, label-free transduction methods.
A brief overview of transduction methods applied in chemical sensors is given below.
1.3.2 Thermometric Transduction
A straightforward transduction method is based on the thermal effect of the recognition process, which leads to a change in the temperature. However, thermometric transduction is feasible only if the recognition is accompanied by a catalytic process, as in the case of enzyme-catalyzed reactions. Only catalytic processes generate sufficient heat to produce a measurable variation of the temperature. Thermometric transduction is also applicable in chemical sensors for combustible gases that react with oxygen at the surface of a suitable catalyst.
1.3.3 Transduction Based on Mechanical Effects
Recognition leads to a change in the overall mass of the sensing element. Mass change can be monitored by means of a mass transducer based on a vibrating piezoelectric crystal, known as the quartz crystal microbalance. The response signal of this transducer is the vibration frequency, which depends on the overall mass of the device.
More generally, propagation of mechanical vibration (acoustic waves) is affected by the change in the properties of the sensing element in response to the recognition process. For example, the speed of an acoustic wave can be modified as a result of analyte interaction with the sensing element.
Recently, a new class of mechanical transducer has been developed, namely microcantilevers. When integrated with a sensing element, a microcantilever undergoes bending as a function of the extent of the recognition process. Alternatively, vibrating microcantilevers provide information about mass change in a similar way to the quartz crystal microbalance.
1.3.4 Resistive and Capacitive Transduction
Analyte interaction with a properly selected recognition material can lead to changes in the electrical property of this material. Thus, interaction of combustible gases with semiconductor metal oxides causes the electrical resistivity to change as a function of the analyte concentration. This is the basis of resistive transduction.
Another electrical property that can be affected by the recognition process is the dielectric constant. The dielectric constant can be assessed by including the recognition material as a dielectric in the structure of a capacitor and measuring the capacitance of this capacitor. In this way, capacitive transduction is achieved.
1.3.5 Electrochemical Transduction
Sensors for aqueous solution samples can be based on electrochemical transduction methods. Electrochemistry deals with ion transport, ion distribution and electron-transfer reactions at the solution interface with a solid conductor (electrode). Besides electrolyte solutions, electrochemistry also addresses charge-transfer processes in systems involving ionic solids, which are also of relevance to certain types of chemical sensor.
Determination of ions can be achieved by means of sensors based on potentiometric transduction. The sensing element in potentiometric ion sensors is a membrane including ion-selective molecular receptors or receptor sites in a solid material. This membrane is placed between two solutions, one of them being the sample and the other one a solution containing the analyte ion at a constant concentration. Ion exchange at each side of the membrane leads to the development of a potential difference between the two sides of the membrane. This potential difference can be measured and related to the concentration of the analyte ion in the sample. Potentiometric ion sensors (commonly, but improperly designated ion-selective electrodes) form one of the main classes of chemical sensors.
An advance in potentiometric ion sensors was achieved by integrating ion-selective membranes with a semiconductor device of the field effect transistor type. In such sensors, the electric potential developed at the membrane–sample solution acts directly on the characteristics of the field effect semiconductor device.
An analogous principle is used in gas sensors based on field effect devices, with the notable exception that the gas-sensing element is formed of a metal with catalytic properties.
Potentiometric ion sensors have another important application in chemical sensors, namely they can act as transducers in sensors base on ion-generating recognition processes. Such applications refer to sensors for gases, such as carbon dioxide, ammonia, hydrogen cyanide and hydrogen fluoride that give rise to ions upon dissolution in aqueous solutions. Ion sensors are also widely used as transducers in enzymatic sensors as many enzyme reactions produce or consume certain ions (e.g., hydrogen or ammonium ions) or produce a detectable gase, such as carbon dioxide or ammonia.
Measurement of electric current forms another class of transduction method in electrochemical sensors, commonly known as amperometric sensors. The beginning of amperometric sensors is represented by the oxygen probe introduced by Leland C. Clark Jr. in 1956 [4]. This device indicates the concentration of dissolved oxygen using the electrochemical reduction of oxygen and the associated electrolytic current as the response signal. The discovery of the amperometric oxygen sensor opened the way to the development of amperometric enzymatic sensors, also pioneered by Leland C. Clark Jr. Amperometric enzymatic sensors are based on enzymes that catalyze oxidation–reduction reactions and involve a small, inorganic molecule as coreagent. Oxygen is the natural coreagent in such reactions, but it can be substituted by artificial coreagents in more advanced designs. Direct electron exchange between the working electrode of an electrochemical cell and the active site of an oxidase-type enzyme is an alternative transduction method in amperometric enzymatic sensors.
Amperometric transduction is also suited to affinity sensors provided that an electrochemically active compound is attached to the recognition product (P in reaction (1.1) and acts as an electrochemical label.
Some of the nucleobases included in the nucleic acid structure are electrochemically active and their electrochemical reactions are used to monitor the recognition by hybridization.
A series of electrochemical transduction methods are based on the concept of electrochemical impedance. The electrochemical impedance indicates the opposition to the flow of an alternating current through an electrochemical cell. Electrochemical impedance measurements provide a wealth of information about the physicochemical processes occurring in an electrochemical cell, such as ion migration, charge distribution at the electrode/electrolyte interface and the velocity of the electrochemical reaction. Each of the above processes can be related to the properties of a sensing element integrated with the electrochemical cell and used for transduction purposes.
1.3.6 Optical Transduction
Interaction of electromagnetic radiation with matter forms the basis of a broad range of analytical methods commonly known as spectrochemical methods of analysis. Commonly, electromagnetic radiation in the ultraviolet-visible-infrared domains is used for analytical purposes. Not surprisingly, a broad range of chemical sensors have been developed on the ground of interaction of the sensing element with electromagnetic radiation. Sensors based on this kind of transduction are termed optical sensors.
Optical transduction can be based on light emission or light absorption by the sensing element. Such processes are associated with transitions between energy levels of certain species (molecules or nanoparticles) included in the sensing element. The light-responsive species can be a transduction label, a coreagent or a product of the recognition process.
Optical transduction can also be achieved by monitoring a physical quantity connected to light propagation through the sensing layer, such as the refractive index. Light scattering provides additional methods for optical transduction.
1.4 Sensor Configuration and Fabrication
The final goal of sensor development is to obtain a marketable product. In order to achieve this goal, a sensor should be simple, robust and easy to use. Field applications require portable sensors, while biomedical applications often demand implantable sensors for in vivo monitoring of chemical species of physiological relevance. Miniaturization is, in this case, an essential condition. Miniaturization is also important for reducing the amount of sample required and for integration of multiple sensors in arrays in order to increase the throughput and to alleviate interferences (see Section 1.7).
Sensor miniaturization brings about an additional advantage, namely the possibility of constructing smart sensors. In a smart sensor, the sensor itself is integrated with microelectronic circuits that control the functioning parameters and perform data processing and interfacing with external readout equipment.
Good durability of a sensor is obtained, as a rule, at the price of using a more intricate fabrication technology and the consumption of expensive materials, which brings about a higher cost of the product. On the other hand, operation of a long-life sensor involves a preliminary calibration and some kind of conditioning after each run, which are not easily achievable in field or point-of-care applications. That is why it is preferable in certain cases to design cheap, disposable sensors for single-use application. As calibration of a disposable sensor is not feasible, it is essential that the fabrication technology secures very good batch reproducibility of the response characteristics.
Low cost and batch reproducibility can be obtained by excluding the utilization of hand work in the fabrication process. Advanced technologies for sensor fabrication are based on micromachining methods, initially developed in the area of microelectronic circuit technology. Micromachining allows for miniaturization and straightforward integration of multiple sensors in sensor arrays.
Chemical sensors can be shaped as a dip-in probe, similar to the well-known glass electrode for pH determination.
Very low volumes of samples can be tested by drop application onto a sensor with a flat surface, for example, a sensor formed as a thin layer on a plastic strip. This configuration is suitable for use in disposable sensors.
Facile sampling is provided by capillary fill sensors. Such sensors are formed of two sheets of glass held apart by a gap of capillary dimension. The sensor is formed as a thin layer onto the inner surface of a sheet. The sample enters the device with a reproducible volume by capillary ascension. An example of such a sensor is given in [5].
The principles of thin-layer chromatography have been applied to develop lateral flow sensors, which consists of a thin, porous layer deposited on a solid strip. Several distinct zones are formed in sequence on the strip; first a sample application pad, next, one or more zones containing reagents for chemical conditioning of the analyte, and, finally, the sensing-detection zone. When applied on the sampling pad, the sample drifts through capillary diffusion across the chemical conditioning zone and then, further to the detection zone where it is accumulated and generates the response signal.
Sequential analysis of multiple samples is best carried out by integration of the sensor in a flow-analysis system (see Section 1.8).
A generic sensor or sensor platform is a device that allows for straightforward integration of recognition receptors from a specific class in order to obtain sensors for various analytes belonging to the same class. As a rule, a generic sensor includes the transducer and additional elements (e.g., molecular linkers) that assist the integration of the receptor in an easy and rapid way. The generic sensor approach is convenient when the recognition element is not sufficiently stable. In this case, the receptor is integrated with the prefabricated generic sensor just prior to the test.
1.5 Sensor Calibration
In analytical chemistry, calibration aims at establishing an unequivocal mathematical relationship between the measured quantity and the analyte concentration [6, 7].
The output of a chemical sensor is a measurable physical quantity called the response signal. The intensity of the signal (y) is correlated with the analyte concentration in the sample (c) by means of the following general relationship:
(1.5) ![]()
Here, F(c) represents the calibration function and ![]() is the measurement error of the response. Hence, the concentration can be found from the inverse of the calibration function, which is called the analytical function or the evaluation function:
is the measurement error of the response. Hence, the concentration can be found from the inverse of the calibration function, which is called the analytical function or the evaluation function:
(1.6) ![]()
The form of the calibration function can be derived by mathematical modeling of the sensor or can be set as an empirical interpolation function. A common and very convenient calibration function is the direct proportionality relationship:
(1.7) ![]()
where a indicates the sensor sensitivity. A direct proportionality function is characterized by constant sensitivity. More generally the sensitivity is defined by the following equation:
(1.8) ![]()
In the case of a nonlinear calibration function, the sensitivity is not a constant, but depends on the analyte concentration.
The calibration function may include constant parameters that are characteristic of the sensor but are independent of the sample properties. If these parameters can be derived from fundamental physicochemical laws and general constants (e.g., gas constant, Faraday constant), one has to deal with an absolute analytical method. This situation arises very infrequently.
Often, the response depends also on specific parameters of the analyte, such as the molar absorption coefficient in measurements based on light absorption. When a known specific parameter of the analyte comes into play, possibly along with other known empirical parameters, the analytical method is a definitive measurement method.
The most common situation is that in which one or more parameters in the calibration function cannot be derived a priori. If the mathematical form of the calibration function is known, the parameters in the calibration function are determined by measurements on samples with known concentration, commonly termed reference samples or standard samples. For example, in the case of a direct proportionality function, the sensitivity can be found using the measured responses and the concentration of a reference sample. In this case, the sensitivity is the quotient of the measured signal and the known concentration. More accurately, the sensitivity is obtained as the slope of the response–concentration relationship obtained by means of a series of reference samples. This approach is a direct reference measurement.
A common case is that in which the mathematical form of the calibration function is not known. In this case, the calibration function is obtained as an empirical interpolation function. This function is obtained by fitting y–c data produced by reference samples to a selected function, such as polynomials or another suitable function. A possible interpolation function is the linear function:
(1.9) ![]()
where a0 and a1 are empirical parameters that are usually estimated by least square fitting; a1 represents here the sensor sensitivity. If the linear function applies to concentrations near to zero, a0 is the blank response. An analytical measurement based on these principles is an indirect reference measurement.
The quality of the calibration function should be validated by performing measurements on reference samples or by comparing the analysis results produced by the sensor with results obtained by an alternative analytical method. Reliable calibration is obtained by means of using reference samples with the chemical composition as close as possible to that of the unknown sample. In this way, the effect of the sample matrix on the response is corrected for.
The error of the measured concentration depends on measurement errors in both the calibration step and the sample analysis. When using a linear calibration function, the calibration error is minimal at the midpoint of the considered concentration range and increases with the distance from the midpoint. It is strongly recommended not to perform measurements outside the calibration range.
If suitable reference samples are not available, one can resort to the standard addition method, which is based on measurements on the plain sample and samples with the concentration modified in a controlled way. This method is applicable when the response is directly proportional to the analyte concentration. The response for a sample with modified concentration is:
(1.10) ![]()
where c is the unknown concentration and ![]() is the known variation in the concentration. A sequential increase in
is the known variation in the concentration. A sequential increase in ![]() gives a set of y–
gives a set of y–![]() data and the unknown concentration can be derived as the quotient of the intercept and the slope of the y–
data and the unknown concentration can be derived as the quotient of the intercept and the slope of the y–![]() straight line. Graphically, the unknown concentration can be obtained as
straight line. Graphically, the unknown concentration can be obtained as ![]() , where
, where ![]() is the
is the ![]() value at which the extended y–
value at which the extended y–![]() line intersects the horizontal axis. As this method is essentially an extrapolation method, its accuracy is poorer than that of a measurement based on reference measurements.
line intersects the horizontal axis. As this method is essentially an extrapolation method, its accuracy is poorer than that of a measurement based on reference measurements.
It was assumed in the above approach that the response of the sensor depends on the concentration of one single species in the solution. This kind of sensor is known as a zero-order sensor and the calculation of the concentration is carried out by univariate calibration ((that is, single-component calibration). Higher-order sensors are introduced in Section 1.7.
1.6 Sensor Figures of Merit
The figures of merit of a sensor indicate how much a sensor fits the expected performances as far as the quality of the results, response stability, and ruggedness under storage and operation are concerned.
Being an analytical device, the performance characteristics of a chemical sensor can be defined by parameters used in the characterization of an analytical method. A systematic presentation of these parameters is given in ref. [8], which is recommended to the interested reader for more details. A number of performance characteristics are indicated by statistical parameters that are introduced in specialized texts (e.g., [6]).
An important statistical parameter used in the assessment of the quality of analytical results is the confidence interval, which indicates the scattering of measured values. The confidence interval for a series of replicate measurements with the average ![]() and standard deviation of the mean
and standard deviation of the mean ![]() is:
is:
(1.11) ![]()
where ![]() is the confidence limit given by:
is the confidence limit given by:
Here, ![]() is the quantile of the t-distribution at the level of significance
is the quantile of the t-distribution at the level of significance ![]() (
(![]() ) and for
) and for ![]() degrees of freedom.
degrees of freedom. ![]() indicates the probability that the true mean is likely to lie within the confidence interval. t values are tabulated as a function of
indicates the probability that the true mean is likely to lie within the confidence interval. t values are tabulated as a function of ![]() and
and ![]() (see, e.g., ref, [6]). For example, if
(see, e.g., ref, [6]). For example, if ![]() is 0.05, there is a probability of 0.95 (that is, 95%) to find the mean value within the confidence interval. As indicated in Equation (1.12), a low standard deviation brings about a narrow confidence interval, which implies a low dispersion of data.
is 0.05, there is a probability of 0.95 (that is, 95%) to find the mean value within the confidence interval. As indicated in Equation (1.12), a low standard deviation brings about a narrow confidence interval, which implies a low dispersion of data.
1.6.1 Reliability of the Measurement
The terms accuracy, precision and trueness define the reliability of the analytical measurement.
The accuracy indicates the degree of concordance between the concentration determined in a single test, and the true concentration (that is, the concentration in a certified reference material). The difference between the certified and measured concentration represents the bias:
(1.13) ![]()
A bias may be due to systematic errors produced by wrong calibration or improper operation of the sensor. Human errors, instrumental or computation errors are known as gross errors and also give rise to bias. An outlier is a result that appears to deviate markedly from other members of the data sample in which it occurs. Outliers should be discarded before proceeding to data analysis.
The accuracy of one single analytical result depends on the bias and the confidence limit and is quantified as follows:
Trueness refers to a large number of replicate measurements on the same sample, giving the average concentration ![]() . Trueness is similar to the accuracy of the average concentration:
. Trueness is similar to the accuracy of the average concentration:
Precision indicates the degree of concordance between independent measurement results obtained under similar conditions. Precision of an analytical procedure is:
where ![]() is the standard deviation and
is the standard deviation and ![]() is the average of a series of replicate measurements. The numerical value of this parameter increases with decreasing
is the average of a series of replicate measurements. The numerical value of this parameter increases with decreasing ![]() , that is, the error. For error-free measurements (that is,
, that is, the error. For error-free measurements (that is, ![]() ) the precision becomes 1. The precision of an analytical result is determined by the relative confidence interval:
) the precision becomes 1. The precision of an analytical result is determined by the relative confidence interval:
Parameters defined in Equations (1.14)–(1.17) are graded on a scale extending from zero to one. For a good-quality sensor, each of the above parameter is close to one.
As a sensor may be used in the analysis of a series of samples, it is expected to maintain its calibration parameters at constant levels. If this condition is fulfilled, the sensor has a good repeatability. Sensor repeatability is checked by a sequence of measurements on identical reference samples carried out under the same conditions of measurement. Poor repeatability appears when one or more calibration parameters suffer a drift, that is a slow modification with time. The drift may be due to the alteration of the properties of the sensing element under repeated or prolonged contact with samples. Drift elimination is achieved by proper design and construction of the sensing element.
Repeatability should not be confused with reproducibility, which indicates the capacity of the sensor to give a similar result under different conditions, that is, different operators, different apparatus, different laboratories or after large intervals of time.
1.6.2 Selectivity and Specificity
An important figure of merit is the selectivity of the sensor, which indicates the extent to which a sensor can determine a particular analyte without interferences from other components of the sample. In order to account for selectivity, the calibration function should include one or more additional terms that express the interference of compounds (concomitants) accompanying the analyte in the sample. If the effect of such terms is below the accepted error level, the sensor has a satisfactory selectivity. Otherwise, the sensor delivers an incorrect result.
Interference arising from the interaction of a concomitant with the receptor site is a specific interference. If the concomitant affects the sensor response by interacting with other components of the sensing element, it produces nonspecific interference. Selectivity should be not confused with specificity, which designates ultimately selectivity and cannot be graded as it is an absolute term.
Sensor selectivity is mostly determined by the selectivity of the analyte–receptor interaction. In the early stages of chemical-sensor science, selectivity was a crucial issue and the main objective of research in this field was to find receptor materials as selective as possible for a particular analyte. As will be shown in Section 1.7, an assembly of poorly selective sensors can provide concentrations of a series of analytes by appropriate data processing methods. In this case, poor selectivity is an advantage rather than a drawback.
1.6.3 Detection and Quantification Capabilities
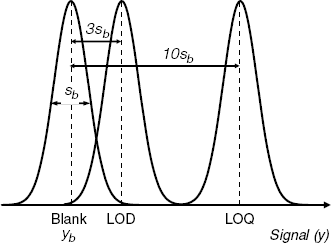
As a rule, sensors are expected to determine concentrations above a specified level. The lowest concentration level at which the sensor still provides reliable results represents the limit of detection (LOD). LOD is the lowest concentration or quantity of a substance that can be distinguished from the absence of that substance (a blank value) within a stated confidence limit. The meaning of terms included in the definition of the LOD is demonstrated in Figure 1.2. If ![]() and
and ![]() are the mean value and the standard deviation of the blank measurements, respectively, the signal giving the limit of detection is:
are the mean value and the standard deviation of the blank measurements, respectively, the signal giving the limit of detection is:
Figure 1.2 Definition of the limit of detection (LOD) and limit of quantification (LOQ). Curves represent the normal (Gaussian) distribution of errors.
(1.18) ![]()
where k is a numerical factor chosen according to the confidence level desired. As a rule, k = 3. The LOD in terms of concentration is obtained from the ![]() value using the calibration function of the sensor. The definition of the LOD proves that this parameter depends on two factors: the blank response and its standard deviation. A good (that is, very low) LOD is obtained if the blank response is very low and the accompanying noise (which determine the
value using the calibration function of the sensor. The definition of the LOD proves that this parameter depends on two factors: the blank response and its standard deviation. A good (that is, very low) LOD is obtained if the blank response is very low and the accompanying noise (which determine the ![]() value) is also very low. Sensor LOD can depend on both the particular features of the recognition process and the intrinsic LOD of the transduction method.
value) is also very low. Sensor LOD can depend on both the particular features of the recognition process and the intrinsic LOD of the transduction method.
More reliable analytical results are obtained when the concentration is above a higher limit, called the limit of quantification (LOQ). This limit corresponds to a signal that differs from the blank average by ![]() .
.
It is clear that the detection limit depends on the fluctuations in the blank signal. Blank fluctuations may arise from random processes in the sensor functioning (sensor noise) and also from electronic noise in the readout equipment.
The sensor sensitivity, which has been already introduced in Section 1.5, reflects the change in the response produced by a unit variation in the concentration. Clearly, the LOD is connected with the sensitivity, as the LOD is obtained by multiplying the ![]() value with the sensitivity. Often sensitivity is associated with the detection capability. This misuse is not recommended by IUPAC.
value with the sensitivity. Often sensitivity is associated with the detection capability. This misuse is not recommended by IUPAC.
Every type of sensor can detect concentrations within a more or less wide range of concentrations, which is known as the response range (or concentration domain). The lower limit of the response range is the LOD introduced earlier; a more accurate designation of this parameter is the lower limit of detection. The upper limit of the concentration range is the concentration at which the response deviates significantly from the assumed calibration function. For example, a marked deviation from a linear calibration function determines the upper limit of detection. This deviation can be determined by various factors, such as the saturation of the receptor sites with analyte. The ratio between the upper and lower detection limits represents the dynamic range of the sensor. A response range of about one order of magnitude (that is, a dynamic range of about 10) is a minimal requirement.
Another figure of merit connected to the sensitivity is the resolution. The resolution of a sensor is the smallest detectable change in analyte concentration. It depends on two factors: the noise and the sensitivity. The noise determines the smallest detectable change in the response and the resolution is the ratio between this response variation and the sensitivity. A high sensitivity and a low noise level brings about a high resolution. Although this definition is reminiscent of the LOD definition, the resolution is not similar to the LOD because the noise in the presence of the analyte can differ from the blank noise.
1.6.4 Response Time
As a rule, a sensor is used to carry out sequential analysis of a series of samples. The throughput of the analytical process is determined by the time required by additional operations, such as sensor cleaning, sample conditioning, and sample introduction. The response time of the sensor may also determine to a certain extent the throughput. The response time is the time elapsed since the analyte is added to a well-stirred, analyte free solution, to the moment when the sensor response attains a practically constant value. During this time interval, the sensor functions in the transitory regime. The response time can be determined by the velocity of the analyte diffusion to the receptor sites or by the rate of analyte interaction with the receptor, or both. A response time below 1 min is excellent, and a response time of about 10 min is still satisfactorily. Much longer response times, in the range of tens of minutes, are still accepted if the nature of the physicochemical processes in the sensor do not permit improvements.
1.7 Sensor Arrays
Sensor arrays are assemblies of multiple sensors. If all sensors in the array are similar and respond to one single analyte, the array is useful for parallel analysis of multiple samples, each sample being applied to one of the sensors.
Sensor arrays can be designed for performing simultaneous determinations of multiple analytes in a sample (multiplexing). If each sensor is selective to a particular analyte, it acts independently of the other ones and provides a particular analyte concentration. However, this needs advanced selectivity which can be achieved only with a limited number of recognition methods.
A more general approach is based on arrays composed of poorly selective (cross-selective) sensors. In this case, each sensor responds to more than one sample component and the response of each sensor is a summation of the effects exerted by a series of components.
1.7.1 Quantitative Analysis by Cross-Sensitive Sensor Arrays
In order to determine the concentration of each analyte, the composite response should be processed by statistical methods known as multivariate data analysis methods Application of such methods to analytical chemistry is one of the objectives of Chemometrics [9]. An alternative approach to the analysis of data produced by a sensor array is based on artificial neural networks.
This section introduces some elements of multivariate data analysis. Suppose that the array includes n cross-selective sensors that respond linearly to m analytes in a certain sample k. Further, suppose that the response of each sensor to a particular analyte is directly proportional to the concentration of that analyte (![]() ), the proportionality constant (called sensitivity) being
), the proportionality constant (called sensitivity) being ![]() . Finally, assume that the overall signal produced by one sensor (
. Finally, assume that the overall signal produced by one sensor (![]() ) results by the superposition of the response to each analyte (
) results by the superposition of the response to each analyte (![]() ). Then, sensor responses are given by the following set of equations:
). Then, sensor responses are given by the following set of equations:
(1.19) 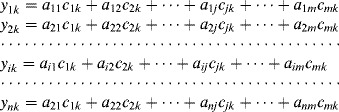
If N samples are analyzed with the same array, N similar systems of equations, with ![]() should be written. This assembly of systems of equations, which represents the mathematical model of the array response, can be written in a condensed form using matrix notation, as follows:
should be written. This assembly of systems of equations, which represents the mathematical model of the array response, can be written in a condensed form using matrix notation, as follows:
Here, Y is the matrix including the response of n sensors to N samples. In this matrix, each column includes the responses associated with a particular analyte in a given sample, while each row represents the response of individual sensors to different analytes in the same sample. A is the sensitivity matrix, composed of the ![]() terms and C is the concentration matrix which contains the known concentrations of m analytes (rows) in N samples (columns). Equation (1.20) is used in the calibration stage to obtain the sensitivity matrix using samples of known concentrations. Concentrations in a set of N′ unknown samples can be predicted from the matrix of the sensor responses for the unknown samples Ys by the following matrix operation:
terms and C is the concentration matrix which contains the known concentrations of m analytes (rows) in N samples (columns). Equation (1.20) is used in the calibration stage to obtain the sensitivity matrix using samples of known concentrations. Concentrations in a set of N′ unknown samples can be predicted from the matrix of the sensor responses for the unknown samples Ys by the following matrix operation:
Here, e is the residual matrix, a residual being the difference between measured and model data. B is a prediction matrix. When the number of sensors in the array exceeds the number of analytes present in samples (that is, n > m), the B matrix is obtained from the sensitivity matrix A as:
(1.22) ![]()
where AT is the transpose of the sensitivity matrix. Although sensor arrays with n = m can be used, arrays with n > m allow for more reliable data processing.
Equation (1.21) can be handled by multilinear regression analysis (MLR), but more reliable methods are based on data compression. In such methods, the number of variables is reduced by forming new variables as linear combinations of original variables. The new variables are called principal components and the pth principal component can be expressed as:
(1.23) ![]()
The coefficients ![]() are selected so that
are selected so that ![]() complies to certain statistical conditions. Methods of this type are the principal component regression (PCR), and the partial least square regression (PLS).
complies to certain statistical conditions. Methods of this type are the principal component regression (PCR), and the partial least square regression (PLS).
As the array response to one single sample is a single-dimensional matrix (that is, a vector) a sensor array forms a first-order sensor. A second-order sensor can be obtained by recording each sensor signal as a function of the time and the response to one single sample is collected in the form of two-dimensional matrix. In a three-dimensional representation, the array response appears as a surface on which each point is determined by two variables: the numerical identifier of the sensor and the time of the measurement. Therefore, such a sensor array is operated in the transient regime. When used in the equilibrium state, the array functions as a first-order sensor. Compared with zero-order sensors (that is, one single sensor responding to one single analyte) higher-order sensors provide a considerably larger amount of information.
It is of interest to point out the advantages of multivariate data analysis over the univariate analysis method [10]. In the univariate method it is assumed that each sensor responds to one single analyte. However, the response can be affected by interferences and noise. In contrast, multivariate analysis provides interference-free results even if interferences in the recognition process do occur. This characteristic relieves the sensor from stringent selectivity, which is often difficult to achieve. In addition, multivariate analysis contributes to noise reduction and allows outliers to be detected. Last but not least, multivariate analysis permits simultaneous determination of a number of analytes in a mixture. A comprehensive overview of sensor array calibration is presented in ref. [11].
1.7.2 Qualitative Analysis by Cross-Sensitive Sensor Arrays
Arrays of cross-sensitive sensors can be used to identify particular mixtures of analytes in accordance with the array response to the mixture. Such a device can mimic the smell (artificial nose [12, 13]) or the taste (artificial tongue [14, 15]). In other words, an artificial nose or an artificial tongue performs the classification of a series of samples according to their similarity in chemical composition.
As an example, classification of mineral waters using an array of nonselective ion sensors is introduced next. Sensor responses are used to calculate 3 principal components (PC1, PC2, and PC3). In a three-dimensional plot, each sample is represented by a point defined by the values of the characteristic principal components, as shown in Figure 1.3A. The degree of similarity of two samples is expressed by the distance between the respective points. It is evident that various samples of the same trademark are grouped in well-defined clusters. If the sample is contaminated by a minute amount of organic matter, the cluster shifts, as indicated by the arrow in Figure 1.3A and contaminated samples form new clusters, labeled by the prefix c in front of the product name.
Figure 1.3 Applications of artificial nose/tongue devices. (A) Classification of different kinds of Italian mineral waters using the artificial tongue. Arrows indicate the shift of clusters as a result of contamination with organic compounds. (B) Classification of liquors (3 samples of each brand) by hierarchical cluster analysis. (A) Reproduced with permission from [16]. Copyright 2000 Elsevier. (B) Reproduced with permission from [17]. Copyright 1991 Elsevier.
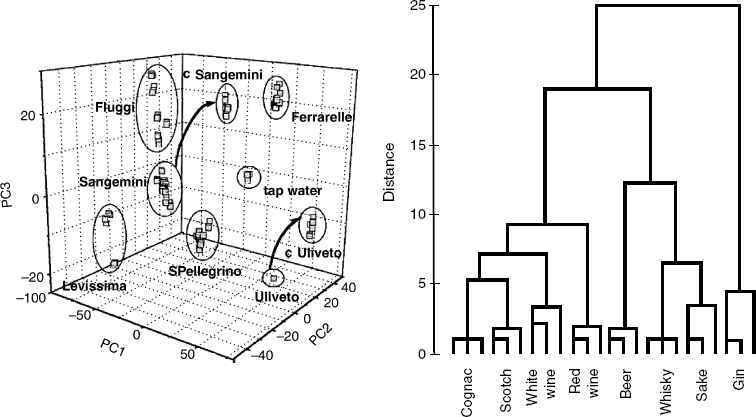
Principal component analysis is advantageous in that a small number of variables are representative for a large set of original data. This allows for easy visualization and interpretation of data and reliable classification and identification of samples.
Another possible representation of data produced by the artificial nose or tongue is demonstrated in Figure 1.3B. This figure presents the results obtained by sensing vapors evolved by various liquors. An array of 6 nonspecific gas sensors has been used to this end. For each sample, the principal components are derived and used to calculate the distance from other samples. The array output is represented by means of hierarchical cluster analysis that can sort the samples in the form of a tree (dendrogram) based on the distances between them. Similar information can be obtained by pattern-recognition analysis of gas-chromatography data, but the artificial nose approach is simpler and faster.
Data-processing methods presented earlier belong to the class of pattern-recognition methods [18]. Pattern-recognition methods perform classification by assigning each sample to a particular class.
1.7.3 Artificial Neural Network Applications in the Artificial Nose/Tongue
An artificial neural network is a mathematical model or computational model that is inspired by the structure and functional features of the brain [18, 19]. A neural network consists of an interconnected group of artificial neurons. The transmission line between two neurons is a synapse. A single neuron receives a series of input variables that are weighed along the synapses and then added. The resulting sum is transformed by application of a transfer function (e.g., multiplication with a constant or application of a nonlinear function). The result of the transformation forms the output signal of the neuron.
In order to obtain a neural network, artificial neurons are assembled in a sequence of layers, so that the output signals from a layer are fed to the neurons in the next layer. The last layer in the sequence provides the network output.
In artificial nose applications, the input signals are provided by the array's sensors. Before being used, a neural network is trained by means of a number of known compounds. In this process weighting factors are adjusted so as to minimize the difference between the actual output and the predetermined one. After this learning step, the network is able to determine these compounds.
Compared with the methods introduced earlier, artificial neural networks have a number of possible advantages. Artificial neural networks are adaptive systems that change their structure based on external or internal information that flows through the network during the learning phase. They are usually used to model complex relationships between inputs and outputs or to find patterns in data. A disadvantage of neural networks is the long training time needed by large networks. Notwithstanding this, artificial neural networks are very valuable tools for data processing in artificial olfaction and tasting.
1.7.4 Outlook
Sensor arrays allow for multiplexing the sample analysis. Particularly advantageous are the arrays of cross-sensitive sensors that provide more accurate and reliable results as compared with sensors dedicated to a particular analyte.
Arrays of cross-sensitive sensors can be operated in the artificial nose/tongue mode. Rather than detecting specific components, the artificial nose/tongue assigns the sample a characteristic fingerprint that depends on the overall chemical composition of the sample. In this way, it is possible to perform sample classification and identification.
There are a broad range of applications of the artificial nose/tongue in various areas [13]. Quality and organoleptic properties of foodstuff and beverages as well as aging or adulteration can be assessed by the assay of a characteristic assembly of chemical components. In medicine, the artificial nose can be useful for noninvasive diagnostic by the assay of volatile compound mixtures in breath, urine or sweat. Monitoring of pollution of air or water is another promising application of artificial olfaction. In the safety area, the artificial nose is a promising tool for the detection of chemical or biological warfare agents and detection of drugs or explosives.
Details of recognition and transduction methods in the artificial nose/tongue are presented in a further chapter dealing with various kinds of chemical sensors. The physicochemical principles of various types of gas sensor used in artificial noses are surveyed in refs. [12, 20]. Overviews of the calculation methods for data processing in artificial nose application is given in refs. [12, 21].
1.8 Sensors in Flow Analysis Systems
As very often a sensor or a sensor array is used in the analysis of a number of samples, automation of the operation sequence is essential for obtaining high sample throughput and reduction in personnel cost.
A common automation method in the analysis of liquid samples is flow injection analysis (FIA) [22, 23]. In this method, the sensor is installed in a flow cell through which a fluid is continuously pumped. The sample is injected by means of a liquid chromatography valve (rotary valve) and is carried in the form of a plug inserted into the flowing carrier stream. Owing to diffusion, the sample is dispersed laterally, producing a variation in the concentration along the plug. When it reaches the sensor cell, the sample generates a signal that varies with time from the background level to a maximum value and then decreases as the sample plug leaves the cell. Either the peak height or the area of the signal–time curve can be correlated with the analyte concentration.
FIA produces reliable results if the fluid flow is laminar, which requires tubing diameter to be about 0.5 mm. A high degree of automation is achieved in FIA by integrating units for sample introduction and preliminary treatment of the sample. Moreover, FIA offers the possibility of running sequentially various steps such as sample assay, cell cleaning, and sensor regeneration.
A sensor designed for FIA application can be flat shaped or in the form of a flow-through channel with the sensing element on the inner wall.
Advanced methods for flow analysis are based on microfluidics systems [24]. Microfluidics deals with control and manipulation of fluid volumes in the submicroliter region that are constrained to very small size channels. Fluid flow can be prompted by applied pressure or electrokinetic phenomena. What distinguishes microfluidic systems from traditional flow analysis systems is the integration of a large network of channels and other microdevices (such as actuators and valves) on a small chip. Therefore, microfluidics allows for a large-scale parallelization and multiplexing of flow analysis. An essential advantage of microfluidics is its compatibility with micromachining technology.
The advent of microfluidics prompted a revolution in the field of automatic analytical chemistry by the development of micro-total analytical systems (μTASs), also known as lab-on-a-chip systems. [25, 26]. μTASs allow miniaturization and integration of complex functions, including physical and chemical conditioning of the sample, separations and analyte detection within the confines of a single chip. These systems can be accurate, reliable, rugged, and inexpensive, and, therefore, are well suited to point-of-care testing or field applications.
1.9 Applications of Chemical Sensors
In general, chemical sensors have been developed to provide alternatives to standard analytical methods based on techniques such as spectrometry, chromatography, biochemical or microbiological techniques. A chemical sensor can provide an inexpensive solution to a particular analytical problem without the need for expensive, multifunctional analytical equipment.
In addition, chemical sensors are suitable for field chemical analysis in environmental investigations. In medicinal applications, chemical sensors are useful in decentralized clinical investigations (point-of-care applications).
Chemical sensors offer the possibility of monitoring chemical parameters in industrial, environmental and medial applications. Of great interest is the application of chemical sensors to the in vivo determination and monitoring of chemical species of physiological relevance.
The use of sensors is faster than are conventional chemical, biochemical or microbiological assays. Therefore, it is not surprising that chemical sensors have found a broad range of applications in various areas such as monitoring of environment quality, clinical investigations, food technology and detection of warfare agents. The next sections outline certain typical analytical problems that can be tackled by means of chemical sensors. Surveys of chemical-sensor applications are available in refs. [27, 28].
1.9.1 Environmental Applications of Chemical Sensors
Environmental applications of chemical sensors focus mainly on assessing water quality and air pollution [29–31].
Air pollution by automotive traffic and industrial activities is caused by toxic gases (sulfur, nitrogen and carbon oxides, hydrogen cyanide, etc.), toxic inorganic vapors (e.g., mercury) and other toxic vapors. Of particular relevance is the control of industrial environmental pollution caused by hazardous gases and vapors, such as those which are toxic, flammable or explosive. The quality of indoor air can be assessed by means of sensors for carbon dioxide and water vapor (humidity).
Water pollution directly affects aquatic organisms and, more generally, any organisms that need water for survival. The main water pollutants addressed by chemical sensors are toxic ions (e.g., mercury, lead, cadmium, and cyanide ions) and ions originating from agriculture activities. The use of fertilizers can lead to contamination of water sources by nitrate and phosphate ions that can disrupt aquatic ecological systems. Agriculture is also a source of water pollution by toxic pesticide residues. In addition to the general environmental impact, water quality is also a crucial issue in the supply of drinking water.
Various toxic compounds in water can be assessed by means of their inhibiting effects in enzyme-catalyzed reactions [32]. Organic pollutant sensors have also been developed using specific antibodies as recognition reagents.
Ion determinations can be achieved by standard potentiometric ion sensors, but, due to their high limits of detection, such sensors are suited only for the analysis of heavily polluted waters. However, recent progress in this field has led to the development of ion sensors with a very low limit of detection that can tackle determinations of metal ions below the concentration limit imposed by legal regulations for drinking water quality.
Sensors for toxins have been developed using micro-organisms as the sensing elements. Micro-organism metabolism is affected by toxins in the sample, which allow the monitoring of toxin concentrations by means of oxygen consumption in micro-organism respiration. The same principle has been used to develop sensors for the total content of dissolved organic material in water samples. In this case, dissolved organics stimulate the metabolism and hence oxygen consumption. Genotoxicity of environmental samples can be assessed by means of nucleic acid sensors [33].
The determination of possible pathogen micro-organisms in water is another important application that can be addressed by means of antibody-based sensors [34, 35].
A problem of a great concern is acid rain caused by energy production by using fossil-fuel combustion. Common acidity sources are nitrogen and sulfur oxides that lead to increased acidity upon dissolution in atmospheric water. Increased acidity can be detected in an indirect way by monitoring the content of specific anions such as nitrite and sulfate.
A series of analytical problems in Marine Science are well suited to the application of chemical sensors [36, 37]. Typical examples are the control of eutrophication due to increased concentration of nitrate and phosphate ions from fertilizers or sewage, monitoring of pollution by pesticides or by water diverted from oil extraction platforms, and determination of trace metals.
1.9.2 Healthcare Applications of Chemical Sensors
One of the main fields of application of chemical sensors is healthcare in which chemical sensors are utilized for in vitro or in vivo determination of chemical species of physiological relevance [38]. The functioning of in vivo sensors depends to a large extent to their biocompatibility [39]. As in vivo applications are very common, miniaturized sensors have been designed to this end. Often, multiple sensors are employed in order to determine simultaneously a series of various target analytes. Moreover, chemical sensors are used to detect pathogenic micro-organisms in clinical investigations.
Alkali and alkali-earth ions, as well as inorganic gases (dissolved oxygen and carbon dioxide, nitrogen monoxide), can be determined by means of dedicated sensors. Often, multiple sensors are employed in order to determine a series of target analytes.
Glucose determination in blood is very important in diabetic health care [40, 41]. Currently, glucose sensors for self-monitoring of glucose in blood are widely available and intensive research efforts are devoted to the development and improvement of in vivo glucose sensors [42]. The next step in this area is the integration of glucose sensors with insulin delivery systems in order to maintain automatically the insulin level in blood at the normal level.
Sensors for a great number of biogenic compounds have also been developed. Among many target compounds, L-lactate, pyruvate, urea, uric and oxalic acids, histidine and histamine, phenolic compounds (L-dopa, dopamine and adrenalin), superoxide and sulfated bile acids can be mentioned. Dedicated sensors allow the monitoring of drugs in blood or urine.
Detection of pathogenic bacteria and viruses is another application of chemical sensors in clinical investigations. Pathogens can be detected by either immunological sensors or by nucleic acid-based sensors [35].
Normal biological processes, pathogenic processes, or pharmacologic responses to a therapeutic intervention can be assessed by means of biomarkers that are substances used as indicators of pathological states. Chemical sensors for biomarkers have been developed for the diagnostic of various forms of cancer, cardiovascular diseases, and hormone-related health problems [43].
1.9.3 Application of Chemical Sensors in the Food Industry, Agriculture and Biotechnology
Various chemical sensors have been developed in order to assess the quality of foodstuff and beverage quality and also for monitoring industrial processes in the food industry and biotechnology. Applications of enzymatic sensors in the food and drink industry are surveyed in refs. [44, 45].
Food quality depends to a large extent on the content of nutrients and vitamins. Saccharides (such as glucose, fructose, sucrose, and lactose) can be determined by means of enzymatic sensors based on specific enzymes that produce chemical conversion of the target compound.
Other important components of foodstuff are lactic acid, malic acid, citric acid, and glutamic acid. Various enzymatic sensors for such compounds have been developed using relevant enzymes.
An important quality parameter of foodstuff is its freshness. Foodstuff freshness can be assessed by measuring the concentration of typical products of the spoilage process. Meat spoilage can be assessed by means of enzymatic sensors for putrescine (NH2(CH2)4NH2) and hypoxanthine (a purine derivative). Fish freshness can be assessed by determining a series of spoilage products such as inoxine-5-phosphate, inosine, and hypoxanthine [46].
Sensors for other compounds of relevance to food quality (such as cholesterol, fatty acids, lecithin, choline and polyphenols) have also been designed.
Of particular importance in the food industry is the control of pathogenic micro-organisms and microbial toxins in foodstuffs [34, 35, 47]. Chemical sensors for pathogens can be developed using either antibody–antigen recognition or by detection of the specific DNA.
In the beverage industry, dedicated chemical sensors can be used to determine ethanol and also glycerol, the latter being the main secondary product of alcoholic fermentation. Enzymatic sensors for both the above species have been produced. The content of sulfite ion in wine can also be determined by means of enzymatic sensors.
In agriculture, chemical sensors are employed in monitoring of macronutrients such as nitrate, phosphate and potassium ions [48].
Biotechnology uses biological systems, living organisms, or derivatives thereof (e.g., enzymes or living cells) to process raw materials. Various chemical sensors are used to monitor process parameters such as pH, dissolved oxygen, carbon dioxide, and various bio-organic compounds such as saccharides and amino acids [49, 50]. Typical applications of chemical sensors in biotechnology are found in fermentation industry and production of certain antibiotics.
1.9.4 Chemical Sensors in Defense Applications
Defense in general, and defense against terror attacks in particular, is currently a matter of great concern that has prompted the development of chemical sensors for explosives and warfare agents such as pathogenic micro-organisms and toxic gases. Fast, in situ, detection of such matters is conveniently handled by means of chemical sensors.
Explosives can be traced using sensors specific to the explosive vapors. Such sensors have been developed using natural and synthetic affinity recognition reagents, enzymes and whole cells [51].
Biological warfare agents include living organisms, including viruses or infectious material derived from them, which could be used for hostile purposes. The targets of biological warfare agents can be humans, animals and crop plants. Such agents can multiply in the attacked organism and cause disease or death. Pathogenic bacteria, viruses and certain fungi are typical biological warfare agents.
Various types of chemical sensor for detection of biological warfare agents have been developed using various recognition mechanisms, such as affinity recognition by antibodies or synthetic materials, recognition by enzymes or whole cells, and the tracing of the pathogen DNA by means of a complementary DNA sequence [52, 53]. Application of nanomaterials in sensors for biowarfare agents is currently arising much interest [54].
1.10 Literature on Chemical Sensors and Biosensors
As there is a vast amount of literature dealing with chemical sensors and biosensors, this section introduces only several general texts and certain relevant journals. References dealing with particular kinds of sensors are included in pertinent chapters.
The first monograph on chemical sensors was issued by J. Janata in 1989 [55]. A revised edition of this text become available recently [56].
By 1990, the field of biosensors attained the maturity and has been surveyed in a series of monographs published by E. A. H. Hall [57], F. W. Scheller and F. Schubert [58], and A. J Cunningham [59].
The status of chemical-sensor science and technology by about 1985–1995 is comprehensively surveyed in several collective volumes (refs. [60–64]). More recently, comprehensive collective volumes dedicated to biosensors [65, 66] and electrochemical sensors [67] have been published.
Overviews of recent advances in chemical sensors are available in the continuing Springer Series on Chemical Sensors and Biosensors edited by G. Urban. Progresses in materials for chemical sensors as well as chemical sensors technology are amply surveyed in the series entitled Chemical Sensors edited by G. Korotcenkov and issued by Momentum Press (2010–2012).
Chemical sensors are amply represented in encyclopedic texts on physical and chemical sensors such as ref. [68].
Of great utility are collections of commented protocols for chemical sensor fabrication. Protocols for various kinds of biosensors are available in refs. [69–71]. Collections of protocols focusing on particular kinds of chemical sensors are referred to in pertinent chapters.
The development and expansion of chemical-sensor applications prompted the publication of several texts suitable for educational purposes (e.g., refs. [72–75]). A comprehensive overview of various kinds or recognition receptor used in chemical sensors is available in ref [76].
Research papers and reviews on chemical sensors are currently published in various journal. Two journals specialized on chemical sensors should be first mentioned, namely:
There are also some journals profiled on both chemical and physical sensors; for example:
A great number of chemical sensor papers appear in journals profiled on general analytical chemistry such as those listed bellow:
The following journals profiled on electrochemistry and electroanalytical chemistry publish frequently papers on electrochemical sensors:
1.11 Organization of the Text
Chapter 1 introduces general terms and concepts in chemical-sensor science and technology. Further, Chapters 2–8 address a series of general recognition methods and materials commonly used in chemical sensors, as well as methods and technologies used in the manufacturing of such devices.
The next chapters focus on various kinds of chemical sensors classified according to the transduction method. As a rule, the physical or physicochemical principles of the addressed transduction method are first introduced. Further, various types of sensors obtained by combining the considered transduction method with diverse recognition schemes are presented.
Proteins are widely used in sensors as recognition receptors, either as enzymes, antibodies or biological receptors. For this reason the second chapter is dedicated to a short overview of protein structure and properties.
Chapter 3 introduces enzymes and their applications in chemical sensors for the determination of the enzyme substrate and enzyme inhibitors or as signaling labels in affinity-based sensors. The main transduction strategies in enzymatic sensors are also presented in this chapter. Understanding of the functioning of enzymatic sensors depends to a great extent on the mathematical modeling of such sensors. This topic is presented in Chapter 4.
An understanding of protein and enzyme chemistry is sufficient to grasp typical methods of fabrication of chemical sensors, which form the subject of Chapter 5. General methods for the immobilization of recognition receptors, materials used as the support for immobilization, other materials with relevance in sensor technology, as well as microfabrication technologies with applications in sensor fabrication are introduced in this chapter. Other methods and materials that are specific to particular classes of chemical sensors are addressed in subsequent chapters.
Chapters 06 and 07 address recognition methods based on affinity reactions. Chapter 6 introduces recognition methods based on antibodies and other natural and synthetic affinity reagents. A particular class of affinity interaction involves nucleic acids (Chapter). In this case, the analyte–receptor interaction is based on only two types of hydrogen bonding between complementary nucleobases. In both Chapters 06 and 07, general transduction strategies specific to each kind of recognition material, are presented.
As the application of nanomaterials in sensor technology is currently a topic of huge interest, Chapter 8 addresses the structure and properties of important classes of nanomaterials and the possibilities of application of such materials in sensor fabrication.
The following chapters introduce a series of typical transduction methods and present various chemical sensors based on the addressed transduction method.
Chapter 9 describes sensors in which transduction is based on a general property of chemical reactions, that is, the thermal effect. Two kinds of sensor are addressed in this chapter, namely enzyme-based sensors and sensors based on catalytic oxidation of combustible gases.
Chapter 10 presents ion-recognition methods and potentiometric ion sensors. Also, this chapter introduces a series of chemical sensors based on recognition processes leading to the formation of ions, such as sensors based on enzymatic reactions or gas dissolution in aqueous solutions. Such sensors make use of an ion sensors as transduction elements. Chapter 11 addresses an advanced class of potentiometric sensors that are based on the integration of electronic semiconductor devices with suitable sensing elements.
A particular but very important application of inorganic and organic semiconductor materials refers to resistive gas sensing, a topic that is dealt with in Chapter 12. The common feature of Chapters 11 and 12 is the application of semiconductor materials for recognition and transduction purposes.
The next five chapters address electrochemical sensors based on dynamic electrochemistry transduction. The fundamental principles of dynamic electrochemistry methods is the object of Chapter 13. Chapters 14 and 15 address amperometric enzymatic sensors; the former introduces the design principles of such sensors, while the latter gives an account of mathematical modeling of amperometric enzymatic sensors.
Applications of dynamic electrochemistry methods to affinity sensors and nucleic acid sensors are accounted for in Chapter 16. As in both cases the recognition is based on the formation of association complexes, there are many common features as far as the electrochemical transduction is involved.
A comprehensive examination of the dynamics of electrochemical processes is possible by application of electrochemical impedance spectrometry. This general method, as well as more specialized methods derived from it (such as conductometry and capacitance measurements), is presented in Chapter 17.
The extent of the space dedicated to electrochemical sensors is due to the central position occupied by this kind of sensor in the context of chemical-sensor science.
Optical sensors are addressed in Chapters 18, 19, 20. Chapter 18 presents the general principles of chemical sensing based on light waveguides. Chapter 19 addresses the design of optical sensors in conjunction with various recognition methods and emergent applications. Chapter 20 deals with an important contemporary trend in the development of optical sensors, namely the application of certain nanomaterials in optical sensing.
Chapter 21 deals with sensors based on a particular type of mechanical phenomenon, namely the acoustic wave, in other words, vibration and sound propagation in solid, liquid and viscoelastic materials.
Currently, much interest is aroused by the application of microelectromechanical systems (MEMS) in chemical sensing, a topic that is addressed in Chapter 22. As in the case of acoustic wave sensor, the MEMS sensor performs transduction by mechanical effects produced by the recognition event.
The last chapter, Chapter 23, introduces sensors based on living material (cells, tissue) as recognition receptors. This chapter has been placed at the end because living material sensors employ a series of transduction methods introduced in previous chapters.
Most of the chapters, and also certain sections, have been organized so as to introduce first the essential principles of the type of sensor addressed. Further, advanced topics are presented so that the interested reader can acquire a deeper knowledge of the field.
Each chapter gives some key references in order to help the interested reader to get a first contact with the relevant literature.
1. Thevenot, D.R., Toth, K., Durst, R.A. et al. (1999) Electrochemical biosensors: Recommended definitions and classification – (Technical Report). Pure Appl. Chem., 71, 2333–2348.
2. Sinclair, I.R. (2001) Sensors and Transducers, Newnes, Boston.
3. Fabbrizzi, L. and Poggi, A. (1995) Sensors and switches from supramolecular chemistry. Chem. Soc. Rev., 24, 197–202.
4. Heineman, W.R. and Jensen, W.B. (2006) Leland C. Clark Jr. (1918–2005), Biosens. Bioelectron., 21, 1403–1404.
5. Fogg, A.G., Scullion, S.P., Edmonds, T.E. et al. (1990) Adaptation of online reactions developed for use with flow-injection with amperometric detection for use in disposable sensor devices – reductive determination of phosphate as preformed 12-molybdophosphate in a capillary-fill device. Analyst, 115, 1277–1281.
6. Miller, J.N. and Miller, J.C. (2010) Statistics and Chemometrics for Analytical Chemistry, Pearson Prentice Hall, Harlow.
7. Danzer, K. and Currie, L.A. (1998) Guidelines for calibration in analytical chemistry – Part 1. Fundamentals and single component calibration (IUPAC recommendations 1998). Pure Appl. Chem., 70, 993–1014.
8. Danzer, K. (2007) Analytical Chemistry: Theoretical and Metrological Fundamentals, Springer-Verlag, Berlin, Heidelberg.
9. Otto, M. (2007) Chemometrics: Statistics and Computer Application in Analytical Chemistry, Wiley-VCH, Weinheim.
10. Bro, R. (2003) Multivariate calibration – What is in chemometrics for the analytical chemist? Anal. Chim. Acta, 500, 185–194.
11. Carey, W.P. and Kowalski, B.R. (1996) Sensor and sensor array calibration, in Handbook of Chemical and Biological Sensors (eds R.S. Taylor and J.S. Schultz), Institute of Physics Publ., Bristol, pp. 287–347.
12. Gardner, J.W. and Bartlett, P.N. (1999) Electronic Noses: Principles and Applications, Oxford University Press, Oxford.
13. Pearce, T.C., Schiffman, S.S., Troy Nagle, H. et al. (eds) (2003) Handbook of Machine Olfaction: Electronic Nose Technology, Wiley-VCH, Weinheim.
14. Citterio, D. and Suzuki, K. (2008) Smart taste sensors. Anal. Chem., 80, 3965–3972.
15. Zeravik, J., Hlavacek, A., Lacina, K. et al. (2009) State of the art in the field of electronic and bioelectronic tongues – towards the analysis of wines. Electroanalysis, 21, 2509–2520.
16. Legin, A., Rudnitskaya, A., Vlasov, Y. et al. (2000) Application of electronic tongue for qualitative and quantitative analysis of complex liquid media. Sens. Actuators B-Chem., 65, 232–234.
17. Aishima, T. (1991) Discrimination of liquor aromas by pattern-recognition analysis of responses from a gas sensor array. Anal. Chim. Acta, 243, 293–300.
18. Brereton, R. G. (2009) Chemometrics for pattern recognition, Wiley, Chichester.
19. Zupan, J. and Gasteiger, J. (1999) Neural Networks in Chemistry and Drug Design, Wiley-VCH, Weinheim.
20. James, D., Scott, S.M., Ali, Z. et al. (2005) Chemical sensors for electronic nose systems. Microchim. Acta, 149, 1–17.
21. Hines, E.L., Llobet, E., and Gardner, J.W. (1999) Electronic noses: a review of signal processing techniques. IEE Proc.-Circuit Device Syst., 146, 297–310.
22. R![]() ži
ži![]() ka, J. and Hansen, E.H. (1988) Flow Injection Analysis, Wiley, New York.
ka, J. and Hansen, E.H. (1988) Flow Injection Analysis, Wiley, New York.
23. Trojanowicz, M. (2000) Flow Injection Analysis: Instrumentation and Applications, World Scientific, Singapore.
24. Ohno, K., Tachikawa, K., and Manz, A. (2008) Microfluidics: Applications for analytical purposes in chemistry and biochemistry. Electrophoresis, 29, 4443–4453.
25. Ghallab, Y.H. and Badawy, W. (2010) Lab-on-a-Chip: Techniques, Circuits, and Biomedical Applications, Artech House, Norwood, MA.
26. Li, P.C.H. (2010) Fundamentals of Microfluidics and Lab on a Chip for Biological Analysis and Discovery, CRC Press, Boca Raton, Fla.
27. Korotcenkov, G. (ed.) (2011) Chemical Sensors Applications, Momentum Press, Highland Park, N.J.
28. Ramsay, G. (1998) Commercial Biosensors: Applications to Clinical, Bioprocess, and Environmental Samples, J. Wiley, New York.
29. Lieberzeit, P.A. and Dickert, F.L. (2007) Sensor technology and its application in environmental analysis. Anal. Bioanal. Chem., 387, 237–247.
30. Badihi-Mossberg, M., Buchner, V., and Rishpon, J. (2007) Electrochemical biosensors for pollutants in the environment. Electroanalysis, 19, 2015–2028.
31. Wanekaya, A.K., Chen, W., and Mulchandani, A. (2008) Recent biosensing developments in environmental security. J. Environ. Monit., 10, 703–712.
32. Trojanowicz, M. (2002) Determination of pesticides using electrochemical enzymatic biosensors. Electroanalysis, 14, 1311–1328.
33. Palchetti, I. and Mascini, M. (2008) Nucleic acid biosensors for environmental pollution monitoring. Analyst, 133, 846–854.
34. Leonard, P., Hearty, S., Brennan, J. et al. (2003) Advances in biosensors for detection of pathogens in food and water. Enzyme Microb. Technol., 32, 3–13.
35. Nayak, M., Kotian, A., Marathe, S. et al. (2009) Detection of microorganisms using biosensors-A smarter way towards detection techniques. Biosens. Bioelectron., 25, 661–667.
36. Varney, M.S. (2000) Chemical Sensors in Oceanography, Gordon and Breach Science Publishers, Amsterdam.
37. Kroger, S. and Law, R.J. (2005) Biosensors for marine applications – We all need the sea, but does the sea need biosensors? Biosens. Bioelectron., 20, 1903–1913.
38. D'Orazio, P. (2003) Biosensors in clinical chemistry. Clin. Chim. Acta, 334, 41–69.
39. Vadgama, P. (2007) Sensor biocompatibility: Final frontier in bioanalytical measurement. Analyst, 132, 495–499.
40. Wang, J. (2001) Glucose biosensors: 40 years of advances and challenges. Electroanalysis, 13, 983–988.
41. Wang, J. (2008) Electrochemical glucose biosensors. Chem. Rev., 108, 814–825.
42. Cunningham, D.D. and Stenken, J.A. (eds) (2010) In Vivo Glucose Sensing, John Wiley and Sons, Hooken N.J.
43. Mascini, M. and Tombelli, S. (2008) Biosensors for biomarkers in medical diagnostics. Biomarkers, 13, 637–657.
44. Prodromidis, M.I. (2010) Impedimetric immunosensors-A review. Electrochim. Acta, 55, 4227–4233.
45. Mello, L.D. and Kubota, L.T. (2002) Review of the use of biosensors as analytical tools in the food and drink industries. Food Chem., 77, 237–256.
46. Venugopal, V. (2002) Biosensors in fish production and quality control. Biosens. Bioelectron., 17, 147–157.
47. Palchetti, I. and Mascini, M. (2008) Electroanalytical biosensors and their potential for food pathogen and toxin detection. Anal. Bioanal. Chem., 391, 455–471.
48. Sinfield, J.V., Fagerman, D., and Colic, O. (2010) Evaluation of sensing technologies for on-the-go detection of macro-nutrients in cultivated soils. Comput. Electron. Agric., 70, 1–18.
49. Freitag, R. (ed.) (1996) Biosensors in Analytical Biotechnology, Academic Press, San Diego, Calif.
50. Mulchandani, A. and Bassi, A.S. (1995) Principles and applications of biosensors for bioprocess monitoring and control. Crit. Rev. Biotechnol., 15, 105–124.
51. Smith, R.G., D'Souza, N., and Nicklin, S. (2008) A review of biosensors and biologically-inspired systems for explosives detection. Analyst, 133, 571–584.
52. Gooding, J.J. (2006) Biosensor technology for detecting biological warfare agents: Recent progress and future trends. Anal. Chim. Acta, 559, 137–151.
53. Shah, J. and Wilkins, E. (2003) Electrochemical biosensors for detection of biological warfare agents. Electroanalysis, 15, 157–167.
54. Tok, J.B.H. (ed.) (2008) Nano and Microsensors for Chemical and Biological Terrorism Surveillance, RSC Publishing, Cambridge.
55. Janata, J. (1989) Principles of Chemical Sensors, Plenum Press, New York.
56. Janata, J. (2009) Principles of Chemical Sensors, Springer-Verlag US, Boston, MA.
57. Hall, E.A.H. (1990) Biosensors, Open University Press, Milton Keynes, England.
58. Scheller, F.W. and Schubert, F. (1992) Biosensors, Elsevier, Amsterdam.
59. Cunningham, A.J. (1998) Introduction to Bioanalytical Sensors, Wiley, New York.
60. Turner, A.P.F., Karube, I., and Wilson, G.S. (eds) (1987) Biosensors: Fundamentals and Applications, Oxford University Press, Oxford.
61. Edmonds, T.E. (ed.) (1988) Chemical Sensors, Blackie, Glasgow.
62. Göpel, W. (ed.) (1991) Chemical and Biochemical Sensors, vol. 1, 2, VCH Verlagsgesellschaft, Weinheim.
63. Taylor, R.F. and Schultz, J.S. (eds) (1996) Handbook of Chemical and Biological Sensors, Institute of Physics Publ., Bristol.
64. Kress-Rogers, E. (ed.) (1997) Handbook of Biosensors and Electronic Noses: Medicine, Food, and the Environment, CRC Press, Boca Raton, Fla.
65. Gorton, L. (ed.) (2005) Biosensors and Modern Biospecific Analytical Techniques, Elsevier, Amsterdam.
66. Knopf, G.K. and Bassi, A.S. (eds) (2007) Smart Biosensor Technology, CRC Press, Boca Raton.
67. Alegret, S. and Merkoçi, A. (eds) (2007) Electrochemical Sensor Analysis, Elsevier, Amsterdam.
68. Grimes, C.A., Dickey, E.C., and Pishko, M.V. (eds) (2006) Encyclopedia of Sensors, American Scientific Publishers, Stevenson Ranch, Calif.
69. Cass, A.E.G. (ed.) (1990) Biosensors: A Practical Approach, IRL Press, Oxford.
70. Cooper, J.M. and Cass, A.E.G. (eds) (2004) Biosensors: A Practical Approach, Oxford University Press, New York.
71. Rasooly, A. and Herold, K.E. (eds) (2009) Biosensors and Biodetection: Methods and Protocols, Humana Press, New York.
72. Eggins, B.R. (1996) Biosensors: An Introduction, J. Wiley, Chichester.
73. Eggins, B.R. (2002) Chemical Sensors and Biosensors, J. Wiley, Chichester.
74. Diamond, D. (ed.) (1998) Principles of Chemical and Biological Sensors, Wiley, New York.
75. Gründler, P. (2007) Chemical Sensors: An Introduction for Scientists and Engineers, Springer-Verlag, Berlin.
76. Zourob, M. (ed.) (2010) Recognition Receptors in Biosensors, Springer, New York.