
Chapter 6
Affinity-Based Recognition
6.1 General Principles
Affinity interactions are based on multiple noncovalent interactions between two species leading to the formation of a molecular aggregate usually called a complex. Such interactions are very common in living organism, being associated with important physiological functions. The strength of the complex arises from the multiplicity of the noncovalent bonds and is quantified by its stability constant, often termed the affinity constant. At the same time, the noncovalent character of the interaction imparts reversibility to the affinity association process. Finally, affinity interactions are very specific as a result of the steric and structural complementarity of the reactant.
The high specificity of biological affinity interactions prompted the development of a broad range of analytical applications in which one affinity reagent acts as a recognition receptor, whereas the second, target compound functions as the analyte. Inspired by natural affinity reactions, various synthetic receptors have been developed in the field of supramolecular chemistry [1, 2]. Synthetic receptors are often more stable and cheaper than the natural ones but the latter are well established and will be further employed on a large scale.
From the standpoint of analytical applications, immunoassay is the most common analytical methods in this class. It is based on antibodies that are secreted by higher organisms in defense against pathogens. Biological receptors that are essential in the response of living cell to chemical stimuli form another group of natural compounds with relevance to analytical applications. In addition, a series of synthetic receptors or natural compounds with no receptor functions in living systems proved extremely useful from the analytical standpoint.
This chapter reviews first the principles of antibody-based chemical sensing, which is the most representative among the affinity-based analytical methods. Next, chemical sensing based on biological receptors is addressed, and finally several classes of synthetic receptors are dealt with.
6.2 Immunosensors
Immunoassay and immunosensors rely on species involved in the immune response of living organisms. In order to remove pathogens and other foreign species, the organism reacts by a series of physiological processes aiming at indentifying and annihilating the intruder. Immunoassay is currently a common diagnostic method [3, 4]. In addition, immunochemical analysis methods are extremely useful in other areas of a great interest. The key compounds in immunoassay are the antibodies.
6.2.1 Antibodies: Structure and Function
An antibody is a large protein that is used by the immune system to identify and neutralize foreign objects such as bacteria and viruses. The antibody recognizes a unique part of the foreign target, called an antigen. Typical antibodies are immunoglobulins (Ig), a class of proteins abundant in blood plasma, the most prevalent one being immunoglobulin G (IgG). When a microorganism or a foreign protein enters the organism, the immune system produces antibodies that append to the antigen to form an immunochemical complex. This allows the immune system to recognize the antigen and trigger other processes leading to its removal from the organism. The immune response is elicited by immunogens, that are foreign compounds in the host organism. Immunogens can belong to certain classes of biopolymers such as proteins and polysaccharides.
Typically an antibody molecule is Y-shaped, as shown in Figure 6.1. An antibody molecule consists of four protein chains, two light chains with the molecular weight of about 25 kD and two heavy chains with the molecular weight of about 50 kD. These subunits are assembled by noncovalent bonds and sulfur bridges to form a quaternary structure. Within the antibody molecule there are constant (C) and variable (V) domains. In the constant domains, the amino acid sequence is similar in any antibody belonging to a specific class (e.g., IgG) while the sequence in the variable domains is adapted in order to allow for the recognition of a specific antigen. The Fc region (“fragment, crystallizable”) ensures that each antibody generates an appropriate immune response for a given antigen, by binding to a specific class of Fc receptors, and other components of the immune system. Thus, an antibody acts as a label that triggers different physiological processes leading to the destruction of the antigen.
Figure 6.1 Schematic diagram of the ImmunoglobulinG (IgG) antibody.
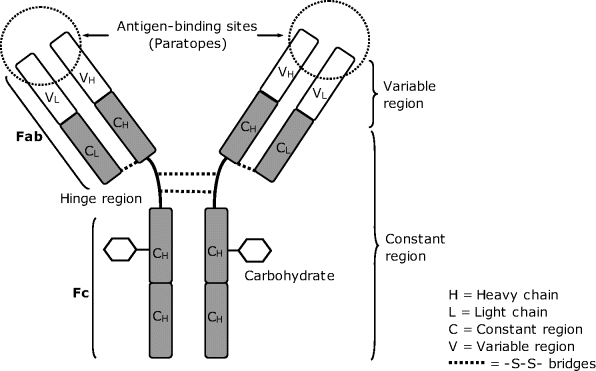
The arms of the Y contain the sites that can bind two antigens (different or identical) and, therefore, recognize specific foreign species. This region of the antibody is called the Fab (Fab for “fragment, antigen binding”). The variable domains shape the paratopes of the antibody that is, the regions that interact directly with the antigen.
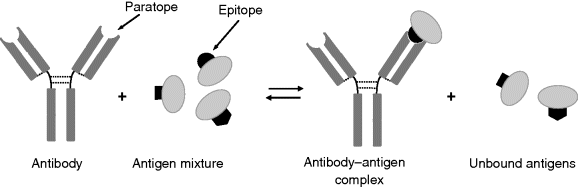
Antibodies are widely used in analytical immunochemistry for very sensitive detection and quantitation of various antigens. Figure 6.2 depicts the interaction of an antibody with a sample containing a mixture of antigens. Antibodies react only with small fragments of the antigen called epitopes. Only antigens featuring a fitting epitope interact with the antibody forming a strong antibody–antigen complex. Detection of this complex allows for identification and analytical determination of the target antigen.
Figure 6.2 Specific interaction of an antibody with a mixture of antigens resulting in an antibody–antigen complex.
Antibody preparations can be obtained by inoculating laboratory animals with an antigen. Blood serum from the inoculated animal contains a mixture of antibodies showing specificity to various epitopes on the antigen. Such a preparation contains polyclonal antibodies. In contrast, monoclonal antibodies that are produced from cell culture, bind to only one particular antigen epitope. As will be shown later, monoclonal antibodies present substantial advantages in immunoassay.
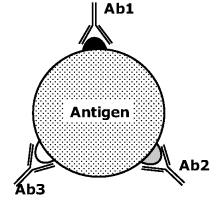
From the standpoint of the immunogenic behavior, two classes of antigens can be distinguished, namely complete and partial antigens. A complete antigens induces an immune response by itself and is usually a high molecular weight protein or polysaccharide. A complete antigen can feature several identical epitopes or contain different epitopes, each of them reacting with a specific antibody. Antigens in the second class are called multideterminant antigens. Organism inoculation with such antigens produces a polyclonal serum (Figure 6.3).
Figure 6.3 Interaction of a multideterminant antigen with polyclonal antibodies (Ab1, Ab2 and Ab3).
An partial antigen (also called a hapten) is a low molecular weight compound that cannot elicit an immune response alone but only if it is linked to a carrier-protein. Examples of haptens are hormones, drugs, allergens, and organic environment contaminants. When inoculated into an organism, the haptene-carrier adduct elicits immune response. Remarkably, the antihapten antibody thus produced binds to the hapten even when this one is free from the carrier. This allows to develop very sensitive analytical methods for the determination of small-molecule compounds by interaction with a specific antibody. Such methods are commonly used for assessing pharmaceutical products and organic pollutants.
6.2.2 Antibody–Antigen Affinity and Avidity
The strength of the antibody–antigen interaction is expressed by the association constant that indicates the affinity of a paratope for a specific epitope. Adopting the symbol Ab for antibody, Ag for antigen and Ab:Ag for the complex, this reversible interaction can be formulated as:
(6.1) ![]()
The association constant ![]() is the equilibrium constant of the above reaction:
is the equilibrium constant of the above reaction:
(6.2) ![]()
where square parentheses indicate concentrations and ![]() (also referred to as affinity constant) is quantified in reciprocal molar concentration units, M−1 or
(also referred to as affinity constant) is quantified in reciprocal molar concentration units, M−1 or ![]() .
. ![]() values can range from 105 to 1012 M−1, but only systems with
values can range from 105 to 1012 M−1, but only systems with ![]() are useful for analytical purposes. A high affinity constant enables one to design assays with the limit of detection down to 10−9 to 10−12 M.
are useful for analytical purposes. A high affinity constant enables one to design assays with the limit of detection down to 10−9 to 10−12 M.
The affinity constant has an unambiguous meaning only if it refers to monoclonal antibodies. When dealing with heterogeneous polyclonal antibodies, each component of the preparation features a particular affinity for its epitope. In such a case, ![]() represents an average value that is termed avidity.
represents an average value that is termed avidity.
Association of an antibody and an antigen is an intricate process involving various kinds of interaction. First, the two partners are brought in close proximity and favorable positions by diffusion. When the epitope–paratope distance approaches some 10 nm, electrostatic attraction becomes effective. This reduces the distance between reactants and water molecules are excluded, allowing for hydrogen bonds to form between relevant groups in each partner. At a very short distance, van der Waals interactions come into play. In addition, nonpolar groups can aggregate with each other in the aqueous environment by hydrophobic interactions. The interplay of so many interactions, combined with steric complementarity explains the high selectivity of the antibody–antigen coupling.
6.2.3 Analytical Applications
Antibody–antigen reactions form the basis of a wide area of analytical methods with applications in various fields such as biomedicine, toxicology, food industry, and environment chemistry. The range of application encompasses detection of pathogenic micro-organisms, proteins, and small organic molecules that behave as haptens. Immunoassay kits are commercially available for application in clinical laboratories. However, such procedures require a series of operations such as washing out the sample or immunoreagents. The throughput is considerably enhanced by automation but even so there remain some problems such as field application of immunoassay or searching simultaneously for multiple analytes in a sample. Such problems are alleviated by combining immunoreaction with suitable transducers to form immunosensor that provide in real time the requested analytical information [5].
Immunoassay is equally concerned with the determination of either antigens or antibodies. Antibody detection is a valuable diagnostic tool as it allows an infection to which the organism elicited immune response to be revealed. So, according to circumstances, either an antibody or an antigen functions as receptor, also called capture probe. The target analyte is also termed a ligand.
As the recognition is provided by the Fab domain, it is sometime convenient to resort to this fragment only instead of the whole antibody molecule. This fragment can be engineered such as to be more stable than the whole molecule.
A key issue is the regeneration of the sensor after each assay. This can be done either by shifting the pH to an extreme value, by an increase in ionic strength or by means of guanidinium chloride. Such a treatment breaks up noncovalent bonds involving hydrogen bonds or electrostatic interactions and releases the analyte. At the same time, the regeneration is potentially harmful to the binding site and may lead to a reduced lifetime of the sensor and a drift of the response signal. This problem can be alleviated by using a mutant antibody or an antibody fragment with enhanced stability. When possible, one can resort to an alternative regeneration methods. For example, when dealing with a small-molecule analyte, this one can be displaced from the complex by an excess of an analogous compound with a lower affinity. Regeneration conditions are less stringent in the case of antibody determination by means of immobilized antigens as receptors. The regeneration problem is irrelevant if the sensor is designed as a disposable device.
Nonspecific interactions of the analyte with the support surface could cause a disturbing background signal. In order to avoid such problems, it is recommended to resort to blocking agents such as proteins (gelatin, bovine serum albumin or lysosyme) or surfactants (Triton X 100, Tween 20) as coatings over the exposed support surface. Alternatively, one can rely on background subtraction using a nonspecific reference sensor that provide the correction signal.
In addition to the effect of the recognition process, the response can also be influenced by parameters unrelated to the target species. For example, uncontrolled variation of temperature, salt concentration and pH, as well as and nonspecific interactions can produce random variations in the response signal. To compensate for such effects, a reference sensor can be used. Ideally, no analyte binding occurs at the reference sensor but otherwise it elicits an identical response to the disturbing factors. The corrected signal is obtained as the difference between the total signal and the reference sensor response. If the working and reference sensors responds similarly to disturbing parameters, differential schemes can improve both selectivity and sensitivity of the assay.
Immunosensor operation involves several steps including addition of reagents and washing out. That is why it is used to operate an immunosensor in flow analysis systems that allow for automation of the run. Application of microfluidics in immunoassay brings about the noteworthy advantage of using very small amounts of sample and reagents [6].
6.2.4 Label-Free Transduction Methods in Immunosensors
It was already mentioned that immunoassay is based on the detection of the antibody–antigen complex. In certain immunoassays methods as well as in immunosensors, the receptor is immobilized at the surface of a solid support where the recognition event does occur. Therefore, any physical change caused by the formation of the complex can in principle be handy for transduction. The most striking alteration is the mass change that can be assessed by means of mass-sensitive devices such as the quartz crystal microbalance. On the other hand, the formation of the complex modifies drastically the behavior of the surface layer in its interaction with light beams. For example the refractive index of the sensing layer changes in response to complex formation and allows for the analyte concentration to be assessed. As antibodies and antigens are charged particles, their coupling dramatically changes the local charge distribution, an effect that can be monitored by electrochemical methods.
What limits the performance of a label-free affinity sensor is more often the limited selectivity of the recognition step due to nonspecific interaction of the analyte with the receptor or the support. Such interaction may drastically impair the sensor selectivity. Nonspecific binding of concomitants can prevent the analyte binding or cause a positive false signal.
Selectivity is particularly important when dealing with genuine biological samples where the analyte concentration can be much less that the concentration of similar concomitants. This problem can be resolved by preliminary separation of the analyte but separation may be a time-consuming step. To alleviate this problem, the sensor is often exposed to a blocking agent prior to the assay. Under favorable conditions, the blocking agent adsorbs on nonspecific binding sites, hopefully not occupying the receptor binding sites. Antifouling agents, such as polyethylene glycol, can also be placed on support areas surrounding the sensing layer to prevent analyte depletion by nonspecific binding. Similar effects can be obtained in the case of gold supports by chemisorption of alkanethiols or their derivatives
A differential approach can be used to subtract the nonspecific component of the sensor response. This scheme should be applied very cautiously as no general secure method for quantifying the nonspecific term can be worked out. Washing the sensor before reading out the signal can improve the selectivity by removing nonspecifically bound molecules that are, as a rule, more loosely attached than the analyte.
6.2.5 Label-Based Transduction Methods in Immunosensors
Very sensitive and reliable immunoassay methods are based on labeled immunoreagents. The antibody–antigen coupling brings the label into the complex and affords reporting the extent of the reaction. The most current labels are radioisotopes, luminescent compounds, and enzymes. Radioisotopes allow for extremely sensitive detection, but present, of course, serious hazards and are avoided whenever possible. Luminescent labels are in turn commonly used. Briefly, luminescence denotes light emission by excited molecules. Excited molecules can be generated by light absorption (photoluminescence, also called fluorescence) or as products of certain chemical (chemiluminescence) or biochemical (bioluminescence) reactions. See Section 19.5 for details.
Enzymes labels are characterized by exceptional sensitivity as the enzymatic reaction results in amplification of the signal.
It is obvious that a broad variety of transduction methods are prone to integration with immunorecognition reactions [7], as will be shown in detail in later chapters. The next section introduces the principles of enzyme labels that are suited for both standard immunoassay and immunosensors.
6.2.6 Enzyme Labels in Immunoassay
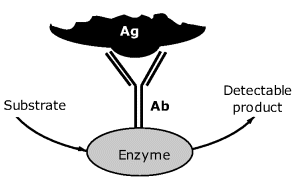
Enzymes are widely used labeling compound in standard immunoassay [8]. The principle of enzyme-label transduction is featured in Figure 6.4, which refers to the determination of an antigen. The antigen sample is incubated with the enzyme-labeled antibody in order to allow for complex formation. The complex should be next separated from the unreacted labeled antibody and the incubated with the substrate solution. The substrate is selected so as to form a detectable product by the enzyme-catalyzed reaction. The amount of complex, and implicitly the analyte concentration, can be estimated by various methods that are common to enzyme sensors.
Figure 6.4 Detection of the antibody–antigen complex in enzyme-linked immunoassay.
In order to facilitate the separation of the complex, the receptor is immobilized at the surface of a solid support, such as a microtiter well. A method using immobilized antibodies and enzyme labels is usually termed enzyme-linked immunosorbent assay (shortly ELISA) [9, 10].
It is obvious that the analyte concentration can be inferred from the amount of enzyme coupled to the immobilized complex. This one can be estimated by adding a substrate and allowing the enzymatic reaction to proceed for a pre-determined time interval. The reaction is then stopped by shifting the pH from neutral to alkaline (by adding a concentrated base) and the product concentration is the determined by a suitable analytical method. The amount of detectable product must be proportional to the local enzyme concentration. In order to fulfill this requirement, the substrate concentration should be sufficiently high so as to allow the enzymatic reaction to proceed under zero-order kinetic conditions.
Under zero-order kinetics, the reaction rate of the enzymatic reaction is also an indicator of the amount of complex. The reaction-rate-based method is convenient for enzyme-linked immunosensors. Such a sensor is formally a combination of an immunorecognition system with an enzyme sensor that is designed so as to report on the total amount of enzyme linked to the Ab:Ag complexe.
A label-enzyme should feature high specific activity, stability and possibility of facile conjugation with immunoreagents. As the substrate should be selected so as to give a detectable product, it is convenient to use enzymes that are equally active with as many as possible substrates.
Next, several enzymes commonly used as immunoassay labels are briefly reviewed. More details on such enzymes are available in Chapter 3.
Peroxidases are heme proteins that catalyzes the oxidation of various substrates in the presence of a peroxide as electron acceptor. The most common enzyme of this type is horse radish peroxidase, which is stable and has a high specific activity. Care should be taken to avoid the presence of inhibitors such as cyanide and sulfide ions that inhibit the enzyme by covalent coupling to iron. Microperoxidases, that are catalytically active fragments of cytochrome c, function mostly in the same way except for the fact that they exhibit higher substrate selectivity. Catalase is also able to perform peroxidase-like reactions.
Alkaline phosphatase does catalyze the hydrolysis of orthophosphoric acid monoesters. A common substrate of this enzyme is p-nitrophenyl phosphate, which gives detectable p-nitrophenol.
β-Galactosidase catalyzes the hydrolysis of terminal β-d-galactose residues in a β-galactosides, in which the galactose residue is linked to a noncarbohydrate moiety. This moiety is selected so as to as yield a detectable product by enzymatic hydrolysis. Thus, p-aminophenol forms when using 4-aminophenyl β-galactopyranoside as substrate. In contrast to alkaline phosphatase which requires a pH close to 10, β-galactosidase functions best at pH 6–8, which is also optimal for the immunorecognition processes.
Glucose oxidase catalyzes the oxidation of glucoses by dissolved oxygen yielding hydrogen peroxide as byproduct. Either oxygen or peroxide concentration can be assessed for transduction purposes. The specific activity is relatively low but mammalian biological fluids do not contain enzymes that perform similar reactions. Hence, interference by endogenous enzymes is not a problem. As glucose sensors based on this enzyme are well established, integration of glucose oxidase reaction with an immunorecognition process is rather straightforward.
Luciferases catalyze bioluminescent reactions (Section 18.3.9). Bacterial and firefly luciferases are commonly employed for optical monitoring in immunoassay.
Caution should be exercised when using enzyme labels in immunoassay. For example, the large size of enzyme molecules brings about some particular problems. The enzyme labels have the potential to hinder sterically the receptor-analyte interaction. It can also alter the tertiary structure of the antibody, thus disturbing the specific binding and increasing the probability of nonspecific interaction with concomitants. Conjugation of enzyme with immunoreagents should therefore be conducted so as to preserve the activity of the active site in each partner. On the other hand, enzyme–antibody conjugation can modify the transport behavior of the labeled entity causing slower diffusion and reduced permeability through certain support matrices. The presence of enzyme inhibitors or activators in the sample solution could be a serious impediment to proper functioning of the enzyme-based immunoassay system. Also, it is important to avoid the presence of sample enzymes that act similarly to the label enzyme.
6.3 Immobilization Methods in Immunosensors
Most of the general methods for protein immobilization (adsorption, entrapment, crosslinking and covalent methods) are also applicable in the case of immunoreagents if attention is paid to the particular aspects of the antibody structure and the constraint imposed by the recognition and transduction processes. Various immobilization methods such as absorption, entrapment, covalent grafting or affinity binding are achievable using electrochemically polymerized films [11].
A straightforward immobilization method relies on magnetic beads tagged to the compound of interest. This conjugate is then patterned on the sensor working area by a thick-film magnet deposited on the back side [12].
Certain transduction methods rely on changes in the properties of the sensor surface. This is the case in optical, mass-sensitive, and capacitance-sensitive methods. In such cases, the receptor should be immobilized as a monolayer at the support surface and care should be exerted to maintain the highest possible binding capacity by proper orientation of the receptor molecule at the interface. Best performances are obtained by antibody immobilization via the Fc region, that directs the Fab (antigen-binding) domains outward and faraway from the transducer surface. This could be achieved by linking the antigen via the carbohydrate residue in the antibody Fc region. Thus, periodate oxidation of the carbohydrate produces reactive aldehyde groups that can be crosslinked with the support by dihydrazide activation.
Antibody immobilization can be achieved by affinity interactions using Protein A as crosslinker [13]. Protein A is found in the cell wall of the Staphylococcus aureus bacteria. This protein binds to the Fc region of immunoglobulins through interaction with the heavy chain. It is therefore possible to append antibodies to Protein A functionalized supports.
The avidin–biotin system is also practical in antibody immobilization as a monolayer. In this approach, avidin is first attached to the support and then a biotinylated antibody is coupled by affinity.
With certain transduction methods, antibody multi-layers function satisfactory and good sensitivity is achievable even with randomly oriented antibodies. In such cases, the receptor can be assembled in the form of 1- to 50-μm thick films obtained by entrapment or crosslinking with an inert protein.
6.4 Immunoassay Formats
Immunoassay can be performed either in homogeneous or heterogeneous format. The second alternative relies on receptors immobilized on a solid support and shares therefore certain common features with immunosensors. Several approaches in heterogeneous immunoassay are presented below.
Direct immunoassay is used to detect antigens and makes use of labeled antibodies that are added to the sample. The resulting labeled complex is detected after washing out the excess antibody.
Next, two indirect assay formats based on immobilized receptors and labeled reagents are introduced. It will be assumed that monoclonal antibodies are used in the assay, in accordance with the common practice.
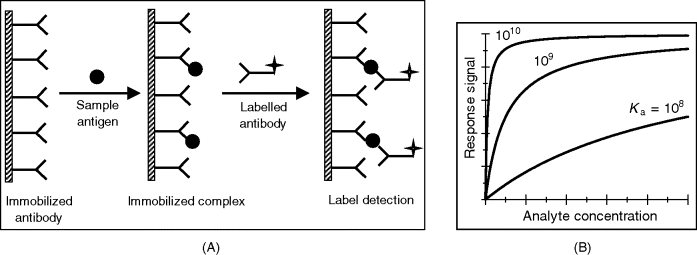
Noncompetitive assay (Figure 6.5A) (also known as excess reagent or sandwich assay or two-site assay) relies on two monoclonal antibodies, each of them being able to link to a particular epitope on the antigen. The first antibody is the immobilized receptor, while the second one is a labeled signaling antibody (secondary antibody). In the first step, the sample solution is incubated with the receptor and the Ab–Ag interaction is allowed to attain the equilibrium. The sample is then washed out and the signaling antibody solution is added. The signaling antibody links to the complex formed in the previous step, yielding a labeled ternary complex. After removing the above solution, the signal generated by the immobilized labels is read-out in order to infer the antigen concentration. The “excess reagent” designation of this technique arises from the fact that only a fraction of the total amount of receptor (“reagent”) reacts with the analyte.
Figure 6.5 Excess reagent immunoassay (sandwich assay; two-site assay). (A) Assay sequence; (B) calibration graph for various values of ![]() .
.
In order to derive the response function, the reversible binding of a receptor R and an analyte (ligand) A to yield the complex C is considered:
(6.3) ![]()
The binding process can be very fast, often close to the limit imposed by a diffusional encounter. Denoting by a, r and c the concentration of A, R and C, respectively, the reaction rates for the association ![]() and the dissociation
and the dissociation ![]() processes are, respectively:
processes are, respectively:
where ![]() and
and ![]() are the rate constants for association and dissociation, respectively. At equilibrium, the rates of the above reactions are equal to each other. Therefore, by equating Equations (6.4) and (6.5) and rearranging gives an expression for the association constant Ka as:
are the rate constants for association and dissociation, respectively. At equilibrium, the rates of the above reactions are equal to each other. Therefore, by equating Equations (6.4) and (6.5) and rearranging gives an expression for the association constant Ka as:
![]() quantifies the strength of the complex while
quantifies the strength of the complex while ![]() , that is the reciprocal of the association constant, represents the dissociation constant of the complex. Concentrations involved in Equation (6.6) are equilibrium concentrations (a and r) that are generally different from initial concentrations (
, that is the reciprocal of the association constant, represents the dissociation constant of the complex. Concentrations involved in Equation (6.6) are equilibrium concentrations (a and r) that are generally different from initial concentrations (![]() and
and ![]() , respectively). However, under typical condition, only a small fraction of the available amount of analyte is bound to the receptor and the bulk concentration of the analyte can be assumed as invariable (
, respectively). However, under typical condition, only a small fraction of the available amount of analyte is bound to the receptor and the bulk concentration of the analyte can be assumed as invariable (![]() ). At the same time, the receptor concentration undergoes a noticeable variation and the equilibrium values becomes
). At the same time, the receptor concentration undergoes a noticeable variation and the equilibrium values becomes ![]() . Substituting this into Equation (6.6) gives, after rearrangement, an expression for the concentration of the complex as a function of the analyte concentration:
. Substituting this into Equation (6.6) gives, after rearrangement, an expression for the concentration of the complex as a function of the analyte concentration:
This equation (which is similar to the Langmuir isotherm) shows that the complex concentration increases nonlinearly with the analyte concentration and tends asymptotically to a limit at high concentrations (Figure 6.5B). An approximately linear range is available at very low analyte concentrations when ![]() . As is evident from Figure 6.5B, the linear response range shifts to lower concentrations with increasing
. As is evident from Figure 6.5B, the linear response range shifts to lower concentrations with increasing ![]() , which demonstrates the advantage of a very strong analyte–receptor interaction. When dealing with antibody–antigen systems, Equation (6.7) holds rigorously only when using a homogeneous, monoclonal antibody and the nonspecific binding is negligible. However at very low analyte concentrations, the
, which demonstrates the advantage of a very strong analyte–receptor interaction. When dealing with antibody–antigen systems, Equation (6.7) holds rigorously only when using a homogeneous, monoclonal antibody and the nonspecific binding is negligible. However at very low analyte concentrations, the ![]() approximation does not hold and the real curve deviates from the Equation (6.7). Nevertheless a calibration graph features as a rule an approximately linear region that is useful for analytical applications. As the analyte concentration could expand over a very broad range, the calibration graph (also called dose–response in immunoassay) is often plotted as a logarithmic-scale graph.
approximation does not hold and the real curve deviates from the Equation (6.7). Nevertheless a calibration graph features as a rule an approximately linear region that is useful for analytical applications. As the analyte concentration could expand over a very broad range, the calibration graph (also called dose–response in immunoassay) is often plotted as a logarithmic-scale graph.
Readout of the immunosensors response should be performed when the system is close to equilibrium in order to secure best sensitivity. However, the equilibration of the recognition process can be rather slow and impose a long incubation time. Hence, fast response and high sensitivity are mutually exclusive. Satisfactory sensitivity is warranted if an antibody with a high affinity is used.
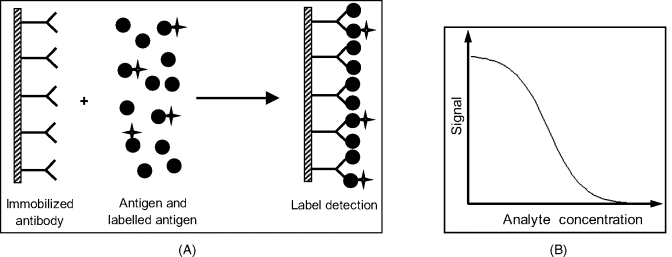
Competitive assay (Figure 6.6) makes use of a labeled analyte species. A fixed and known amount of labeled analyte is added to the sample to compete with the sample analyte for the limited number of receptor sites. The sample is then washed out and the signal produced by labels included in the immobilized complex is quantified. This method is also termed limited reagent assay since the amount of antigen (both labeled and nonlabeled) should be in excess with respect to the available amount of receptor in order to secure receptor saturation.
Figure 6.6 Competitive immunoassay. (A) assay sequence; (B) calibration graph.
In competitive assay, both the plain analyte and the labeled one (A∗) compete with equal chances for the receptor binding site yielding two complexes, C and C∗, respectively:
(6.8) ![]()
(6.9) ![]()
As there are no differences in affinity, the equilibrium constant is the same for both of the above equilibria:
(6.10) ![]()
Assuming that receptor saturation is achieved, we have:
The signal is determined by the C∗ concentration that, in principle, can be derived from the above equations. However, the exact solution is intricate and it is more expedient to resort to some approximations. Thus, it will be assumed that the concentration of each ligand do not vary by binding to the receptor (![]() and
and ![]() ) and, on the other hand, the receptor layer is saturated at equilibrium (Equation (6.11)). Under these conditions, the concentration of the labeled complex is:
) and, on the other hand, the receptor layer is saturated at equilibrium (Equation (6.11)). Under these conditions, the concentration of the labeled complex is:
Therefore, at a constant concentration of A∗, the signal decreases asymptotically with increasing analyte concentration and approaches zero at an excess of analyte. Under these conditions, the labeled ligand has almost no chance to bind to the receptor. On the other hand, at a very low analyte concentration, the ![]() approximation does not hold and a real response curve deviates from the shape predicted by Equation (6.12). Hence, a real response curve looks like the curve in Figure 6.6B, that displays a linear working range at intermediate concentrations.
approximation does not hold and a real response curve deviates from the shape predicted by Equation (6.12). Hence, a real response curve looks like the curve in Figure 6.6B, that displays a linear working range at intermediate concentrations.
It has been assumed in the above discussion that the antigen is to be determined. However, both above methods can be adapted to antibody determination using a suitable antigen as receptor.
6.5 Protein and Peptide Microarrays
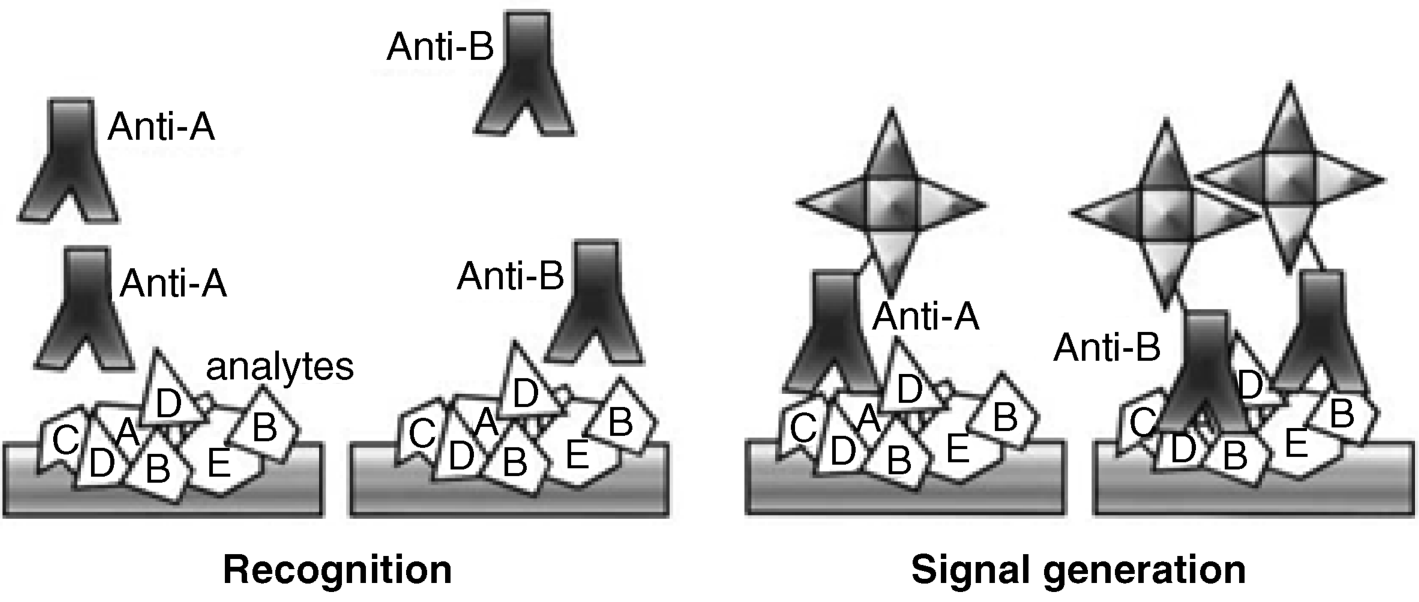
A protein microarray is a collection of microscopic protein receptor spots attached to a solid surface. As each spot includes a particular receptor, a microarray allows the simultaneous detection of a large number of proteins in a complex sample ([14, 15]. The most common protein microarray is the antibody microarray, where antibody spots of about 100 µm diameter are formed onto a chip of about 1 cm2 a total area. Antibody microarrays are invaluable as diagnostic and prognostic tools for cancer and are also used in basic research applications in proteomics. If a transducer is integrated at each array site, the device functions as an immunosensor microarray.
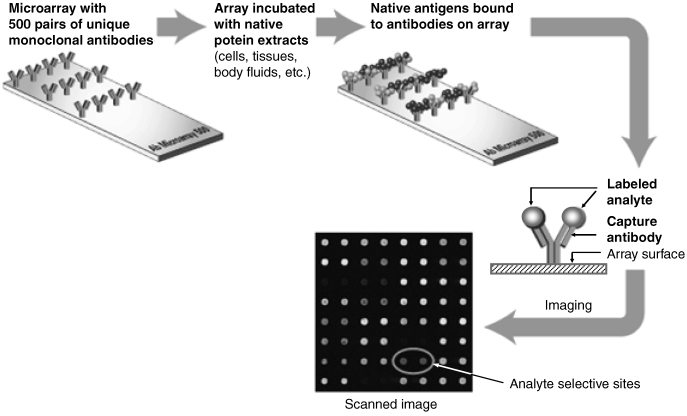
Figure 6.7 shows an example of direct screening procedure based on an antibody microarray. In this particular case, each particular monoclonal antibody is assembled at two neighboring sites in order to improve the reliability of the result. Incubation with a sample allows each analyte to bind to a specific antibody on the array. Receptor-bound antigens are then labeled by a fluorescent marker and detected by means of an optical scanner that performs array imaging. An optical scanner is a device that excites fluorescence at each site by means of a laser beam and measures the intensity of the emitted light. The antigen is identified by its position on the microarray, whereas its concentration can be assessed from the intensity of the light arising from the specific spot.
Figure 6.7 Schematics of an antibody microarray screening. A large number of identical antibody molecules are assembled at each spot. Adapted with permission from http://www.clontech.com/products/detail.asp?tabno=2&product_id=10576-. Copyright 2011 Clontech Laboratories, Inc.
In general, protein microarrays make use of various types of capture receptors for protein screening [16, 17]. For example, antigen receptors are used for the detection of antibodies in serum. More recently, other types of capture molecules such as peptides or nucleic acid aptamers have been introduced.
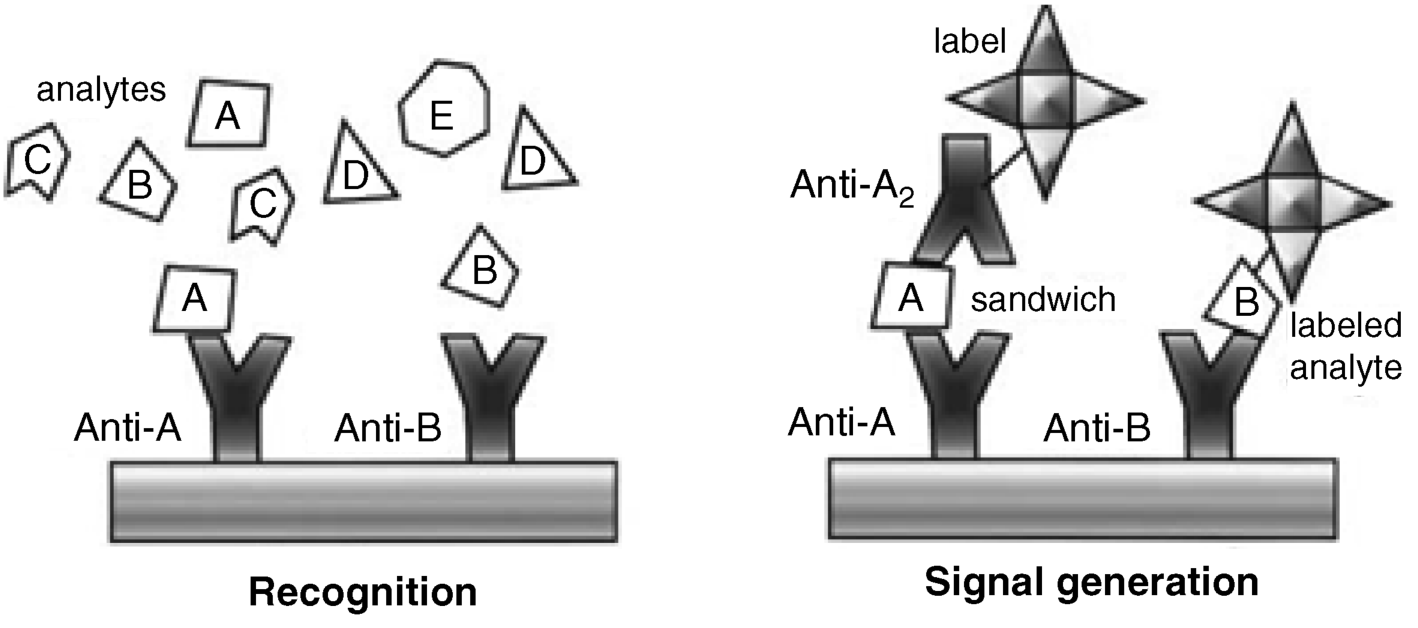
Protein microarray formats falls into two main classes: forward phase array and reverse phase array. In a forward phase microarray, each spot consists of an assembly of identical receptors and is able to indicate a specific analyte in the sample (Figure 6.8). Hence, this format allows for multiplexed screening for various analytes in the same sample. According to the labeling alternative, a forward phase microarray can be designed for direct, competitive or sandwich assay.
Figure 6.8 Forward phase protein microarray. At each spot on the microarray, a particular receptor (for example, an antibody) is immobilized in order to detect a particular analyte in the same sample. Adapted with permission from [15]. Copyright 2003 Elsevier Ltd.
In the reverse phase array, all proteins in a sample are attached at a specific spot on a microarray, which allows for screening simultaneously a great number of samples (Figure 6.9). The microarray is then incubated with a single specific antibody to detect the presence of the target protein across many samples. This method allows proteins levels in a large number of biological samples to be screened simultaneously. Cells or micro-organisms can also be screened in the same way.
Figure 6.9 Reverse phase protein microarray. At each spot on the microarray, all proteins in a particular sample are immobilized. The target protein is then is detected by means of a specific signaling antibody. Adapted with permission from [15]. Copyright 2003 Elsevier Ltd.
In many cases, the biological activity of a protein (such as an antibody) can be mimicked by a shorter peptide, that is similar to a specific sequence in the protein molecule, although often with a partial loss of activity. The most impressive application of peptide receptors is in peptide microarrays that rely on synthetic peptides[18–20].
The fabrication of peptide microarrays can be performed according to two different alternatives: parallel, on-chip peptide synthesis or immobilization of previously synthesized peptides.
The main advantage of peptide microarrays steams for their wide field of applications. Thus, antibody and nucleic acids arrays are limited to particular types of analyte. By contrast, peptide arrays allow for high throughout screening of a broad variety of interactions such as binding of proteins or ions, action of enzymes, cell adhesion and many others.
6.6 Biological Receptors
In biochemistry, a receptor is a protein molecule embedded in the plasma membrane or the cell cytoplasm, to which specific kinds of signaling molecules may attach. As the term “receptor” is used in chemical sensors to denote the recognition reagent or site, the term chemoreceptor will next denote a biochemical receptor that originates from living cells. A chemical species that binds to a chemoreceptor is called a ligand. Depending on the receptor, the ligand can be an ion or a small-molecule compound, such as neurotransmitters, hormones, pharmaceuticals, or toxins [21]. In living organisms, endogenous ligands (such as adrenalin) trigger a physiological process in response to the binding event. Ligands eliciting such an effect are called agonists. On the other hand, some ligands (called antagonists) merely block receptors without inducing a response. Many functions of the body are regulated by these chemoreceptors responding uniquely to specific agonists or antagonists that act as chemical messengers inside the body. Chemoreceptors are hence critical mediators in both intra- and extracellular communication.
Exogenous agonists and antagonists act like endogenous ligands causing stimulation or inhibition of a physiological response. Such an effect can be produced by pharmaceutical products, toxins or alkaloids. Binding of exogenous ligands is due to the fact that a chemoreceptor interacts with one or a few small atom groups in the ligand molecule but is relatively insensitive to the overall molecule structure. This behavior contrasts that of antibodies that are much more selective.
Ligand–chemoreceptor interactions are typical affinity reaction and follow in many cases the Equation (6.7). Deviations from this equation occur when the binding ratio differs from 1 : 1.
Chemoreceptors can be used in biosensors either as incorporated in a cell or after isolation from a biological preparation. The first alternative relies on the detection of the electric signal (action potential) developed by nerve cells under the effect of a chemical stimulus acting as an agonist. Alternatively chemical sensing of an agonist can be performed by monitoring the cellular response of micro-organisms caused by a chemical stimulus. Thus, a changes in the pH of the cell environment can be used for drug-screening purposes.
Isolated receptors can be attached to the transducer surface by common methods for protein immobilization (Chapter 5). Incorporation into phospholipid membranes or liposomes (that mimic cell membranes) is often preferred. Direct or competitive determination of the ligand proceeds according to the immunoassay schemes described before.
Very promising chemoreceptors are the so-called ion channels, proteins that feature permeability to ions in response to the a triggering chemical stimulus (Figure 6.10) [22–24]. There are two different ion-channel response mechanisms. In the first one, the ligand blocks physically or opens the intramolecular channel (Figure 6.10A). The second mechanism is based on electrostatic attraction or repulsion that modulates the membrane permeability (Figure 6.10B). The recognition event can be detected by monitoring the ions crossing the membrane or the change in the local electrical state (voltage, current, or capacitance) in response to ion transfer. The great advantage of such receptors arises from the amplification caused by the channel opening that allow the transfer of a relatively large amount of ions.
Figure 6.10 Principle of the ion-channel sensors. (A) Permeability modulation by channel blocking/opening (ligand-gated ion channel); (B) Configuration of a chemical sensor based on electrostatic modulation of membrane permeability. Adapted with permission from [23]. Copyright 2002 Chemical Society of Japan.
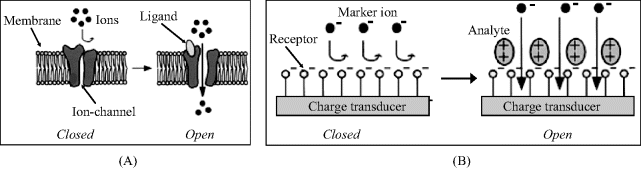
The prototypic ligand-gated ion channel is the nicotinic acetylcholine receptor. It made up of five subunits, arranged symmetrically around a central pore. When acetylcholine binds to the receptor, it alters the receptor configuration and cause the pore to open. This pore allows Na+ ions to flow down their electrochemical gradient.
Light-activated receptors provide unique transduction opportunities. Thus, the bacterial light receptor bacterio-rhodopsin promotes hydrogen-ion pumping across the bacterial membrane. When incorporated in a lipid layer, light stimulation produces a change in the voltage across the membrane. If an ion carrier (e.g., valinomycin) is also included in the membrane, light can induce transport of ions, thus enabling for transduction. The presence of an ion in the sample affects the ion transport provided that this ion binds to the ion-carrier.
Inspired by natural chemoreceptors, certain synthetic systems with analyte-modulated ion permeability have been designed and applied to the development of chemical sensors [23].
Other compounds of biological origin are useful as recognition receptors in sensors although they do not act as biological receptor in living organism. Thus, lectins are proteins that bind to a specific sugar. The most representative in this class is Concanavalin A that has been employed as recognition receptor in sugar sensors.
6.7 Artificial Receptors
6.7.1 Cyclodextrins and Host–Guest Chemistry
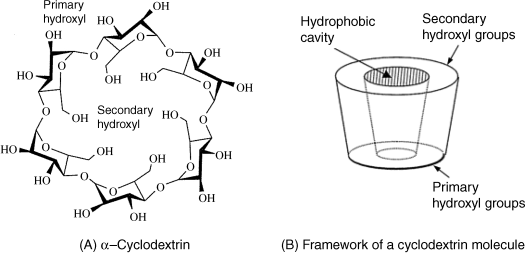
Cyclodextrins are a class of compounds made up of sugar molecules (d-glucopyranoside) bound together in a ring (Figure 6.11A) [25, 26]. Cyclodextrins are not found in nature but can be obtained by the enzymatic conversion of starch. The main members of the group are α-, β- and γ-cyclodextrin, comprising six, seven or eight sugars, respectively, per molecule. The shape of the cyclodextrin molecule is often represented as a tapering cone displaying two different faces referred to as primary and secondary rims (Figure 6.11B). The narrower rim comprises the primary hydroxyl groups, whereas the wider rim contains the secondary hydroxyl groups (–CH2OH). Cyclodextrins are generally water soluble but the solubility depends on the number of sugar molecules in the ring. Thus, β-cyclodextrin is less soluble than the α and γ analogs. The upper and lower rims display hydroxyl groups that can be derivatized.
Figure 6.11 Cyclodextrins structure and shape. Adapted with permission from [1]. Copyright John Wiley & Sons, Ltd.
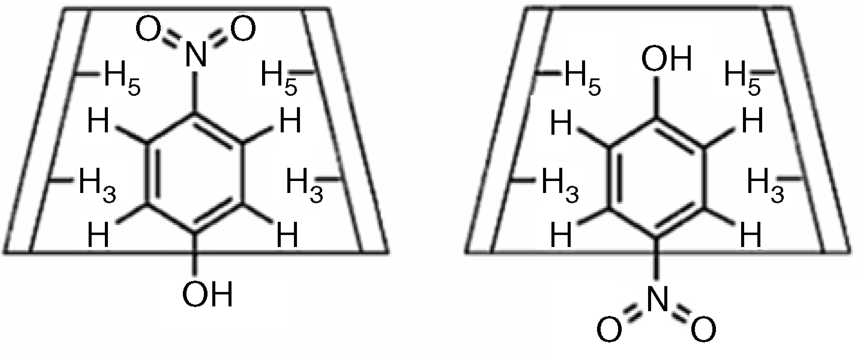
Cyclodextrins are able to form host–guest complexes with hydrophobic molecules producing inclusion complexes. For example, Figure 6.12 shows the inclusion complex of 4-nitrophenol with α-cyclodextrin. In water solution, the hydrophobic moiety of the guest is accommodated within the cavity while the hydrophilic –OH group is positioned in the hydrophilic environment provided by rime hydroxyls. In the solid state, the hydrophobic –NO2 group is not subject to interactions with a polar solvent and hence points outwards from the cavity.
Figure 6.12 A nitrophenol guest molecule accommodated in the cavity of an α-cyclodextrin in the solution (left) and in the solid state (right). Reproduced with permission from [26]. Copyright 2006 Wiley-VCH Verlag GmBH & Co. KGaA.
This class of interaction belongs to the host–guest chemistry which addresses complexes formed by inclusion of a host species in the cavity of a host molecule.
The stability of host–guest compounds is determined by noncovalent interactions. Due to the complex chemical structure of the cyclodextrin cavity, almost any kind of noncovalent interaction with the guest is possible, including hydrophobic effects, van de Waals interactions, hydrogen bonding, and dipole-dipole interactions. A guest molecules will be fully enclosed within the cyclodextrin molecule if it fits the cavity. With long molecules, cyclodextrins are capable to form channel structures in which several cyclodextrin cavities line up to form an extended hydrophobic cavity into which the guest can be threaded. Moreover, formation of a cyclodextrin host–guest complex can in some instance be followed by catalytic conversion of the guest, an effect similar to that produced by enzymes.
As usually with recognition receptors, cyclodextrins need to be interfaced with the transducer by immobilization. This can be done by covalent coupling via the hydroxyl groups or by incorporation in plasticized PVC membranes. Thiol-derivatized cyclodextrins can be assembled on a gold surface by sulfur chemisorption. It is also possible to synthesize polymers with cyclodextrins appended to the backbone.
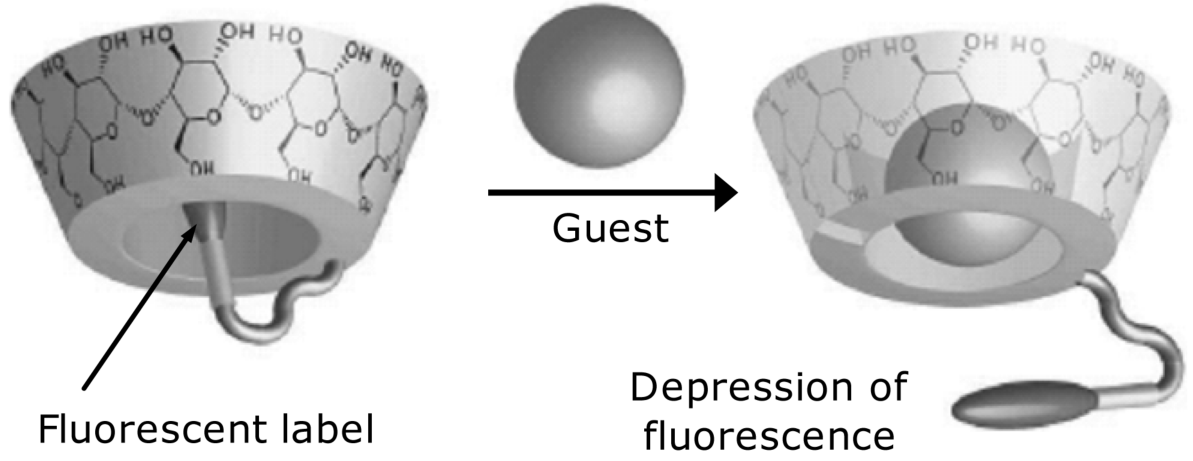
Common transduction procedures in affinity sensors are also applicable in cyclodextrin-based sensors. Thus, charged analytes can be detected by assessing the charge density or distribution at interface. Transduction by mass-sensitive devices is also appropriate. The peculiar molecular shape of cyclodextrins allows certain specific transduction methods to be devised. For example, Figure 6.13 depicts an optical method based on a fluorescent label tagged to the cyclodextrin molecule. In the absence of the guest, the label will be entrapped in the cavity. If the guest analyte binds stronger than the label, the label is displaced from the hydrophobic cavity and gets in contact with the aqueous milieu that affects the intensity of fluorescence light.
Figure 6.13 Turn-off fluorescent sensor using cyclodextrin as receptor and a fluorescent label inserted in the cavity. Label fluorescence is depressed after moving from the hydrophobic cavity into the aqueous milieu. Adapted from [27].
Properly modified cyclodextrins imparts excellent recognition properties for neutral or charged organic and bio-organic compounds [27–29]. The capacity of cyclodextrins to elicit chiral recognition deserves particular mention. In other words, cyclodextrins interact preferentially with a specific enantiomer in an enantiomer mixture. This is not surprising if one takes into account the fact that the sugar building blocks in cyclodextrins are themselves chiral compounds.
6.7.2 Calixarenes
Calixarenes are macrocyclic compounds formed by condensation of p-substituted phenols with formaldehyde [30]. Figure 6.14A emphasizes a calixarene derived from p-tert-butylphenol; it consists of a four-phenol residues. Calixarene molecules can be formed of more than four phenols, and the compound designation is done by including the phenol number. Thus, the compound in Figure 6.14a is a calix[4]arene, whereas calix[6]arene denotes a molecule including six phenol residues.
Figure 6.14 (A) Chemical structure of para-tert-butyl-calix[4]arene; (B) framework of a calixarene molecule in the cone conformation; (C) a resorcin[4]arene. Adapted with permission from [1]. Copyright John Wiley & Sons, Ltd.
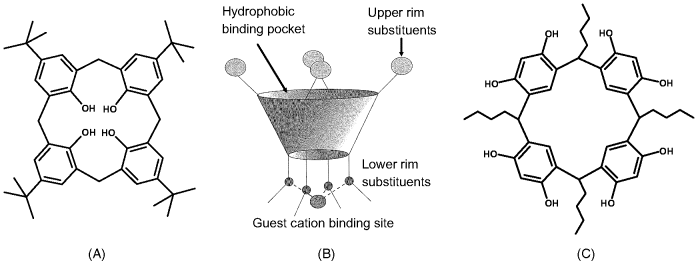
Calixarene molecules assume a three-dimensional basket shape (Figure 6.14B). Three distinct regions can be distinguished in a calixarene molecule: a wide upper rim, a narrow lower rim, and a central annulus. In calix[4]arenes, the internal volume is about 10 nm3. In calixarenes derived from phenol, the four hydroxyl groups are intra-annular at the lower rim (Figure 6.14A). Conversely, in a resorcin[4]arene, eight hydroxyl groups are placed extra-annular at the upper ring (Figure 6.14C). Hydroxyl groups at the rims can act as binding sites for calixarene functionalization in order to impart selectivity for various guest species.
According to the properties of the guest species, its interaction with a calixarene can occur either at a rim or within the annular region. Recognition by the rim regions is secured by suitable substituents. Thus, hydroxyls groups at the rim are able to form multiple hydrogen bonds with guest molecules with a suitable shape and size. Conversion of calix[4]arene hydroxyls into ethers imparts the lower rim specificity to Na+. Rim functionalization with charged groups allow for recognition of small charged proteins. Hydrophobic species of fitting size can be accommodated within the intracavity. At the same time, π-electrons in this region can interact with certain metal ions by coordinate bonding. Other recognition possibilities arise from building up receptor sites sandwiched between two calixarene fragments.
It is obvious that calixarene molecules can be tailored such as to recognize various types of analytes [31]. Most of the current applications refer to ion sensors [32, 33] based on either potentiometric or optical transduction methods [34]. Sensing of biocompounds by means of calixarene receptors is also achievable. For example, a carboxyl-derivatized calixarene embedded in a lipid layer interacts with cytochrome c by electrostatic forces [35]. Potential applications of calixarenes in enantioselective sensing have also been envisaged.
6.7.3 Molecularly Imprinted Polymers (MIPs)
Recognition by natural receptors relies on the complementarity of the binding site and the analyte as far as both shape and interactive groups are concerned. This principle has been exploited to prepare synthetic receptors in the form of cavities in a polymer structure leading to the development of molecularly imprinted polymers (MIPs) [36–38].
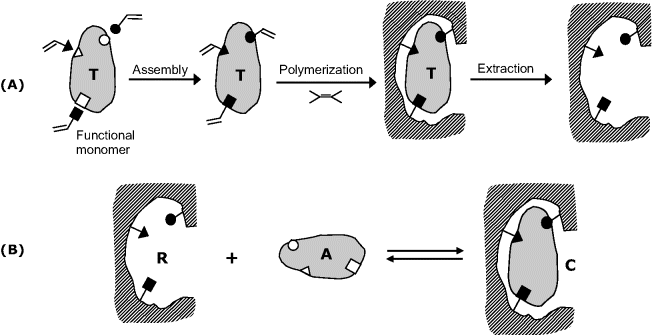
Molecular imprinting is a method to produce specific recognition sites for a target molecule in a synthetic polymer matrix. Fabrication of MIPs involves several steps, as shown in Figure 6.15A. First, a template (the analyte or a similar derivative) is assembled with functionalized monomers linked to specific groups in the template. Next, a polymer matrix is formed by copolymerization in the presence of nonfunctionalized monomers. During this process, the template is incorporated into small cavities shaped after its form and also featuring overhanging functional groups. The polymer monolith is then mechanically ground to obtain micrometer-sized particles. Finally, the template is removed leaving free receptor sites imprinted in the rigid polymer. The imprint maintains a steric (size, shape) and chemical (special arrangement of complementary groups) memory of the template. The analyte binds reversibly to such sites (Figure 6.15B) with selectivity close to that of the antibody–antigen interaction.
Figure 6.15 Synthesis (A) and recognition (B) by molecularly imprinted polymers. T is the template, A is the analyte and R is the receptor site.
Assembly of the template with the functional monomers can be carried out by either covalent or noncovalent binding. The covalent approach is more time consuming but the yield of binding sites is higher and their distribution is more homogeneous. Noncovalent assembly allows for more expedient fabrication but, due to the weak interactions between the template and functionalized monomers, both the yield and homogeneity may be somewhat inferior.
The most widely used MIPs materials are acrylic and vinyl polymers. There is a vast choice of suitable monomers to produce such materials and a selection is made in accordance with the expected properties of the binding site. By selecting a suitable monomer, the cavity surface can be tailored so as to be hydrophobic, electrically charged, or providing hydrogen bonding. In this way, one obtains an analyte-compatible microenvironment within the cavity.
The molecular imprinting technique can be applied to a wide range of target molecules. The imprinting of small molecules (for example, pharmaceuticals, pesticides, amino acids, peptides, nucleotide bases and sugars) is well established. Techniques for imprinting proteins and other macromolecular compounds have also been developed [39, 40].
Molecularly imprinted polymer membranes are particularly advantageous in sensor applications. Such membranes can be prepared at a metal surface by electrochemical polymerization or at an insulator surface by chemical grafting or by using polymerization initiators linked to the surface. The membrane thickness should be below 100 nm in order to allow for free diffusion of analyte molecules to the receptor sites. Thicker membranes are also effective if the material has a porous structure.
Clearly, it is advantageous to use MIPs with a high density of imprinted sites. In order to quantify this parameter, the imprinting efficiency (IE) has been introduced [41]. This parameter refers to a polymer attached to the transducer surface and is defined by the following equation in which NMIP represents a nonimprinted polymer similar to the MIP:
(6.13) ![]()
This parameter cannot be easily measured but it can be estimated by the signal enhancement ratio (SE):
(6.14) ![]()
The term in the denominator of the above ratio is assessed by a control sensor whose surface is coated by the nonimprinted polymer.
Substantially improved characteristics have been noticed with MIP nanomaterials such as nanobeads or nanofibers [42]. Bare MIP nanoparticles provide much higher density of accessible receptor sites and faster analyte diffusion to the receptors. Alternatively, a very thin MIP layer can be formed on inert nanoparticles in the core–shell configuration. In this arrangement, the core particle can also act as support to reporting elements such as fluorescent labels. Prospects for MPSs application in the development of sensor microarrays are very promising.
As far as the transduction is concerned, common affinity sensor transduction methods are also suitable for the MIPs-based sensors. Widely used are the mass-sensitive transducers [43], but methods based on ionic conduction or luminescent labels are also currently applied [38, 44].
MIPs are very promising as substitutes for natural receptors in affinity sensors [44]. The main benefits arise from facile receptor tailoring for a very broad range of target species, from ions and small molecules to macromolecular compounds. Also, the good stability and the possibility of obtaining MIPs in various physical forms such membranes or nanoparticle render these materials very attractive in various applications [38, 44–46].
6.8 Outlook
A broad spectrum of recognition methods rely on affinity reactions, that is, strong noncovalent association resulting in the formation of a stable receptor–ligand complex. By far, the most advanced field in this class is represented by immunosensors that are used as diagnostic tools in clinical analysis [47, 48] and also in environment monitoring [49, 50] and also in food industry [51, 52] for the detection of pathogens, allergens and organic pollutants.
Although chemoreceptors are less selective than antibodies, they have found a series of interesting applications. The reduced selectivity of chemoreceptors could be an advantage when screening for a particular class of analytes. Thus, the presence of illegal drugs in a sample can be expediently assessed by means of a chemoreceptor-based sensor, while the detection of a specific analyte within this class can be next performed by means of an antibody-based method. The advent of molecularly imprinted polymers and other receptors of nonbiological origin expands the field of application of affinity reactions and provides new possibilities of fabricating more rugged affinity sensors. At the same time, nanomaterials open new opportunities for improving the characteristics of affinity sensors [54]. A series of well-documented protocols for affinity sensors are available [55].
A particular mention deserve nucleic acid aptamers, that are synthetic nucleic acids that mimic the antibody behavior and hence interact selectively with proteins or small-molecules [56]. More details on nucleic acid aptamers are available in Chapter 7. Synthetic peptides (peptide aptamers) that emerged as a new class of recognition receptors show excellent potential for application in multiplexed assays.
1. Steed, J.W. and Atwood, J.L. (2009) Supramolecular Chemistry, John Wiley & Sons, Chichester.
2. Cragg, P.J. (2010) Supramolecular Chemistry: From Biological Inspiration to Biomedical Applications, Springer, Dordrecht.
3. Diamandis, E.P. and Christopoulos, T.K. (eds) (1996) Immunoassay, Academic Press, San Diego, Calif.
4. Liddel, E. (2005) Antibodies, in The Immunoassay Handbook (ed. D. Wild), Elsevier, Amsterdam, pp. 144–166.
5. Byrne, B., Stack, E., Gilmartin, N. et al. (2009) Antibody-based sensors: Principles, problems and potential for detection of pathogens and associated toxins. Sensors, 9, 4407–4445.
6. Bange, A., Halsall, H.B., and Heineman, W.R. (2005) Microfluidic immunosensor systems. Biosens. Bioelectron., 20, 2488–2503.
7. Marquette, C.A. and Blum, L.J. (2006) State of the art and recent advances in immunoanalytical systems. Biosens. Bioelectron., 21, 1424–1433.
8. Walker, M.R., Stott, R.A., and Thorpf, G.H.G. (1992) Enzyme-labelled antibodies in bioassay, in Bioanalytical Applications of Enzymes (eds C.H. Suelter and L.J. Kricka), John Wiley & Sons, New York, pp. 179–207.
9. Crowther, J.A. (1995) ELISA: Theory and Practice, Humana Press, Totowa, N.J.
10. Deshpande, S.S. (1996) Enzyme Immunoassays: From Concept to Product Development, Chapman & Hall, New York.
11. Cosnier, S. (2005) Affinity biosensors based on electropolymerized films. Electroanalysis., 17, 1701–1715.
12. Varlan, A.R., Suls, J., Jacobs, P. et al. (1995) A new technique of enzyme entrapment for planar biosensors. Biosens. Bioelectron., 10, R15–R19.
13. Langone, J.J. (1982) Protein A of Staphylococcus aureus and related immunoglobulin receptors produced by Streptococci and Pneumococci. Adv. Immunol. 32, 157–252
14. Donahue, A.C. and Albitar, M. (2010) Antibodies in biosensing, in Recognition Receptors in Biosensors (ed. M. Zourob), Springer Science, New York, pp. 221–248.
15. Liotta, L.A., Espina, V., Mehta, A.I. et al. (2003) Protein microarrays: Meeting analytical challenges for clinical applications. Cancer Cell, 3, 317–325.
16. Herr, A.E. (2009) Protein microarrays for the detection of biothreats, in Microarrays (eds K. Dill, P. Grodzinski, and R.H. Liu), Springer, New York, pp. 169–190.
17. Kingsmore, S.F. (2006) Multiplexed protein measurement: Technologies and applications of protein and antibody arrays. Nature Rev. Drug Discovery, 5, 310–320.
18. Min, D.H. and Mrksich, M. (2004) Peptide arrays: Towards routine implementation. Curr. Opin. Chem. Biol., 8, 554–558.
19. Panicker, R.C., Sun, H., Chen, G.Y.J. et al. (2009) Peptide-based microarray, in Microarrays (eds R.A. Potyailo, K., Dill, P. Grodzinski, and R.H. Liu), Springer, New York, pp. 139–167.
20. Tothill, I.E. (2010) Peptides as molecular receptors, in Recognition Receptors in Biosensors (ed. M. Zourob), Springer Science, New York, pp. 249–274.
21. Taylor, R.F. (1991) Immobilized antibody- and receptor-based biosensors, in Protein Immobilization: Fundamentals and Applications (ed. R.F. Taylor), M. Dekker, New York, pp. 263–303.
22.Cornell, B.A. (2008) Ion channel biosensors, in Handbook of Biosensors and Biochips (ed. R.S. Marks, D.C. Cullen, I. Karube, C.R. Lowe and H.H. Weetall), John Wiley & Sons, New York.
23. Sugawara, M., Hirano, A., Buhlmann, P. et al. (2002) Design and application of ion-channel sensors based on biological and artificial receptors. Bull. Chem. Soc. Jpn., 75, 187–201.
24. Luo, L.Q., Yang, X.R., and Wang, E.K. (1999) Ion channel sensor. Anal. Lett., 32, 1271–1286.
25. Szejtli, J. (1998) Introduction and overview of cyclodextrin chemistry. Chem. Rev., 98, 1743–1753.
26. Dodziuk, H. (ed.) (2006) Cyclodextrins and Their Complexes: Chemistry, Analytical Methods, Applications, Wiley-VCH, Weinheim.
27. Ogoshi, T. and Harada, A. (2008) Chemical sensors based on cyclodextrin derivatives. Sensors, 8, 4961–4982.
28. Shahgaldian, P. and Pieles, U. (2006) Cyclodextrin derivatives as chiral supramolecular receptors for enantioselective sensing. Sensors, 6, 593–615.
29. Hayashita, T., Yamauchi, A., Tong, A.J. et al. (2004) Design of supramolecular cyclodextrin complex sensors for ion and molecule recognition in water. J. Incl. Phenom. Macrocycl. Chem., 50, 87–94.
30. Gutsche, C.D. (1998) Calixarenes Revisited, Royal Society of Chemistry, Cambridge.
31. Diamond, D. and McKervey, M.A. (1996) Calixarene-based sensing agents. Chem. Soc. Rev., 25, 15–24.
32. Arora, V., Chawla, H.M., and Singh, S.P. (2007) Calixarenes as sensor materials for recognition and separation of metal ions. Arkivoc., 172–200.
33. El Nashar, R.M., Wagdy, H.A.A., and Aboul-Enein, H.Y. (2009) Applications of calixarenes as potential ionophores for electrochemical sensors. Curr. Anal. Chem., 5, 249–270.
34. Leray, I. and Valeur, B. (2009) Calixarene-based fluorescent molecular sensors for toxic metals. Eur. J. Inorg. Chem., 3525–3535.
35. Mohsin, M.A., Banica, F.G., Oshima, T. et al. (2010) Electrochemical impedance spectroscopy for assessing the recognition of cytochrome c by immobilized calixarenes. Electroanalysis, 23, 1229–1235.
36. Komiyama, M. (2003) Molecular Imprinting: From Fundamentals to Applications, Wiley-VCH, Weinheim.
37. Haupt, K. (2003) Molecularly imprinted polymers: The next generation. Anal. Chem., 75, 376A–383A.
38. Haupt, K. (2001) Molecularly imprinted polymers in analytical chemistry. Analyst, 126, 747–756.
39. Bossi, A., Bonini, F., Turner, A.P.F. et al. (2007) Molecularly imprinted polymers for the recognition of proteins: The state of the art. Biosens. Bioelectron., 22, 1131–1137.
40. Bergmann, N.M. and Peppas, N.A. (2008) Molecularly imprinted polymers with specific recognition for macromolecules and proteins. Prog. Polym. Sci., 33, 271–288.
41. Suryanarayanan, V., Wu, C.T., and Ho, K.C. (2010) Molecularly Imprinted Electrochemical Sensors. Electroanalysis, 22, 1795–1811.
42. Tokonami, S., Shiigi, H., and Nagaoka, T. (2009) Review: Microl- and nanosized molecularly imprinted polymers for high-throughput analytical applications. Anal. Chim. Acta, 641, 7–13.
43. Uludag, Y., Piletsky, S.A., Turner, A.P.F. et al. (2007) Piezoelectric sensors based on molecular imprinted polymers for detection of low molecular mass analytes. FEBS J., 274, 5471–5480.
44. Danielsson, B. (2008) Artificial receptors, in Biosensing for the 21st Century, Springer, Berlin, pp. 97–122.
46. Bui, B.T.S. and Haupt, K. (2010) Molecularly imprinted polymers: synthetic receptors in bioanalysis. Anal. Bioanal. Chem., 398, 2481–2492.
47. Haupt, K. and Mosbach, K. (2000) Molecularly imprinted polymers and their use in biomimetic sensors. Chem. Rev., 100, 2495–2504.
48. Luppa, P.B., Sokoll, L.J., and Chan, D.W. (2001) Immunosensors-principles and applications to clinical chemistry. Clin. Chim. Acta, 314, 1–26.
49. Aizawa, M. (1994) Immunosensors for clinical analysis. Adv. Clin. Chem., 31, 247–275.
50. Jiang, X.S., Li, D.Y., Xu, X. et al. (2008) Immunosensors for detection of pesticide residues. Biosens. Bioelectron., 23, 1577–1587.
51. Mallat, E., Barcelo, D., Barzen, C., et al. (2001) Immunosensors for pesticide determination in natural waters. TrAC-Trends Anal. Chem., 20, 124–132.
52. Yadav, R., Dwivedi, S., Kumar, S. et al. (2010) Trends and Perspectives of Biosensors for Food and Environmental Virology. Food Environ. Virol., 2, 53–63.
53. Rasooly, A. and Herold, K.E. (2006) Biosensors for the analysis of food- and waterborne pathogens and their toxins. J. AOAC Int., 89, 873–883.
54. Liu, G.D. and Lin, Y.H. (2007) Nanomaterial labels in electrochemical immunosensors and immunoassays. Talanta, 74, 308–317.
55. Rogers, K.R. and Mulchandani, A. (eds) (1998) Affinity Biosensors: Techniques and Protocols, Humana Press, Totowa.
56. Crawford, M., Woodman, R., and Ferrigno, P.K. (2003) Peptide aptamers: Tools for biology and drug discovery. Brief. Funct. Genom., 5, 72–79.