
CHAPTER 5
PREDICTING MICRORNA PROSTATE CANCER TARGET GENES
5.1 INTRODUCTION
MicroRNAs (or miRNAs) are a class of noncoding RNA (RNA) of 18–25 nucleotides (nt) in length regulating gene expression that were first described in 1993 by Lee et al. [1], while the term RNA was first introduced in 2001 [2]. The miRNAs are capable of base pairing with imperfect complementarity to the transcripts of animal protein-coding genes (also termed targets), usually within the 3′ untranslated region ({3′}–UTR). The miRNAs are involved in several biological and metabolic pathways and play a very important role in many diseases (e.g., cancer [3], alzheimer’s disease [4], Parkinson’s disease [5], and viral infections [6]).
Because animal miRNAs form base pairing with imperfect complementarity, computational prediction of miRNA targets is not an easy task, and nowadays many miRNA target prediction programs have been developed and applied.
The Mirecords website available at (http://mirecords.umn.edu/miRecords/) shows a continuously updated list of biologically validated gene targets of known RNAs in humans and other animals (as reported by the scientific literature) together with the RNA target predictions obtained by various target prediction programs. This list tells us that much more work must be done in order to obtain reliable RNA target prediction methods. The reason is because (1) at present there are target genes biologically validated that are not predicted by any method; (2) the considered methods seldom agree; (3) even where there is a concordance concerning the target gene between the biological procedure and the prediction of a computational method, this cannot be considered a final validation of the prediction method as the available biological procedures are not able to detect the specific RNA target site.
This chapter presents an approach to improve the state of the art of computational prediction of target sites, by identifying several refinements of the available algorithms, and providing an optimization of the parameters involved so as to maximize the adherence of results to biological evidence. The increased selectivity of the method may also be used to guide the experimental validation in a more focused direction. The proposed approach applies a genetic algorithm [7] to fine-tune the parameters of the analysis chain exploiting the biological knowledge on RNA and genes involved in prostate cancer.
The following sections discuss the role of miRNAs in prostate cancer. Sections 5.3 and 5.4, present the most diffused software tools for RNA gene target prediction. Sections 5.5–5.7 show our approach and the experimental analysis. The discussion and conclusions are in Section 5.8.
5.2 miRNA AND PROSTATE CANCER
MicroRNAs or miRNAs are small noncoding RNAs of 18–25 nucleotides in length. The miRNA genes are generally transcribed by RNA polymerase II [8] even though it was recently documented that RNA polymerase III might be involved as well [9]. MicroRNA is derived from a complex process of maturation of its primary transcript named pri-miRNA, a molecule capped at the 5′ end, polyadenylated at the 3′ end similarly to mRNAs and containing a local stem–loop structure, a terminal loop, and two flanking single-stranded arms. Then, the pri-miRNA is processed into a 70 nt hairpin-like precursor miRNA named pre-miRNA by a multienzymatic complex composed of the RNase III enzyme Drosha and the double-stranded RNA binding protein DGCR8/Pasha [10]. Next, the pre-miRNA is transported from the nucleus to the cytoplasm and diced into miRNA duplexes together with a double-stranded RNA binding-domain protein named TRBP by RNaseIII nuclease Dicer. After Dicer processing, the miRNA duplex is unwound, the released mature miRNA binds to a protein named Argonaute, the RNA strand of the miRNA duplex complementary to the mature miRNA is degraded and the mature miRNA is then free to interact with its mRNA targets. More details about miRNA biogenesis can be found in [20].
The miRNAs are involved in lung, prostate, breast, and colorectal cancer. [13–18] Following a simple view, if a certain RNA target binds tumor suppressor genes, it is supposed to be an oncogene, but, if a RNA targets an oncogene, it might be viewed as a tumor suppressor gene. However, things may be far more complicated, as each RNA can mediate the expression of hundreds of mRNAs. The first evidence that RNAs may function as tumor suppressors has been reported in [19]. More details about the role of RNAs in cancer are presented in [20].
This chapter will focus on RNAs’ influence in prostate cancer. Prostate cancer (PC) is the second leading cause of cancer deaths in men [21. 22]. It is not invariably lethal, however, and is a heterogeneous disease ranging from asymptomatic to a rapidly fatal systemic malignancy. The prevalence of PC is so high that it could be considered a normal age-related phenomenon. In spite of the availability of biomarkers for PC, the basic molecular mechanisms regulating its development and progression are still very poorly understood. These observations have led researchers to speculate that other key factors might play a role in PC pathogenesis and/or progression. Different studies demonstrated aberrant expression of several miRNAs in PC cells (e.g., let-7c, miR-19b, miR-20a, miR-29b, miR-100, miR-125b, miR-126*, miR-128b, miR-146a, miR-146b, miR-184, miR-221, miR-222, miR-361, miR-424 miR-663) [23–28]. Although a number of PC related miRNAs were discovered, to date, only five are characterized for their functionalities: three as oncogenes and two as tumor suppressors (miR-20a, miR-125b, miR-126*, miR-146a, and miR-221/222). Oncogenic miRNAs downregulate the expression of apoptosis-related genes, and tumor suppressor miRNAs target the proliferation related genes. Due to the oncogenic or tumor-suppressive properties of PC related miRNAs, they might be considered as new potential biomarkers, but more importantly as therapeutic targets for PC treatment in the near future.
Research efforts are therefore currently focusing on the discovery of more precise markers, which are needed so that appropriate treatment decisions can be made for individual patients, and on the characterization of genetic pathways involved in the development and progression of the disease. However, simply identifying the list of genes involved in a disease is only a first step in the process. There is the need for identifying more refined information (e.g., the interaction between the various steps in the pathway).
5.3 PREDICTION SOFTWARE FOR miRNAS
The discovery of RNAs acting in PC pathways and the identification of the specific sites where they act is a major advance in the identification of regulatory networks that lead to the development and progress of the disease. The overall activity aims to develop and use novel computational (in silico) methods for predicting both novel RNAs and target genes and sites, with the long-term goal to substantially improve the knowledge about PC, and consequently the development of ad hoc therapies.
The RNA genes are identified on a large scale using direct biochemical cloning and computational approaches [29, 30]. It has been estimated that there are as many as 1000 RNAs in the human genome. As RNA sequences are identified they are collected in several databases including miRBase and MicroRNAdb [31].
The other goal is to identify and experimentally validate mRNA gene targets. Nowadays high-throughput approaches to validate RNA targets experimentally are lacking. Only few nonhigh-throughput experimental approaches, which are not able to detect the specific RNA target site, are available, (e.g., using a luciferase reporter construct by cloning the predicted binding site sequence of the RNA into the 3′–UTR region) [32, 33], and then transfecting the RNA into a cell line containing the luciferase reporter to access the effect of the RNA on luciferase expression [34].
Researchers can publish discovered RNA target data and experimental details into the public domain by submitting they results to some databases recently realized, including miRBase [31] and RNAMAP [35], Mirecords, Argonaute [36], and TarBase [37, 38].
A large number of target prediction algorithms have been developed to guide the experimental validation in a more focused direction. Presently, the cited databases contain only a limited number of confirmed RNA targets (i.e., true positives). An even more limited number of known RNAs do not interact with a target gene (i.e., true negatives), so it is very difficult to develop RNA target prediction algorithms with high sensibility and selectivity, by using, for example, neural networks or support vector machines [39].
A particular microRNAs can base-pair with perfect or imperfect complementarity to the transcripts of several hundred animal protein-coding genes (also termed targets), generally within the {3′}–UTR. A large number of target prediction algorithms have been developed since direct experimental methods for discovering RNA targets are lacking.
In plants, RNA targets are computationally identified through the extensive complementarity between RNAs and their corresponding targets. However, computational identification of RNA targets in mammalian RNAs is considerably more difficult because most animal RNAs only partially hybridize to their mRNA targets.
The miRNA target prediction programs typically rely on a combination of specific base-pairing rules and conservational analysis to score possible 3′–UTR recognition sites and enumerate putative gene targets. Predictions based solely on base-pairing rules yield a large number of false-positive hits. The number of false-positive hits, as estimated by random shuffling of RNA sequences, can be greatly reduced, however, by limiting hits to only those conserved in other organisms [40, 41]. By systematically varying selected RNA sequences and testing for their ability to repress a given target, several rules have been established for RNA:target binding [42–44]. Usually, only the {3′}–UTR of the mRNA is considered and sometimes it is possible to find more than one target site prediction for the same miRNA.
The miRNA target prediction tools have been applied in a variety of organisms with two primary aims. The first is to allow researchers to narrow down the list of potential gene targets for experimental confirmation and validation when searching for a particular RNA target. The second is to predict the number of genes regulated by RNAs and various global trends in RNA regulation.
As these algorithms predict between 10 and 30% of all genes that are regulated by miRNAs [45-47] and neither available tool can comprehensively elucidate all possible targets, suggest was for handling a variety of tools [38, 48], together were made.
Anyway, the most important goal is to ensure the selectivity and sensibility of a specific RNA target prediction software. To this aim, we describe the optimization process we applied to a miRanda [49] tool that nowadays is the most popular RNA target prediction method. Both the miRanda and our method will be described in the following sections. Here, we report the principal characteristics of other diffused RNA target programs:
- miTarget [50], based on a support vector machine (SVM) classifier [39], which uses features (e.g., the thermodynamic free energy of binding between the miRNA and possible target site), base complementarity at specific positions, and structural features (e.g., mismatches and bulges as input). This approach is limited, however, by the lack of availability of experimentally validated targets for classifier training.
- PicTar [51] first looks for perfect seed binding of seven nucleotides in the 5′ end starting at either the first or second position. The free energy of miRNA:target binding is then computed for seeds with imperfect matches. To delineate a list of predicted target sites, energy thresholds are imposed and then a maximum likelihood score is computed based on conservation across multiple organisms.
- PITA [52] incorporates the role of target-site accessibility, as determined by base-pairing interactions within the mRNA, in miRNA target recognition.
- RNA22 [53] finds putative miRNA binding sites in the sequence of interest, and then identifies the targeting miRNA.
- RNAhybrid [54] finds the minimum free energy hybridization of a long and a short RNA.
- TargetScan [41] computes seed-binding sites based on perfect complementarity of a seven nucleotide region conserved across five organisms (chicken, mouse, chimp, human, and dog) between bases 2–8 on the 5′ end of the miRNA.
- MicroTar evaluates miRNA–target complementarity and thermodynamic data [55].
- DIANA-microT [44], variant of miRanda, uses a modified initial base-pairing rule that focuses on the sizes of allowable bulges in initial seeds.
5.4 miRANDA
In 2003, (available at http://www.microuppercase{RNA}.org/microuppercase{RNA}/home.do) Enright et al. [49] proposed miRanda that nowadays is the most popular miRNA target prediction method. The miRanda [40, 49] splits the target gene prediction task into three distinct steps carried out in sequence: (1) homology evaluation; (2) free energy computation; (3) evolutionary conservation computation. In the following description of miRanda, we will present the values of parameters used in the last release of the package (Sept. 2008) (available athttp://cbio.mskcc.org/miRanda-sept2008.tar.gz).
5.4.1 Homology Evaluation
The first step in miRanda is based on sequence matching: miRNA and 3′–UTR miRNA sequences are aligned in order to find sites with a certain level of complementarity, to assess if there are any potential binding sites. Sequence alignment is carried out using a slightly modified version of the Smith–Waterman algorithm [56], a dynamic-programming based technique.
The Smith–Waterman algorithm is usually used to compute subsequence alignment based on matching nucleotides. However, miRanda uses it to compute alignment based on complementarity rather than match: the score matrix assigns positive scores to complementary nucleotides (AU) and G=U “wobble” pairs (GU), which are important for the accurate detection of RNA:RNA duplexes [57], and negative scores (M) to all other base pairs, as reported in Table 5.1; penalties are also applied for gap opening (GO) and extension (GE).
TABLE 5.1 Values of Parameters Used by miRandaa
In addition, following observation of known target sites, the algorithm applies a scaling factor (SF) to the first 11 positions of the miRNA, to reflect 5′–3′ asymmetry, and some empirical rules: (a) no mismatches are accepted at position 3–12; (b) at least one mismatch should be present between positions 9 and L-5 (where L is total alignment length); and (c) fewer than two mismatches can be present in the last five positions of alignment. A homology threshold (HT) parameter is defined as the score for a perfect 7 nt match in the {3′}–UTR side of the miRNA:
The algorithm computes various nonoverlapping alignments and only those alignments whose score exceeds HT are considered potential binding sites and passed to the subsequent processing step, that is, the free energy computation, as free energy computation is a very demanding task in term of computational complexity.
5.4.2 Free Energy Computation
The second step of the miRanda method is computation of the free energy (Δ G), carried out using the RNA folding routine RNAfold included in the Vienna RNA secondary structure library (RNAlib) (available at http://www.tbi.univie.ac.at/RNA/) [57]. This routine computes the secondary structure and the free energy of a single RNA sequence folding. To obtain the co-folding of miRNA and the {3′}–UTR of miRNA sequences, the two sequences are joined in a single sequence with an artificial, linker sequence containing 5 ‘X’ that cannot base pair. Again only hybridization sites whose free energy is under a given threshold (Δ F) are considered valid.
5.4.3 Evolutionary Conservation Computation
The third step of miRanda method is the computation of the evolutionary conservation. This is a third filter applied to binding sites that passed the previous two filtering stages. In order to reduce false positives, only predicted target sites that are conserved among different species are considered valid.
The evolutionary conservation computation is carried out using PhastCons (available at http://compgen.bscb.cornell.edu/phast) [58,59] that is a software tool based on a phylogenetic hidden Markov model (phylo-HMM) able to estimate the degree of sequence conservation starting from a multialignment of different sequences. PhastCons is not integrated in the miRanda code, so this computation is carried out after the execution of the miRanda program itself.
5.5 PROPOSED METHOD
Table 5.1 shows the parameters used in the latest release of miRanda (Sept. 2008): the rewards and the penalties for match and mismatch, the temperature for free energy estimation, and the thresholds on homology and free energy. All these parameters have been manually optimized in order to reduce the false positives and negatives detection of target genes according to biological knowledge available in 2003–2004, when the method was presented [40, 49], and then updated in the same way in the following years. Moreover, as already reported, the usage of the RNAfold function to estimate the free energy of the hybridization is tricky because this routine is optimized to compute the secondary structure folding for a single RNA sequence, and cofolding of the miRNA and miRNA sequence is obtained using an artificial linking sequence.
This chapter presents a complete rewriting and rebuilding of miRanda, providing some improvements and updates to the original program. Our work is aimed at obtaining a computational prediction of target sites with higher selectivity to be used for guiding the experimental validation in a more focused direction. To this aim, we exploit the updated knowledge on biologically validated {miRNA} gene targets available in the Mirecords website, using the information related to genes and miRNA involved in human PC only, as reported in the recent literature.
For free energy calculation, instead of RNAfold, we use the RNAcofold routine recently introduced in the Vienna RNA library [60]. The RNAcofold is specifically intended to compute the cofolding of two The RNA sequences. The RNAcofold works much like the RNAfold, but allows us to specify two RNA sequences that are then allowed to form a dimer structure. The RNAcofold can compute minimum free energy structures, as well as partition function and base-pairing probability matrix. Since dimer formation is concentration dependent, RNAcofold can be used to compute equilibrium concentrations for all five monomer and (homo/hetero)-dimer species, given input concentrations for the monomers. Using this routine, we can obtain a reliable estimation of free energy, without using the trick related to the usage of the RNAfold routine.
Moreover, in our approach we do not include the third step of miRanda evaluating the evolutionary conservation, because while conservation has been a primary aspect used to filter hits in most target prediction algorithms, not all target sites are necessarily conserved [20]. See the case of target human genes for specific miRNAs. Note that other newly developed programs use machine learning approaches instead of reliance on conservation [50, 55, 61], even if the lack of availability of experimentally validated targets for classifier training limits the validity of their results.
In miRanda, the tuning of parameters involved in computational prediction of target sites is done manually on the basis of recent scientific literature. In our case, we studied a machine learning approach exploiting the Mirecords website. As Mirecords website and other miRNA target genes repositories report only (few) positive examples (i.e., biologically validated miRNA gene targets) and an even more limited number of miRNAs known to not interact with a target gene (i.e., true negatives), we decided not to apply machine learning-based methods, like neural networks or support vector machines [39]. We approached this one-class prediction problem by implementing a quick automatic parameter tuning technique based on a genetic algorithm, shown in Section 5.6.
5.6 AUTOMATIC PARAMETER TUNING
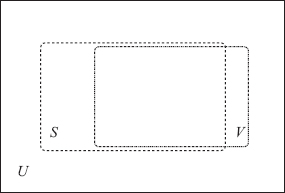
The one-class prediction approach we have implemented is based on the following assumption: Given the set U of all genes taken into account, an optimal tuning of parameters should allow us to improve the match between the set S of genes selected as predicted targets and the set V of biologically validated target genes, as reported in Mirecords (see Fig. 5.1).
FIGURE 5.1 Here U is the set of all genes taken into account, S is the set of genes selected as predicted targets, and V is the set of biologically validated target genes.
Let us introduce the following notations: ![]() where |X| is the cardinality (size) of set X. In our approach, more emphasis has been put on increasing the size
where |X| is the cardinality (size) of set X. In our approach, more emphasis has been put on increasing the size ![]() of the intersection of S and V (lowering the false negative rate) than on decreasing the size
of the intersection of S and V (lowering the false negative rate) than on decreasing the size ![]() of their difference S V since the goal is not to miss any of the biologically validated genes. Indeed, predicting some genes that are not validated is a desirable behavior, because these can be submitted for further lab testing, and hopefully could lead to discovery of new, experimentally validated target sites. We can express this goal as the maximization of
of their difference S V since the goal is not to miss any of the biologically validated genes. Indeed, predicting some genes that are not validated is a desirable behavior, because these can be submitted for further lab testing, and hopefully could lead to discovery of new, experimentally validated target sites. We can express this goal as the maximization of
subject to a penalty if ![]() , that can be expressed by a Fermi’s sigmoid function:
, that can be expressed by a Fermi’s sigmoid function:
To this aim, we used a genetic algorithm (GA) [7, 62], even if other global search techniques (e.g., simulated annealing [63], particle swarm optimization [64], or harmony [25]) could be employed. Genetic algorithms are global search heuristics to find exact or approximate solutions to minimization or maximization problems, and are based on techniques inspired by evolutionary biology (e.g., selection, crossover, and mutation). Genetic algorithms are implemented as a computer simulation in which a population of abstract representations (chromosomes or genotypes) of candidate solutions (individuals or phenotypes) to an optimization problem evolves toward better solutions. Traditionally, solutions are represented as binary strings (sequences of 0s and 1s), but other encodings are also possible. The evolution usually starts from a population of randomly generated individuals and happens in generations. In each generation, the fitness of every individual in the population is evaluated, multiple individuals are randomly selected from the current population (on the basis of their fitness), and recombined and mutated to form a new population. The new population is then used in the next iteration of the algorithm. The GA terminates when either a maximum number of generations has been produced, or a satisfactory fitness level has been reached for the population.
5.7 EXPERIMENTAL ANALYSIS
5.7.1 Data Set Considered
Candidate target genes have been selected from among those that are involved in pathways related to PC. These targets were obtained from different sources. The first source is [65], where three subtypes of PC are identified at the molecular level and a notable clinical relevance of the subtypes is observed. This study includes a selection of the genes found to be the most discriminative between one subtype and the other two. Another source is [14], where the specific role of two, closely related miRNAs (miR-15a and miR-16-1) have been experimentally observed in PC. These studies suggest the use of a set of genes from which we have selected an overall data set of 50. We focused on miR-1, a miRNA proven to be involved in mechanisms related to PC [13, 15]. Eight of the genes in the data set are reported as a biologically validated target for miR-1 on the Mirecords website. The available data set of candidate target genes was randomly split into two data sets of 25 each, labeled as A and B, containing four validated targets each. Training was performed with miR-1 on data set B, and the resulting parameters have been used for testing on data set A by cross-validation.
5.7.2 Search Methodology
The tuning of the parameters has been performed by using the GALOPPS 3.2.4 (available at http://garage.cse.msu.edu/software/galopps/) package [66] by Goodman that extends and optimizes the implementation of the simple genetic algorithm (SGA) [7].
TABLE 5.2 GA—Genotype/Phenotype
We used D1, Eq. (5.3), as the fitness function. In the third column, Table 5.2 shows the size in bits of the fields of the chromosome assigned to the different parameters of our method (referred to the “genotype”), and in the fourth column the range of the intervals assigned to them (in terms of the “phenotype”, i.e., the actual values). All integer values in the genotype, except for the scale factor, are treated as fixed-point numbers with 2 bits for the fractional part. The homology threshold variation (HV) parameter is defined as a percentage variation from the theoretical threshold resulting from Eq. (5.1) and the parameters from the phenotype. The GA parameters have been selected after many attempts and are presented in Table 5.3.
TABLE 5.3 Selected Parameters for GA Training
The training task on training set B was repeated several times with different random seeds. In Section 5.2.3, we report the result with the best performances on the test set A.
5.7.3 Results
On a single core Intel laptop with 1600 MHz clock and Linux operating system, the GA finds an optimal solution in 10 min, after 14 generations (iterations) with ![]() = 4 and
= 4 and ![]() = 3. The values of tuned parameters are shown in column three of Table 5.1.
= 3. The values of tuned parameters are shown in column three of Table 5.1.
On the left of Table 5.4, we report the results obtained by the training on data set B and on the test set A. Column three shows the candidate target genes found, column four shows their free energy, and the last column indicates if the gene is reported as biologically validated on the Mirecords website.
TABLE 5.4 Results on hsa-miR-1a
On the right side of the same table, we report the results obtained with miRanda using its original parameters [49] presented in column two of Table 5.1.
Note that the {3′}–UTR region of a miRNA can contain multiple target sites for an assigned miRNA. In the shown results site, multiplicity is not taken into account.
As in miRanda and the proposed method, the free energies are computed according to two different library routines (RNAfold vs RNAcofold), and we cannot compare their absolute values. Therefore, we rank the target genes according to their free energy values, so that we can compare ranks instead of actual values. Note that the validated targets with the proposed method are consistently at the highest positions of the list (where the most negative value is the best); this does not hold for miRanda.
To objectively assess this fact, we compare the results obtained by the two methods by using the following performance index ranging in the interval [0,1]:
where: r(i) is the rank of the target gene in the list of results, ordered by the value of free energy; v(i) is 1 if the target is validated in miRecords, 0 otherwise. In both data sets, the performance index R of the proposed method is higher than that obtained using miRanda, showing that our method is more selective.
Note that, given the lack of validated miRNA targets (true positives) and validated nontargets (true negatives) in Mirecords and in the other the available databases, it is not possible to perform a depth comparison of the two target prediction algorithms on the basis of more standard metrics for sensitivity and selectivity.
5.8 DISCUSSION AND CONCLUSIONS
As available methods for miRNA discovering miRNA targets are not high throughput, and in general are not completely satisfactory, a large number of target prediction algorithms have been developed, but they show low sensibility and selectivity. Consequently, there are several target genes reported as experimentally validated in databases like miRBase [31] and miRNAMAP [35], Mirecords, Argonaute [36], TarBase [37, 38], that are not predicted by any method or for which the methods seldom agree. Moreover, as the experimental approaches to miRNA targets validation are unable to detect the specific miRNA target site, even when the same target gene is experimentally validated by the biological procedure and predicted by a computational method, this concordance cannot be considered a final validation.
This chapter presented a complete rewriting and rebuilding of the miRanda tool [40, 49] aimed at obtaining a more reliable computational prediction of target sites. Our approach makes use of the updated knowledge about biologically validated {miRNA} gene targets, especially those related to PC, which is available in the Mirecords website for tuning the parameters using a GA. We apply the RNAcofold routine for free energy calculation recently introduced in the Vienna RNA library [60], and we do not include the third step of miRanda evaluating the evolutionary conservation, since in the case of target human genes for specific miRNAs not all target sites are necessarily conserved [20].
The proposed approach shows a higher selectivity than miRanda and can be considered a good candidate for guiding the experimental validation in a well-focused direction. Moreover, we achieve fast parameter tuning instead of the long manual process needed for other tools, (e.g., miRanda), thanks to the application of the GA. Moreover, as the base of known miRNAs grows with new experimentally validated target sites, the procedure presented in this chapter can be used to refine the method to reflect the increased knowledge, in an incremental way.
Note that other criteria than those considered may be important in identifying target sites [67]. Future studies involving other mechanisms may lead to even better reliability of the computational methods with respect to biological evidence.
In the presented work, we used the biological knowledge available on PC. Using the different biological knowledge available, one can extend this approach to the discovering of miRNA target genes for different pathologies.
As larger numbers of validated miRNA targets (true positives) and validated nontargets (true negatives) will become available, methods like the one presented, but developed on a larger scale (more candidate genes, more miRNAs), may lead to even better results. Moreover, it will be possible to develop accurate miRNA target prediction algorithms, using, for example, neural networks or support vector machines [39]. Moreover, it will be possible to perform depth comparisons of target prediction algorithms based on metrics for sensitivity and selectivity.
ACKNOWLEDGMENTS
This work was partially supported by Human Health Foundation, S.H.R.O., and University of Genova. We thank Alessandro Parini for programming support.
REFERENCES
1. R. C. Lee, R. L. Feinbaum, and V. Ambros (1993), The C-Elegans Heterochronic Gene Lin-4 Encodes Small Rnas with Antisense Complementarity to Lin-14, Cell, 75:843–54.
2. G. Ruvkun (2001), Molecular biology. Glimpses of a tiny RNA world, Science, 294:797–139.
3. R. Ciarapica, G. Russo, F. Verginelli, L. Raimondi, A. Donfrancesco, R. Rota, and A. Giordano (2009), Deregulated expression of miR-26a and Ezh2 in Rhabdomyosarcoma, Cell Cycle, 8:172–175.
4. W. J. Lukiw (2007), Micro-RNA speciation in fetal, adult and Alzheimer’s disease hippocampus, Neuroreport, 18:297–300.
5. J. Kim, K. Inoue, J. Ishii, W. B. Vanti, S. V. Voronov, E. Murchison, G. Hannon, and A. Abeliovich (2007), A microRNA Feedback Circuit in Midbrain Dopamine Neurons}, Science, 317:1220–1224.
6. D. Eletto, G. Russo, G. Passiatore, L. Del Valle, A. Giordano, K. Khalili, E. Gualco, and F. Peruzzi (2008), Inhibition of SNAP25 expression by HIV-1 Tat involves the activity of mir-128a, J. Cellular Physiol., 216:764–770.
7. D. E. Goldberg (1989), Genetic Algorithms in Search, Optimization and Machine Learning, Addison-Wesley, Longman Publishing Co., Inc., Boston.
8. YS. Lee, HK. Kim, S. Chung, KS. Kim, and A. Dutta (2005), Depletion of human micro-RNA miR-125b reveals that it is critical for the proliferation of differentiated cells but not for the down-regulation of putative targets during differentiation, J. Biol. Chem., 280:16635–16641.
9. X. Z. Cai, C. H. Hagedorn, and B. R. Cullen (2004), Human microRNAs are processed from capped, polyadenylated transcripts that can also function as mRNAs, RNA, 10:1957–1966.
10. A. M. Denli, B. B. Tops, R. H. Plasterk, R. F. Ketting, and G. J. Hannon (2004), Processing of primary microRNAs by the Microprocessor complex, Nature (London), 432:231–35.
11. A. Esquela-Kerscher and F. J. Slack (2006), Oncomirs - microRNAs with a role in cancer, Nat. Rev. Cancer., 6:259–69.
12. N. Yanaihara, et al. (2006), Unique microRNA molecular profiles in lung cancer diagnosis and prognosis, Cancer Cell, 9:189–198.
13. S. Ambs, R. L. Prueitt, M. Yi, R. S. Hudson, T. M. Howe, F. Petrocca, T. A. Wallace, C.-G. Liu, S. Volinia, G. A. Calin, H. G. Yfantis, R. M. Stephens, and C. M. Croce (2008), Genomic Profiling of microRNA and Messenger RNA Reveals Deregulated microRNA Expression in Prostate Cancer}, Cancer Res, 68:6162–6170.
14. D. Bonci, V. Coppola, M. Musumeci, A. Addario, L. D’Urso, D. Collura, C. Peschle, R. De Maria, and G. Muto (2008), The miR-15a/miR-16-1 cluster controls prostate cancer progression by targeting multiple oncogenic activities, Eur. Urol. Suppl., 7:271.
15. T. Bagnyukova, I. Pogribny, and V. Chekhun (2006), MicroRNAs in normal and cancer cells: a new class of gene expression regulators, Exp. Oncol., 28:263–269.
16. M. V. Iorio et al. (2005), MicroRNA gene expression deregulation in human breast cancer, Cancer Res., 65:7065–7070.
17. Y. Karube (2005), Reduced expression of Dicer associated with poor prognosis in lung cancer patients, Cancer Sci., 96:111–115.
18. M. Z. Michael, S. M. O’Connor, N. G. van Holst Pellekaan, G. P. Young, and R. J. James (2002), Reduced accumulation of specific microRNAs in colorectal neoplasia, Mol. Cancer Res., 1:882–891.
19. G. A. Calin et al. (2002), Frequent deletions and down-regulation of micro-RNA genes miR15 and miR16 at 13q14 in chronic lymphocytic leukemia, Proc. Natl. Acad. Sci. USA, 99:15524–15529.
20. Y. Xi, J. R. Edwards, and J. Jul (2007), Investigation of miRNA Biology by Bioinformatic Tools and Impact of miRNAs in Colorectal Cancer: Regulatory Relationship of c-Myc and p53 with miRNAs, Cancer Inform., 3:245–253.
21. M.L. Gonzalgo and W.B. Isaacs (2003), Molecular pathways to prostate cancer, MJ Urol., 170:2444–2452.
22. A. Jemal, et al. (2003), Cancer statistics, CA Cancer J. Clin., 53:5–26.
23. J. Jiang, E. J. Lee, Y. Gusev, and T. D. Schmittgen (2005), Real-time expression profiling of microRNA precursors in human cancer cell lines, Nucleic Acids Res., 33:5394–5403.
24. AR. Kore, M. Hodeib, and Z. Hu (2008), Chemical Synthesis of LNA-mCTP and its application for MicroRNA detection, Nucleosides Nucleotides Nucleic Acids, 27:1–7.
25. K. S. Lee and Z. W. Geem (2005), A new meta-heuristic algorithm for continuous engineering optimization: harmony search theory and practice, Computer Methods Appl. Mech. Eng., 194:3902–3933.
26. S. L. Lin, A. Chiang, D. Chang, and S. Y. Ying (2008), Loss of mir-146a function in hormone-refractory prostate cancer, RNA, 14:417–424.
27. A. Musiyenko, V. Bitko, and S. Barik (2008), Ectopic expression of miR-126*, an intronic product of the vascular endothelial EGF-like 7 gene, regulates prostein translation and invasiveness of prostate cancer LNCaP cells. J. Mol. Med., 86:313–322.
28. Y. Sylvestre et al. (2007), An E2F/miR-20avautoregulatory feedback loop, J. Biol. Chem., 282:2135–2143.
29. E. Berezikov, V. Guryev, J. van de Belt, E. Wienholds, RHA. Plasterk, and E. Cuppen (2005), Phylogenetic shadowing and computational identification of human microRNA genes, Cell, 120:21–24.
30. I. Bentwich, A. Avniel, Y. Karov, R. Aharonov, S. Gilad, O. Barad, A. Barzilai, P. Einat, U. Einav, E. Meiri, E. Sharon, Y. Spector, Z. Bentwich (2005), Identification of hundreds of conserved and nonconserved human microRNAs, Natl. Genet., 37:766–70.
31. S. Griffiths-Jones (2006), miRBase: the microRNA sequence database, Methods Mol. Biol. 342:129–138.
32. B. J. Reinhart et al. (2000), The 21-nucleotide let-7 RNA regulates developmental timing in Caenorhabditis elegans, Nature (London), 403:901–906.
33. X. J. Wang, J. L. Reyes, N. H. Chua, and T. Gaasterland (2004), Prediction and identification of Arabidopsis thaliana microRNAs and their mRNA targets, Genome Biol., 5:R65.
34. S. Davis, B. Lollo, S. Freier, and C. Esau (2006), Improved targeting of miRNA with antisense oligonucleotides, Nucleic Acids Res., 34:2294–304.
35. P. W. Hsu et al. (2006), miRNAMap: genomic maps of microRNA genes and their target genes in mammalian genomes, Nucleic Acids Res., 34:D135–9.
36. P. Shahi et al. (2006), Argonaute: A database for gene regulation by mammalian microRNAs, Nucleic Acids Res., 34:D115–118.
37. M. Megraw, P. Sethupathy, B. Corda, and A. G. Hatzigeorgiou (2007), miRGen: a database for the study of animal microRNA genomic organization and function, Nucleic Acids Res., 35:D149–155.
38. P. Sethupathy, B. Corda, and A. G. Hatzigeorgiou (2006), TarBase: A comprehensive database of experimentally supported animal microRNA targets, RNA, 12:192–197.
39. S. Haykin (2008), Neural networks and learning machines, 3rd ed., Prentice-Hall, NY.
40. B. John, A. J. Enright, A. Aravin, T. Tuschl, C. Sander, and D. S. Marks (2004), Human MicroRNA targets, Plos Biol., 2:1862–1879. Targets, Cell, 115:787–798.
41. B. John, A. J. Enright, A. Aravin, T. Tuschl, C. Sander, and D. S. Marks (2004), Human MicroRNA targets, Plos Biol., 2:1862–1879.
42. J. Brennecke, A. Stark, R. B. Russell, and S. M. Cohen (2005), Principles of MicroRNA-target recognition, Plos. Biol., 3:404–418.
43. J. G. Doench and P. A. Sharp (2004), Specificity of microRNA target selection in translational repression, Genes Dev., 18:504–11.
44. M. Kiriakidou, P. T. Nelson, A. Kouranov, P. Fitziev, C. Bouyioukos, Z. Mourelatos, and A. Hatzigeorgiou (2004), A combined computational-experimental approach predicts human microRNA targets, Genes Dev., 18:1165–1178.
45. D. Grun, YL. Wang, D. Langenberger, KC. Gunsalus, and N. Rajewsky (2005), microRNA target predictions across seven Drosophila species and comparison to mammalian targets, Plos. Comput. Biol., 1:e13.
46. B. John, C. Sander, and D. S. Marks (2006), Prediction of human microRNA targets, Methods Mol. Biol., 342:101–113.
47. B. P. Lewis, C. B. Burge, and D. P. Bartel (2005), Conserved seed pairing, often flanked by adenosines, indicates that thousands of human genes are microRNA targets, Cell, 120:15–20.
48. P. Sethupathy, M. Megraw, and A. G. Hatzigeorgiou (2006), A guide through present computational approaches for the identification of mammalian microRNA targets, Nat. Methods, 3:881–886.
49. A. J. Enright, B. John, U. Gaul, T. Tuschl, C. Sander, and D. S. Marks (2003), microRNA targets in Drosophila, Genome Biol., 5.
50. S.-K. Kim, J.-W. Nam, J.-K. Rhee, W.-J. Lee, and B.-T. Zhang (2006), miTarget: microRNA target-gene prediction using a Support Vector Machine, BMC Bioinformatics, 7:411.
51. A. Krek, D. Grün, M. N. Poy, R. Wolf, L. Rosenberg, E. J. Epstein, P. Macmenamin, I. d. da Piedade, K. C. Gunsalus, M. Stoffel, and N. Rajewsky (2005), Combinatorial microRNA target predictions, Nature Genet., 37:495–500.
52. M. Kertesz, N. Iovino, U. Unnerstall, U. Gaul, and E. Segal (2007), The role of site accessibility in microRNA target recognition, Nat. Genet., 39:1278–1284.
53. K. C. Miranda, T. Huynh, Y. Tay, Y.-S. Ang, W.-L. Tam, A. M. Thomson, B. Lim, and I. Rigoutsos (2006), A Pattern-Based Method for the Identification of microRNA Binding Sites and Their Corresponding Heteroduplexes, Cell, 126:1203–1217.
54. M. Rehmsmeier, P. Steffen, M. Hochsmann, and R. Giegerich (2004), Fast and effective prediction of microRNA/target duplexes, RNA, 10:1507–1517.
55. R. Thadani and MT. Tammi (2006), MicroTar: predicting microRNA targets from RNA duplexes, BMC Bioinformatics, 7:S20.
56. T. F. Smith and M. S. Waterman (1981), Identification of common molecular subsequences, J. Mol. Biol., 147:195–197.
57. S. Wuchty, W. Fontana, I. L. Hofacker, and P. Schuster (1999), Complete suboptimal folding of RNA and the stability of secondary structures, Biopolymers, 49:145–165.
58. J. Felsenstein and G. A. Churchill (1996), A hidden Markov model approach to variation among sites in rate of evolution, Mol. Biol. Evol., 13:93–104.
59. A. Siepel, G. Bejerano, J. S. Pedersen, A. S. Hinrichs, M. Hou, K. Rosenbloom, H. Clawson, J. Spieth, L. W. Hillier, S. Richards, G. M. Weinstock, R. K. Wilson, R. A. Gibbs, W. J. Kent, W. Miller, and D. Haussler (2005), Evolutionarily conserved elements in vertebrate, insect, worm, and yeast genomes, Genome Res., 15:1034–1050.
60. S. H. Bernhart, H. Tafer, U. Mückstein, C. Flamm, P. F. Stadler, and I. L. Hofacker (2006), Partition function and base pairing probabilities of RNA heterodimers, Algorithms for Mol. Biol., 1:3.
61. X. Yan, et al. (2007), Improving the prediction of human microRNA target genes by using ensemble algorithm, FEBS Lett., 17:581:1587–93.
62. Z. Michalewicz (1996), Genetic Algorithms + Data Structures—Evolution Programs, Springer-Verlag, NY.
63. C. D. Kirkpatrick, S. Gelatt, and M. P. Vecchi (1983), Optimization by simulated annealing, Science, 220:671–680.
64. J. Kennedy, R. C. Eberhart, and Y. Shi (2001), Swarm Intelligence, Morgan Kaufmann Publishers, San Francisco.
65. J. Lapointe, C. Li, J. P. Higgins, M. van de Rijn, E. Bair, K. Montgomery, M. Ferrari, L. Egevad, W. Rayford, U. Bergerheim, P. Ekman, A. M. Demarzo, R. Tibshirani, D. Botstein, P. O. Brown, J. D. Brooks, and J. R. Pollack (2004), Gene expression profiling identifies clinically relevant subtypes of prostate cancer, Proc. Nat. Acad. Sci., 101:811–816.
66. E. Goodman (1996), Galopps, the genetic algorithm optimized for portability and parallelism system, users guide, Genetic Algorithms Research and Applications Group (GARAGe), Michigan State University, Tech. Rep.
67. M. Hammell, D. Long, L. Zhang, A. Lee, C. S. S. Carmack, M. Han, Y. Ding, and V. Ambros (2008), mirwip: microRNA target prediction based on microRNA-containing ribonucleoprotein-enriched transcripts, Nature Methods.