
5
Data Mining Tools and Techniques: Clustering Analysis
Rohit Miri1, Amit Kumar Dewangan2*, S.R. Tandan1, Priya Bhatnagar3 and Hiral Raja4
1Department of CSE, Dr. C.V. Raman University Bilaspur, Chhattisgarh, India
2IT Department, G.G.V. (Central University) Bilaspur, Chhattisgarh, India
3Department of CSE, VNR VJIET, Hyderabad, India
4CMR Engineering College, Hyderabad, India
Abstract
The whole research focuses on a range of techniques, challenges, and different areas of investigation that are useful and identified as an important field of data mining technology. Even though we know, many MNCs and huge organisations are working in better places in different countries. Each place of action can generate huge amounts of data. Corporate executives grant access from every solitary source and make vital choices. The Information Distribution Center is often used in an enormous business sense by enhancing the viability of the administrative dynamic. In an uncertain and deeply serious development business, the approximation of important data frameworks, for example, is nevertheless successfully viewed in the existing business situation. Efficiency or frequency is not the key to intensity. This kind of tremendous amount of information is available as a tera-to-petabyte that has completely changed in the scientific fields and specification. To analyze, monitor, and resolve the selection of this massive quantity of information, we require methodology based Data Mining, that will change in a lot of areas. The whole paper also observes focusing on the current characterization and data recovery strategies to use a computation that will acquire a lot of reports. Accordingly, the unfurling of information in writings is chosen as the best possible philosophy to be followed, and the means are disclosed to arrive at the order of the solo report. In the wake of leading a trial with three of the most known strategies for unaided records arrangement and the evaluation of the outcomes with the Silhouette list, it could be seen that the better gathering was with four gatherings whose principle trademark was to manage subjects, for example, data the executive’s data, frameworks the board, man-made reasoning, and advanced picture preparing.
Keywords: Data mining tasks, data mining application, document clustering, data mining life cycle, data mining methods
5.1 Introduction
With its simplest design, Data Mining mechanizes the recognition of prominent features in the data source, using characterized methods and computations to researches have been proposed and severe data that could then be analyzed to predict future trends. Just like data mining tools recognize potential practices and knowledge by browsing data sets for hidden case studies, they allow organizations to make comprehensive, information-driven decisions and response identify that were previously too cumbersome to identify.
Data Mining has a lengthy tradition, with strong roots in quantification, human-made justification, AI, and the development of the existing data. Data Mining is a step in the public disclosure from the knowledge Base (KDD) measure that involves the use of data collection and audit computations to create a particular verification of illustrations (or models) over relevant data.
Data Mining is a way of eliminating data from alternative views and summarizing it in useful data that can be used to generate revenue, reduce costs, or both. Data Mining computing is one of the relevant forensic systems for the interpretation of information. It enables consumers to analyze data from a wide variety of observations or edges, requests it, and summarizes the distinctive contacts. Data Mining is a place to explore links or examples between so many areas in the huge social baseline performance. Data Mining originally comes from the resemblance between searching for relevant information in an immense set of data and searching a cliff for an important metal vein. The two phases permit, be it sorting through such a vicious measure of the substance or smartly investigating it, to find out where the value resides.
Data Mining, or disclosure of data, is the CP that assisted the process of digging through and collapsing large reverse structures and then trying to separate the significant data. The concepts of KDD and Data Mining are exceptional. KDD relates to the “cycle of discovering useful information from information.” Data Mining refers to finding new examples of the explosion of data in the baseline performance by tuning on the computations to differentiate valuable information.
The KDD measure consists of adaptive achieve sustainability as described in the following:
- Selection: choosing the relevant data for the evaluation assignment from the existing data;
- Pre-processing: removal of concussion and inaccurate statements; consolidation of extraction of knowledge;
- Transformation: converting data into appropriate data mining systems;
- Data Mining: selecting a Data Mining computation that is appropriate for the layout of the data;
- Translation/Evaluation: analyzing descriptions into data by removing extra or meaningless instances; trying to interpret the strongest overall inhumanly acceptable terms.
Data Mining is indeed an ability to share an apparatus that incorporates structures for the data source, AI, evaluation, recognition of data analytics, and other orders. Data Mining modified retrospective approach is a non-partisan section of the organization that promotes description, forecasting, and targeting. Data Mining can often help in forecasting future opportunities. Data Mining could even make use of essential recorded data and provides vital information.
Steps for Mining the Data:
With ventures, multidimensional geographic areas, multi-information base digging is getting significant for successful and educated dynamics. The accompanying Data Mining strategies will assist you in improving your mining:
Stage 1: Handling of unstructured information
Unstructured information influences exactness and successful Data Mining. The accompanying strategies are viable for working with such sort of information.
- The ISOM-DH method is beneficial in identifying relevant details and imagining that it took good care of high-dimensional data through the use of an available section investigative process (ICA) and self-assessment guides (SOMs). A further structure relies on the structures gathered using parametric and nonparametric ascription methods or evolutionary computations to construct a design.
- Organization approaches dependent on performing multiple task learning utilized for design grouping, with missing sources of info, can be contrasted and agent methodology utilized for taking care of inadequate information on two notable informational indexes.
Stage 2: Provide successful Data Mining Algorithm
Expertise is required for the utilization, execution, support, and execution of compelling Data Mining applications. These strategies may help:
- Implementation of Data Mining designs.
- The network authorizes Data Mining requests through not at all intercession arranged the submission adjacent.
- Decide on versatile Data Mining.
- Eliminate hindrances.
Stage 3: Mining of enormous Databases
Use join set structural with information base frameworks. Such Data Mining strategies could include:
- An embodiment of the Data Mining calculation.
- Reserving the information, at that point, mining.
- Tight-coupling with client characterized capacities.
- SQL executions for DBMS.
Stage 4: Handling of Data types
It’s hard to build up a framework for intelligent mining of different levels of information in enormous data sets and information distribution centers. This requires the tight coupling of systematic online preparing with a wide range of Data Mining capacities, including characterization, affiliation, order, forecast, and grouping. The framework ought to encourage question-based, intelligent mining of multidimensional information bases by actualizing a lot of advances Data Mining incorporates:
- Multidimensional investigation
- Data Mining refined information
- Meta-mining, and information and information perception
- Assessing Data Mining results
- Analyzing chart information bases
- sub-chart histogram portrayal.
Stage 5: Handling Heterogeneous condition
Heterogeneous data set frameworks are mainstream ones in the data industry in 2011. Information stockrooms must help information extraction from numerous data sets to stay aware of the pattern.
5.2 Data Mining Task
5.2.1 Data Summarization
Summarization is the speculation or reflection of information. A lot of significant information is disconnected and summed up, coming about a little set that gives an overall diagram of information. For instance, the significant distance calls of the client can be summed up to add up to minutes, absolute calls, complete spending, and so forth rather than itemized calls. Correspondingly the calls can be summed up into neighborhood calls, STD calls, ISD calls, and so forth.
5.2.2 Data Clustering
Bunching is distinguishing comparable gatherings from unstructured information. Bunching is the order of gathering of several articles in just such a way that objects in the very same selection are almost like one another and then that in various gatherings. When the groups are chosen, the articles are named their comparative bunches, and the normal highlights of the items in the bunch are summed up to form a class portrait. For example, a bank can connect its customer to several meetings that rely heavily on the similarity of their income, age, sex, home, and so on, as well as the request features of customers in a meeting could be used to depict that collection of customers. This will make it easier for the bank to understand its customers and therefore provide modified offices.
5.2.3 Classification of Data
The portrayal is learning decisions that can only be exposed to specific data and therefore will ordinarily be incorporated after developments: pre-preparing data, scheduling, training/highlighting, and authorization/evaluation. Request anticipates all of its consistently valued capabilities. For example, we can use a grouping model to order a bank credit application as either sheltered or unsafe. The arrangement is the induction of a framework that takes the class of a product that is completely reliant on its composes. A considerable amount of articles is given as a set of preparations whereby each product is referred to and along with its team by a vector of attributes. Besides attempting to break down the link between the features and the class of the items in the preparation set, a grouping model can be developed. That very clustering method can be used to organize future posts and to construct a greater knowledge of the courses of products in the existing data. For example, from either the configuration of progress issuers (Name, Age, and Income) who bring in as set-up, a request model can be built that decides to close the bank loan application either as sheltered or hazardous (On the off chance that age = Youth, at that point Loan choice = hazardous).
5.2.4 Data Regression
Relapse is discovering capacity with an insignificant blunder to display information. It is a factual system that is frequently utilized for the numeric forecast. The relapse investigation is widely used for expectations and guidance, whereby the user does have a significant impact mostly on the AI field. The relapse test has also been used to understand if any of the independent variables are recognized with both the parameter needed and to evaluate the forms of such connexions. Throughout specific circumstances, the relapse investigation may be used to establish causal relationships between both the available and ward aspects. Even so, it might lead to desires or false connexions, so advise smartly [1], for instance, the relationship doesn’t suggest causation.
5.2.5 Data Association
Affiliation is searching for a connection between factors or items. It plans to remove intriguing affiliation, relationships, or easy-going structures among the articles, for example, the presence of another arrangement of articles [2]. The affiliation rules can help promote where the board, publicizing, and so forth. Affiliation rule learning is a central feature and an all-around researched methodology for discovering fascinating connexions among variables with specific regard to exceptionally enormous units. This is designed to recognize strong rules discovered in baseline performance utilizing different quantities of benefit [3] and reliant on the concept of sound specifications presented in [4], the association regulations for discovering values and attitudes among items in the vast scope of information exchange recorded by retail location (POS) frameworks in general stores. For example, the norm {Onions, potatoes} {burger} prevalent in the general store’s business data will indeed show that if the consumer buys onions and potatoes together, the person in question is likely to buy hamburger meat in the same way. That very information may be used as a basis for choosing decisions about undertakings, e.g., time-limited evaluation or product accommodations. Despite the apparent above-mentioned model of market container investigatory affiliation rules are currently applied in several implementation areas, which include internet use mining, interference recognition, constant generation, and computational biology.
5.3 Data Mining Algorithms and Methodologies
Various calculations and methodologies, such as Classification, Artificial Intelligence, Genetic Algorithms, Neural Networks, Nearest Neighbour Strategy, Association, Rules Clustering, Regression, Decision Trees, and so on, are used for disclosing information from baseline performance.
5.3.1 Data Classification Algorithm
The framework is perhaps the most frequently used Data Mining method, which uses a large set of pre-characterized tutorials to develop a classifier that can set the number of individuals in broken archives. Recognition of fraud and credit-hazard technologies are particularly suitable for the type of investigative process. This method of analysis often uses selected tree or cognitive organization-based character development computations. Measures for the informational collection involve learning and clustering. In Learning, the preparedness data are evaluated by analysis measurement. Test information is used to measure the accuracy of the clustering rules. The mostly on-off possibility that the truthfulness is adequate the regulations can be applied to new data vertices. For something like a misappropriation identifying implementation, it would also utilize total data of both false and significant activities finally agreed on a database-by-record assumption. The classifier-preparing calculation uses these pre-grouped guides to determine the boundaries required for legitimate separation. The calculation at that point encodes these limits into a model called a classifier.
5.3.2 Predication
The relapse technique can be adapted for the predictive model. The relapse investigation could be used to show the connexion among at least one independent component and the clinic factor. In Data Mining Free variables, credits are known and the response variables are what we need to predict. Unfortunately, a few of the actual concerns are not always anticipated. For illustration, agreements on volumes, stock costs, and item failure rates are generally difficult to predict on the premises that they can rely on changes that occurred of several indicators. Along those same lines, the most mind-boggling methods (e.g., calculated relapse, choice of trees, or neural networks) may be essential for forecasting future attributes. Actual performance against standards sorts can be used frequently for both relapse and portrayal. For example, the CART (Classification and Regression Trees) tree selection calculation can be used to organize both place trees (to characterize exact reaction factors) and relapse trees (to estimate persistent reaction factors). Neural organizations also can develop both tend-to-group and relapse designs.
5.3.3 Association Rule
Affiliation and connexion is usually the discovery of frequent inventions among the vast amounts of data and information. But that kind of discovery specific problem to decide on deliberate changes, such as inventory installation, cross-showing, and customer shopping. Affiliation Rule computations should have the alternative of establishing rules with the assurance that it is short of what might be. In any case, the number of feasible Association Rules for a set of data is usually immense, and a high degree of guidelines is usually of the little (considering) accomplishment.
5.3.4 Neural Network
The cognitive organization is a huge amount of related input/yield components, and each affiliation has its mass. Mostly during the learning phase, the network can learn by changing loads to be allowed to predict the correct type of information of the knowledge data points. Neural organizations have a tremendous opportunity to acquire significance from jumbled or inaccurate data and can be used to differentiate instances and to recognize patterns that are too troubling to be shown in any manner, either through individuals or by other Computer processes. Those were suitable for prolonged valued information sources and products. For example, translated character reconfigure, for the preparation of a Computer for the articulation of English decision and various real business issues, has just been efficiently implemented in a range of companies. Neural organizations are ideally equipped to recognize instances or trends of data and to meet expectations or implement the strategy.
5.3.4.1 Data Clustering Algorithm
Data Clustering could be said to be an ID of the relative classifications of products. By using clustering methods, we can further differentiate dense and scanty regions in the spatial domain and, therefore, can normally find examples of scattering and connexions between data assigns. Structure methodology can also be used for efficient techniques of recognition of collections or electives of items, but it transforms out to have been extraordinarily high so that clustering can be used as a pre-processing strategy for identification and characterization of subsets. For example, to form the collection of customers completely reliant on the purchase of design elements, to classify quality with similar relevance is represented in Figures 5.1 and 5.2.
Figure 5.1 Shows different data clustering stages.

Figure 5.2 Shows clustering techniques classifications.
5.3.5 In-Depth Study of Gathering Techniques
Even if all is said to have been completed, considerable clustering methodologies could be organized in the functional process.
5.3.6 Data Partitioning Method
Assume there are n objects in the first informational collection; dividing techniques split the first informational index into k allotments.
- Relegate each object to the group related to the nearest centroid;
- Register the new situation of every centroid by the mean estimation of the items in a bunch.
- Rehash steps 2 and 3 until the methods are fixed [5].
A fuzzy clustering categorization measurement receives a lone package of data instead of a particular construct, e.g., a significantly more active provided by a progressive method. Methodologies are of benefit to implementations, including large-scale information compilations in which the advancement of a graph is computational complexity unfeasible [6]. The problem regarding the use of a partial measurement is the choice of the amount of the potential acquisition clumps. The primary research sets out the path for this having promised selection. Partitional methodologies probably contain communities by enhancing the tasks of a regime characterized whether regionally (on a subset of examples) or across the world (characterized over a whole number of instances).
The combined advancement of the design of possible labels for the optimal assessment of a method of measuring is computational complexity restrictive. Technically speaking; therefore, the measurement is normally produced on multiple occasions to different starting regions, and the system model obtained from that series is used as a gathering of returns.
5.3.7 Hierarchical Method
This strategy gives the tree connection among bunches and creates a dendrogram speaking to the settled gathering relationship among objects. On the off chance that the bunching chain of importance is shaped from the base up, toward the beginning, every information object is a group without anyone else, at that point, little bunches are converged into greater bunches at each degree of the progressive system. This kind of progressive technique is called agglomerative. The contrary cycle is called disruptive [7].
The entity measurement of this kind is systematic bundling, which would be modified into the well-known mathematical computing of MATLAB [8]. This measurement is a fuzzy clustering measurement that has several variations that depend on the measurement used only to calculate the separations between the clusters. Euclidean separation is typically used as a special emphasis. There are still no known methods to be used for community splitting, and the database seems to be unmistakably assisted. One of the most commonly used variants of liberal bundling, depending on the various surface steps, is [9] shown in Figure 5.3:
- Normal linkage bunching:
The uniqueness between bunches is determined by utilizing normal values. The normal separation is determined from the separation between each point in a group and all different focuses in another group. The two groups with the most reduced normal separation are consolidated to frame the new bunch. - Centroid linkage grouping:
This variety utilizes the gathering centroid as the normal. The centroid is characterized as the focal point of a haze of focuses. - Complete linkage bunching (Maximum or Furthest-Neighbor Method):
The difference between two gatherings is equivalent to the best divergence between an individual from group I and an individual from group j. This technique will in general, deliver tight groups of comparable cases.
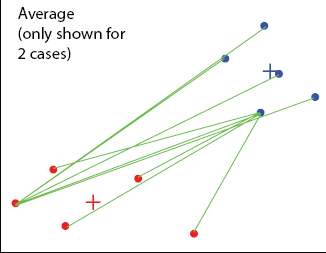
Figure 5.3 Shows centroid linkage clustering.
- Single linkage grouping (Minimum or Nearest-Neighbor Method):
The divergence between two bunches is the base uniqueness between individuals from the two bunches. This technique creates long chains that structure-free, irregular groups. - The Stake technique:
Cluster membership is distributed by testing the actual totality of standard different from the mass average. The justification for the configuration is that the smallest feasible increase in the accumulated error of the distributions will be given.
5.3.8 Framework-Based Method
This procedure gauges the item space into a limited number of cells that structure a lattice structure on which the entirety of the tasks for bunching is performed [10]. It depends on bunching-focused question replying in staggered network structures. In upper-level stores, examination of the data of it’s after that level, accordingly, the networks make cells between the associated levels.
5.3.9 Model-Based Method
Model-put together bunching procedure is based concerning the best conjecture that information is produced by a mix of hidden likelihood disseminations, and they enhance the fit among the information and some numerical model.
5.3.10 Thickness-Based Method
The thickness-based strategies follow the growing of the bunch until a thickness limit is reached [11]. For these techniques, an “area” must be characterized, and the thickness must be determined by the number of substances in the area.
5.4 Clustering the Nearest Neighbor
As proximity comprises a vital aspect of the impulsive thinking of a lot, the nearest - neighbor variations will serve as the basis of a sorting technique. An experimental procedure has been suggested in Lu and Fu 1978; it assigns every unmarked instance to a lot of its closest-marked neighbor nature, provided that the distinction of the identified neighbor is below a limit. The process begins till all samples are called or no additional marks are made. Popular neighborhood affection (portrayed above concerning the removal of measurement) could also be used to establish close-neighbor communities.
5.4.1 Fuzzy Clustering
Customary grouping methodologies create allotments; in a segment, the respective example has a place with on and just one bunch. Consequently, the groups in hard bunching are disjoint. Fuzzy grouping stretches out this thought to relate each pattern [12] with each bunch utilizing a participation work. The performance of such measurements is a collection but not a package shown in Figure 5.4.
5.4.2 K-Algorithm Means
The K-means measurement, probably the first one of the suggested sorting measurements, focuses on a simple idea: given the majority of explanatory bundles, assign one of them to every one of the highlights, at a certain stage, each category position is replaced by the basis on the bundle [13]. Such two important developments have been reshaped until around the association. A value is assigned to the category that is similar to the Euclidean separation. Even though K-means does have an extraordinary chance to impress of being anything other than hard to prove, there are two major setbacks [14]. To begin with, it can be quite complicated because, for each development, the distinction between both the highlights within each group needs to be calculated but can be rather costly in the view of an immense database. Second, this approach is genuinely applicable to the developmental classes, even though, lately, this topic has appeared to have some level of performance.
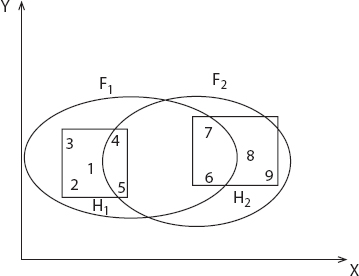
Figure 5.4 Show fuzzy clustering.
5.5 Data Mining Applications
Different fields utilize Data Mining innovations in light of quick access to information and important data from the tremendous measure of information. Data Mining innovations have been applied effectively in numerous regions like advertising, media transmission, misrepresentation recognition, and account, clinical, etc. A portion of the application is recorded underneath.
Budgetary Data Analysis: The fiscal knowledge in the banking and related financial industries is generally sound and outstanding, which promotes the methodological analysis of information and Data Mining. Here are a few frequent cases: the design and development of knowledge management centers for the multifaceted analysis of data processing and Data Mining: advance payment requirements and assessment of the client’s credit policy. Request an assortment of customers to concentrate on exhibiting—detection of fraudulent tax evasion and other money linked to corruption.
Retail Industry: Data Mining seems to have an outstanding scope in the retailing business as it collects large quantities of knowledge on sales, consumer purchasing background, transport products, usage, and management. It is common to practice that the amount of information collected will continue to increase exponentially due to the increased convenience, availability, and popularity of the web. Data Mining in the retail sector helps to understand consumer buying habits and trends. This leads to an increased essence of customer service and good service and fulfillment of the customer. And here’s a list of the data mining cases in the retail sector:
- Design and development of knowledge delivery centers that draw on the benefits of Data Mining. Multidimensional analysis of transactions, customers, objects, duration, and region.
- Analysis of adequacy of deals crusades.
- Customer Retention.
- Product proposal and cross-referring to of things.
Media transmission: Technology sector nowadays, the telecommunications industry is amongst the most evolved businesses providing help and assistance, e.g., fax, pager, wireless, Internet courier, images, e-mail, site details, and so on. The broadcast communications industry is rising rapidly as a result of the development of new PCs and correspondence technologies. This would be the inspiration for how and why Data Mining has become important to support and understand the process. Data Mining in the telecommunications industry helps to differentiate broadcast communications models, get inaccurate experiments, to use properties, and to enhance the administrations. Here are the frameworks in which Data Mining increases media communications advantages and also
- Multidimensional Analysis of Telecommunication information.
- Fraudulent example examination.
- Identification of unordinary designs.
- Multidimensional affiliation and successive examples of investigation.
- Mobile Telecommunication administrations.
- Use of perception apparatuses in media transmission information investigation.
Natural Data Analysis: These days, we expect major developments in the field of science, such as genomics, proteomics, functional bioinformatics, and medical research. Natural Data Mining is an integral aspect of genomics. Below are the contexts in which the mining of data contributes to the review of organic data:
- A functional mixture of interconnected, distributed functional genomics sets of data.
- Multiple nucleotide successions have been associated, organized, scanned for correlation, and related investigations.
- Exploration of supplementary descriptions and examination of inherited organizations and protein processes.
Certain Scientific Technologies: The above-mentioned applications would generally deal with relatively limited and culturally diverse informative databases in which the empirical approaches are sufficient. Immense measurements of knowledge are being obtained from logical fields such as geoscience, space science, and so forth. There is indeed a tremendous amount of informative samples created due to rapid computational recreations in various fields, e.g., atmospheric and environmental show, material construction, fluid components, and so on. The followed are the use of Data Mining in the process of science technologies.
5.6 Materials and Strategies for Document Clustering
Collecting and Pre-processing Texts: This is the initial step of the cycle and comprises of removing the plain data that shows up in a lot of reports that have been recently gathered [15]. Since all the proposals from the staff are in PDF design, it was important to discover a component to snatch text from these records. To remove text from PDF records, a specialist library called PDFBox was utilized [16]. This library offers a wide scope of pre-processing assignments, for example, text extraction, blending different reports into a solitary one, changing over plain content into a PDF record, making PDF records from pictures, printing archives, and others. From every one of these highlights, it was chosen to work with the extraction of text from a PDF document to plain content, where it will be simpler to manage. Notwithstanding this library, it was utilized another library called FontBox contains different kinds of text styles to make the PDFBox library text styles viable with the most ordinarily known typefaces.
Lexical examination: Once the content from the reports has been gotten, the main tasks to be pre-framed on the content comprise sectioning enormous chains into comparing words. This cycle is known as the partition of lexical segments [17]. These tokens (which are only the words contained in the content) are acquired utilizing the clear space characters for dividing the entire content into autonomous words.
Filtering and eliminating stop-words: A subsequent advance is to channel all non-in order characters, for example, numbers and accentuation marks, since they don’t give pertinent data to the arrangement. At that point, all the content is revised in lowercase, this will be valuable to recognize a similar word, notwithstanding it is capitalized or lowercase, be related to a similar word. A short time later, another separating is performed to kill those words that don’t include pertinent data, for example, pronouns, articles, and conjunctions. These words are known as stop-words [18]. A rundown of Spanish and English stop-words was taken structure to dispense with those words from the pursuit.
Standardization: stemming: When the prevent words are taken out from the content, the lexemes of the rest of the words are looked for to eliminate those words got from a similar stem. Words that share a similar lexeme are treated as though they were a similar word, and this is particularly valuable for words that have a diverse number and sexual orientation since they share a similar significance [19].
To discover the lexemes from each word, Java-based programming was utilized. This product is Snowball [20] which is utilized in a few regions of data recovery and supports numerous dialects, including Spanish and English. A case of its capacities shows up in Table 5.1.
An immediate outcome of the utilization of the product is that it permits us to keep sifting the content since every one of those words and their varieties that fundamentally mean the equivalent are stifled. This influences things, modifiers, action words, and intensifiers, yet not conjunctions and relational words since they were recently separated as stop-words.
Notice that the words having a similar lexeme are considered as a similar word. Else, it would be harder to track down connections among records since words contrasting in only one letter would be viewed as various words. This would make it hard to achieve if we think about the variations of an equivalent action word in various forms.
Unique word list: To recognize the arrangement of archives, it must be made an in the order arranged word list having the words from all records, the main prerequisite is that a similar word ought not to be rehashed. To eliminate rehashed words, a sequentially arranged word rundown will think about rehashed words, and in this manner, they will be taken out from the rundown of words. To make a one of a kind word list, the technique utilized is to produce a rundown for each archive with halfway single words, that is, the place there are neither rehashed words or at least two words with a similar lexeme or stop-words-later, the word list is sequentially orchestrated. In Table 5.2, we convert words into their root word (which is known as stem word).
Table 5.1 The transformation from word to lexeme.
| Words | Lexemes |
| Run | runs |
| Take | taken |
Table 5.2 Transformation to an extraordinary word list.
| Words | Stem |
| runs | run |
| running | |
| taken | take |
| take |
In the wake of doing this with every one of the reports, a novel worldwide word list is drawn up for all records utilizing the recently produced records from incomplete words in each archive. By making an individual cycle for each record, it is quicker to make a rundown of special words because, in this cycle, there have been many sifted words that give a great deal of additional preparation.
5.6.1 Features Generation
Toward the finish of the last segment, a premise of a vector space was gotten to speak to every one of the records. It is sufficient to consider the occasions a word shows up in a given report framing a vector with an equivalent length to the entire word list. This idea is frequently called the term recurrence (tf). Table 5.3 shows the portrayal of a printed corpus in the vector space [20], where the recurrence of a term t in an archived is the total of the occasions it shows up in the report.
Notwithstanding, not all words are similarly applicable to victimize among the records since there are words that are normal to all reports and, in this way, don’t serve to recognize an archive from others.
Because the past vector portrayal for each archive is adjusted, so those words that don’t serve to recognize reports are not considered. For that it is applied the TF-IDF (Term Frequency-Inverse Document Frequency) is characterized in the accompanying equation:
Table 5.3 Vector portrayal of a report corpus.
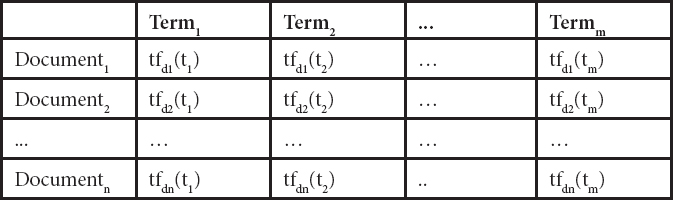

Where N is the, all outnumber of archives in the corpus, and df (report recurrence) the quantity of records from the whole corpus wherein that word shows up. Consequently, we see that if a word shows up in all reports (for example, Sp. “tener”), after this change, its incentive in the table is invalid. The word consider was performed utilizing a reference to the remarkable word list that had been recently created. A sequentially masterminded word list serves to investigate each archive and locate the occasions each word is rehashed in the content.
Toward the finish of this content, preparing a framework with an exceptional number related with a comparing related number will be utilized for additional investigation and order. This network is called the word-reports framework and signified by the letter. M, it has exceptionally huge information and depends on the arrangement of records.
5.7 Discussion and Results
In this part, the qualities of the arrangement of records on which the experimentation is completed are nitty-gritty. The trial convention is clarified, portraying the calculations used to play out the grouping of the archives. At that point is characterized by the assessment metric to break down the aftereffects of the experimentation.
The Portrayal of the Corpus of Documents
The FCI (Faculty of Computer Science) has a continually expanding store of theories in advanced configuration. It has archives dating from the graduation of CSE, class of 2006. These archives are in PDF design, so it was looked to manage this arrangement.
PDF (Portable Document Format) is a record stockpiling design created by Adobe Systems. It is exceptionally intended for archives that can be printed. This configuration is multi-stage since it very well may be seen in all major working frameworks (Windows, UnixLinux, or Mac) without changing either the appearance of the structure of the first archive. It likewise fills in as the norm (ISO 19005-1: 2005) for electronic records containing reports planned to be safeguarded for a long haul.
Since the scholastic year 2010–2011 to 2018–2019, Computer Engineering at the FCI UNICA has put away more than 235 theories, 209 are confirmation papers, and 25 bosses’ postulations (see Table 5.4).
Table 5.4 The portrayal of the corpus utilized in this examination.
| Researcher year | Thesis of engineering | Thesis of masters | Total |
| 2010–11 | 05 | 00 | 05 |
| 2011–12 | 06 | 00 | 06 |
| 2012–13 | 07 | 05 | 12 |
| 2013–14 | 16 | 01 | 17 |
| 2014–15 | 18 | 16 | 34 |
| 2015–16 | 29 | 18 | 47 |
| 2016–17 | 47 | 19 | 66 |
| 2017–18 | 63 | 20 | 83 |
| 2018–19 | 18 | 17 | 35 |
| Total | 209 | 96 | 305 |
Protocols of Experiment:
To locate the ideal approach to gather report recognition papers, a correlation is performed among the various calculations for gathering archives k-means, SOM, and Hierarchical Agglomerative in its variations Single-Link, Complete-Link, and Centroid.
The fundamental impediment of these calculations is that they need to set the underlying number of gatherings. In many applications, and in this specific case, there are no rules to effectively indicate this worth. This is because the Corpus of Diploma Papers of Computer Engineering at UNICA isn’t named in gatherings.
To take care of the issue of accidental the quantity of gatherings to get, a fundamental boundary to apply grouping calculations. These calculations were run in a scope of 2 to a fourth of the number of documents to be clustered ![]() that is, a sum of
that is, a sum of ![]() run was made for every calculation.
run was made for every calculation.
Afterward, to decide the best gathering technique, it was essential to investigate the outcomes with a list of interior approval. As per a few creators a standout amongst other performing lists in such a manner is the Silhouette list.
The Silhouette record is a pointer of the ideal number of gatherings. A higher estimation of this list demonstrates a more attractive number of gatherings. The outline coefficient for a set is given as the normal coefficient of each item outline test, s(i). this list can be utilized for both: a gathering of items (bunch) or for each article. The outline coefficient for an item x is:
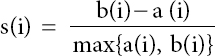
Where an (i) is the normal good ways from the item, I to all different articles in their gathering, and b(i) is the normal good ways from the article I to all different articles in the closest gathering. The estimation of s(i) can be acquired by joining the estimations of a(i) and b(i) as demonstrated as follows:

As indicated by the estimation of the Silhouette outline gatherings (structures) discovered they can be arranged into:
- – 0.71–1.0, the structures are strong.
- – 0.51–0.70, the structures are sensible.
- – 0.26–0.50, the structures are feeble and will, in general, be fake interchange techniques ought to for information examination.
- – <0.25, no structures are found.
An estimation of s(x) close to zero demonstrates that article x is on the fringe of two gatherings. If the estimation of s(x) is negative, at that point, the item ought to be appointed to the closest gathering. This can be seen in Figure 5.5 with values framing outlines B, C, and D bunching with the arrangement of purposes of (A).
As it very well may be seen, outline esteems are featured in the realistic with shading esteems for various gatherings. A normally utilized rule for a superior gathering is the normal estimation of the layout of all articles in all gatherings.

Figure 5.5 Shows silhouette’s graphical representation of clusters. (a) Represents the discrete points, (b) Represents the two clusters, (c) Represents the three clusters and (d) Represents the four clusters.
For this situation, the more noteworthy Silhouette worth will be picked as the best gathering.
5.7.1 Discussion
To accumulate records in connection with their substance, the K-means, SOM, and various leveled Agglomerative calculations are applied in blends SingleLink, Complete-Link, and Centroid on the information network attributes got from the Corpus of Diploma Papers. The information boundaries utilizing these calculations are the arrangement of information that is needed for gathering. At the yield of every calculation, a vector containing the names is acquired with the gathering it has a place with every one of the archives, as it tends to be found in Figure 5.6.
The all outnumber of reports in the Corpus is 305. It was important to complete 76 runs for every calculation for a scope of the number of gatherings of 2 to 77. Table 5.5 shows the ten best estimations of Silhouette for every calculation and the number of gatherings acquired for each situation.
As it tends to be found in the table, the K-implies calculation was the most noteworthy estimation of the outline acquired (0.7680) shaping four gatherings. It was trailed by the progressive agglomerative Centroid-Link calculation which likewise got four gatherings however with a normal estimation of outline a little lower (0.7279). thirdly, the various leveled agglomerative Single-Link calculation plays out a gathering of four gatherings yet additionally with a normal outline (0.7089).
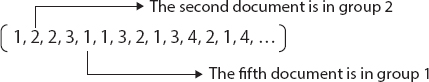
Figure 5.6 Shows Output vectors of Algorithm.
Table 5.5 Groups with various Silhouette an incentive for every calculation.
| K-Means | SOM | Single | Complete | Centroid | |||||
| Index | Groups | Index | Groups | Index | Groups | Index | Groups | Index | Groups |
| .7680 | 04 | .7115 | 03 | .7089 | 04 | .5288 | 02 | .7279 | 04 |
| .7083 | 03 | .5657 | 04 | .6670 | 03 | .5168 | 03 | .5539 | 03 |
| .7072 | 02 | .4827 | 05 | .5015 | 02 | .3233 | 04 | .4826 | 02 |
| .6512 | 73 | .4656 | 06 | .3070 | 05 | .1365. | 76 | .4260 | 06 |
| .6291 | 74 | .4270 | 07 | .2109 | 06 | .1259 | 77 | .3710 | 05 |
| .6270 | 76 | .3815 | 08 | .1819 | 76 | .1084 | 74 | .3080 | 07 |
| .6185 | 75 | .2725 | 13 | .1810 | 75 | .0995 | 74 | .2959 | 08 |
| .6109 | 78 | .2516 | 12 | .1739 | 73 | .0734 | 72 | .2880 | 09 |
| .6087 | 70 | .2305 | 10 | .1689 | 76 | .0665 | 73 | .2781 | 11 |
| .6049 | 73 | .2200 | 09 | .1605 | 74 | .0521 | 06 | .2509 | 10 |
Similarly, on the off chance that we plot the three best outline esteems for every calculation on the number of bunches got, it shows that the framed bunches are made out of two, three, four, and five gatherings. Three out of the five calculations utilized in experimentation got the best incentive in outline for a bunch comprising of four gatherings. K-implies calculation is the best worth got. These outcomes can be found in Figure 5.7.
To see more unmistakably the importance of this Silhouette esteem, use Figure 5.8 where the outline of reports having a place with various gatherings can be seen, that is, the records having a place with a similar gathering, show up together in a square.

Figure 5.7 Shows realistic of the three Silhouettes with a various number of groups esteems acquired by every calculation.
The Silhouette an incentive for each report is a separation that takes after how each archive is like different records inside their gathering. When contrasted and the archives from different gatherings, taking qualities inside the scope of −1 to 1. As appeared in Figure 5.8, the outline of the items from a similar gathering (for the four gatherings got) has near 1 positive quality and is wide, which is a pointer of value in the gathering. Just gathering 2 has a couple of articles with negative figures.

Figure 5.8 Shows Silhouette estimation using K-Means Algorithm archives by the four clusters.
5.7.2 Conclusion
Data Mining has importance in the quest for instances, in the determination, in the disclosing information, and so on, in various business units. Data Mining techniques and estimates, e.g., order, classification, etc., try people to identify indications of how to establish potential trends in organizations. Data Mining being commonly used in almost every sector wherever knowledge is generated, which is why Data Mining is regarded among the most important natural areas in information sets and data frameworks are one of the most promising collaborative advances in technology. We considered that Clustering is among the key content digging strategies for information extraction from huge assortments of unlabelled archives. In this paper, we applied the Knowledge Discovery in Texts (KDT) system, and we use bunching to group Documents accessible. We assessed the various outcomes as per an inside bunch legitimacy file, which permits us to acquire a top-notch grouping. The best outcome relates to k-Means calculation, with four groups. The acquired groups speak to records with various subjects, which are: data the executive’s frameworks, endeavor the board frameworks, man-made reasoning, and advanced picture preparing.
References
1. Kaur, R., Kaur, S., Kaur, A., Kaur, R., Kaur, A., An Overview of Database management System, Data warehousing and Data Mining. IJARCCE, 2, 7, 130, July 2013.
2. Fu, Y., Shih, M., Creado, M., Ju, C., Reorganizing Web Sites Based on User Access Patterns. Int. J. Intell. Syst. Account. Finance Manage., 11, 1, 130, 2002.
3. Maheshwar, K. and Singh, D., A Review of Data Mining based instruction detection techniques. Int. J. Appl. Innov. Eng. Manage., 2, 2, 13, Feb. 2013.
4. Ramamohan, Y., Vasantharao, K., Kalyana Chakravarti, C., Ratnam, A.S.K., A Study of Data Mining Tools in Knowledge Discovery Process. Int. J. Soft Comput. Eng., 2, 3, 131, July 2012.
5. Pande, S.R., Sambare, S.S., Thakre, V.M., Data Clustering Using Data Mining Techniques. Int. J. Adv. Res. Comput. Commun. Eng., 1, 8, 134, 2012.
6. Patra, R.K., Raja, R., Sinha, T.S., Extraction of Geometric and Prosodic Features from Human-Gait-Speech Data for Behavioral Pattern Detection: Part II, in: Advanced Computational and Communication Paradigms. Advances in Intelligent Systems and Computing, S. Bhattacharyya, N. Chaki, D. Konar, U. Chakraborty, C. Singh (Eds.), vol. 706, Springer, Singapore, 2018.
7. Zaïane, O.R., Foss, A., Lee, C.H., Wang, W., On data clustering analysis: scalability, constraints, and validation. In: M.S. Chen, P.S. Yu, B. Liu (eds), Advances in Knowledge Discovery and Data Mining. PAKDD 2002. Lecture Notes in Computer Science, vol 2336. Springer, Berlin, Heidelberg, 2002, https://doi.org/10.1007/3-540-47887-6_4
8. Salton, G., Automatic text processing: the transformation. Analysis and Retrieval of Information by Computer, Addison-Wesley Longman Publishing Co., Boston, MA, United States, 1989.
9. Raj, A.P., Raja, R., Akella, S., A New Framework for Trustworthiness of Cloud Services. Int. J. Res., 04, 1, 135, December 2017.
10. Jain, A., Murty, M., Flynn, P., Data clustering: A review. ACM Comput. Surv., 31, 264–323, 1999.
11. Mu, T., Goulermas, J., Korkontzelos, I., Ananiadou, S., Descriptive document clustering via discriminant learning in a co-embedded space of multilevel similarities. J. Assoc. Inf. Sci. Technol., 67, 1, 106–133, 2016.
12. Lenka, R.K., Rath, A.K., Tan, Z., Sharma, S., Puthal, D., Simha, N.V.R., Tripathi, S.S., Prasad, N., Building Scalable Cyber-Physical-Social Networking Infrastructure Using IoT and Low Power Sensors. IEEE Access, 6, 1, 30162–30173, 2018.
13. Na, S. and Xumin, L., Research on k-means Clustering Algorithm. IEEE Third International Conference on Intelligent Information Technology and Security Informatics, 2010.
14. Cios, K.J., Pedrycz, W., Swiniarsk, R.M., Data Mining methods for knowledge discovery. IEEE Trans. Neural Networks, 9, 1533–1534, 1998.
15. Mu, T., Goulermas, J., Korkontzelos, I., Ananiadou, S., Descriptive document clustering via discriminant learning in a co-embedded space of multilevel similarities. J. Assoc. Inf. Sci. Technol., 67, 1, 106–133, 2016.
16. Apache PDFBox, A Java PDF Library, https://pdfbox.apache.org/, September 2016.
17. Nalawade, R., Samal, A., Avhad, K., Improved Similarity Measure For Text Classification And Clustering. Int. Res. J. Eng. Technol. (IRJET), 3, 6, 140, 2016.
18. Kanan, T. and Fox, E., Automated Arabic Text. Classification with PStemmer, Machine Learning, and a Tailored News Article Taxonomy. J. Assoc. Inf. Sci. Technol., 67, 140, 2016.
19. Swapna, N. and Raja, R., An Improved Network-Based Spam Detection Framework for Review In online Social Media. Int. J. Sci. Res. Eng. Manage. (IJSREM), 03, 09, 141, Sep 2019.
20. Tang, B., He, H., Baggenstoss, P., Kay, S., A Bayesian classification approach using class-specific features for text categorization. IEEE Trans. Knowl. Data Eng, 28, 6, 1602–1606, 2016.
21. Sahu, A.K., Sharma, S., Tanveer, M., Internet of Things attack detection using hybrid Deep Learning Model. Comput. Commun., 176, 146–154, 2021, https://doi.org/10.1016/j.comcom.2021.05.024.
- *Corresponding author: [email protected]