
11
Developing Decision Making and Risk Mitigation: Using CRISP-Data Mining
Vivek Parganiha1*, Soorya Prakash Shukla2 and Lokesh Kumar Sharma3
1Department of Computer Science &Engineering, Bhilai Institute of Technology, Durg, India
2Department of Electrical Engineering, Bhilai Institute of Technology, Durg, India
3ICMR-National Institute of Occupational Health, Department of Health Research, Ministry of Health and Family Welfare, Ahmedabad, India
Abstract
In this chapter, we will examine the usage of CRISP-DM philosophy in an ERP framework, which contains gigantic measures of the Information associated with the actual implementation of the business steps. Such systems get a particular method of tracking activities that leads to a confusing description of business measures in opportunity reports. A few works have been led on ERP frameworks, the greater part of them zeroing in on the improvement of new calculations for the programmed revelation of business measures. We zeroed in on tending to issues like, in what capacity can associations with ERP frameworks apply measure mining for breaking down their business measures to improve them. CRISP-DM had already emerged as that of the agreed standard for the development of data analytics and data Discovery Projects. Productive Data Mining involves three classes of exposure capabilities in a specific incident, sequence and determination. The Data operator uses more than a single testing technique to secure optimum performance. The goal of this article is to upgrade the efficiency usability comprehensibility of data mining processes by updating the CRISP-DM system about its use in ERP cases, defined in terms of specific execution tools and bit-by-bit synchronization. The research confirms that the availability of ERP content improves vital and organizational dynamics. The terms Big Data and Data mining are regularly utilized in a similar setting.
Be that as it may, it is essential to isolate the two terms appropriately. Big Data manages data that can’t be handled effectively and inside a sensible time frame utilizing traditional techniques and devices. Data Mining is frequently utilized for a lot of data, yet isn’t restricted to Big Data. This is a major test for data science. In this way, for organizations like Get Your Guide, it is critical to deal with a lot of Data appropriately, decipher them effectively, and act as needs are. Cross-Industry Standard Process for Data Mining (CRISP-DM) would be an identical process method that can be used for data analysis to search sets of data for instances, shapes, and connexions. For this, the standard characterizes six unique stages, which must be completed at least multiple times. CRISP-DM has built up itself worldwide and is one of the most now and again utilized investigation models in this condition.
Keywords: Enterprise Resource Management (ERP), Systems, Applications, and Products (SAP), Auditory processing disorder (APD), Clustering, Classification, Cross-Industry Standard Process for Data Mining (CRISP-DM), regression, association analysis
11.1 Introduction
CRISP-DM was imagined in late 1996 by three veterans of the youthful and juvenile Data mining market. CRISP-tells the Data Processing predictable ways of the Cross Industries. Such an information retrieval Period system gives a schematic of the existing pattern of the data gathering undertaking. It contains all the periods of a venture, their errands, and the connections between these undertakings. Interfaces can occur for the said data-mining operation, focusing on the intent, system, and enthusiasm of the developer and, most of all, details. CRISP-DM separates the existence pattern of a Data mining venture into six stages. These six elevated level periods of CRISP-DM are as yet a decent portrayal for the examination cycle.
Data mining can be utilized to consequently decide critical examples and concealed relationships from a lot of Data. Data mining gives experiences and relationships that had in the past gone unrecognized or been overlooked because it had not been viewed as conceivable to investigate them [1]. As a rule, Functional prerequisites and Business rules can’t be ported starting with one ERP usage then onto the next because nearby tasks have exceptionally explicit [2] and altered techniques for working that hardware [3]. ERP frameworks execute exceptionally tweaked answers to meet explicit business necessities of undertakings. As each undertaking has distinct and unique Data Mining needs, this is completely absurd to assume static designs to produce national statistical. Data mining specialists are being developed to create different systems to meet global needs that benefit dynamically. Information retrieved mostly from the ERP framework could always be retrieved to identify operational issues, often including—comparative element estimation to manage service requests, user beat, deliberately promoting new items capacity, sales analysis, and so on. ERP can assume a basic part of driving accurate and fast decisions (product perceived usefulness, development expenditure) with accurately defined Information. Each benefit of ERP execution is being measured through both quantitative and subjective contexts, such as acceptable market strategies, enhanced customer service, reduced costs, improved profit margins, faster transaction times, the panel’s process flow, and a reduction in the amount of funding the leaders are blundering [4]. Throughout this paper, we addressed how well the CRSIP-Data Mining technique could be modified scheduled the ERP structure Facts of an immense assembly effort, whereby SAP will be the provider of the ERP structure [5].
11.2 Background
Throughout the mid-1990s, as data analysis matured via a small child to a young person, investigators spent a lot of effort to prepare data with truly limited equipment and minimal day-to-day recording speed. It is just frequently that there were one or two ‘data analysts’ in a specific space, and we were significantly more likely to be named ‘prescient modelers’ because this kind of demonstration became cutting-edge throughout its day.
Although this ‘90s progressed, there was a distinctive process that led others to normalize the activities we had studied in a traditional method. Undertakings like this do proceed through, considering so anyone might hear whether there even was a typical methodology given that the issues looked so disparate. Notably, there seemed to be.
The majority of current rivals of operating equipment, SPSS, and Teradata, together with three early-initiated client collaborations, Daimler, NCR, and OHRA brought together a particular SIG (SIG) in 1996 (apparently one of the early-initiated community-oriented projects over the currently available global web) because, over not even one year, they worked out yet how to systematize whatever will always be the CR currently.
The CRISP-DM wasn’t the best choice. The SAS Organization, which has been around older than anyone can remember, had its implementation named SEMMA (Sample, Explore, Modify, Model, and Assess), but within just a year or two, some experts put forward the CRISP-DM framework.
11.3 Methodology of CRISP-DM
CRISP (Cross Industry Standard Process for Data Mining) seems to be an information analysis assessment design that illustrates normally recycled methods used by structured data diggers to deal with market speculation [5]. It has acquired insights from the much more significant pre-2000 designs and remains the basis aimed at several further schemes. The CRISP-DM 2.0 Special Interest Group (SIG) is being established for the sole purpose of modifying the CRISP-DM design towards an outlying, more competent representation of the advances made in the corporate sector, although the updated iteration becomes comprehensive [6]. The CRISPED technique is portrayed regarding a progressive cycle model, comprising of sets of errands depicted at four degrees of reflection (from general to explicit): stage, conventional undertaking, particular assignment, and cycle occasion shown in Figure 11.1.
The Orientation Model for CRISP-DM:
Each existing Data Mining Period Model outlines the existing pattern of the Data Mining undertaking. It contains the periods of a venture, their particular assignments, and the connections between these undertakings. At this portrayal level, it is absurd to expect to recognize all connections. Interfaces can exist for any information retrieval undertaking, focusing on the intent, context, and enthusiasm of the client and, above all else, on the proof.

Figure 11.1 Shows CRISP-DM methodology.
The existing pattern of a Data mining venture comprises six stages, which appeared in Figure 11.2. The succession of the stages isn’t unbending. Moving to and for between various stages is consistent.
Required. Each stage figures out which stage, or specific assignment of a stage, must be performed straight away. The bolts demonstrate the most significant and continuous conditions between stages. The external hover in Figure 11.2 is a recurrent concept of data analysis activity. Big data did not stop until the response has been transmitted. Activities that have taken place throughout the period and from the sent agreement will cause new, often more active, business questions. Resulting Data mining cycles can benefit from past experiences. In the corresponding segment, we conveniently outline each phase:

Figure 11.2 Shows all six stages of the CRISP-DM model.
11.4 Stage One—Determine Business Objectives
The initial step is attempting to show signs of improvement thought of what business needs ought to be extricated from Data. The investigator needs to comprehend what the client truly needs from a business point of view. The client frequently has a few contending objectives and limitations that should be appropriately organized. Besides, the business understanding stage is tied in with characterizing the particular goals and prerequisites for Data mining. The consequence of this stage is the definition of the errand and the portrayal of the arranged harsh methodology to accomplish both business and Data mining objectives. This likewise incorporates the underlying choice of apparatuses and strategies.
Figure 11.3 shows the business understating phase of CRISP-DM model. Furthermore, it seems you’re going to lay out the organizational achievement criteria that you’re going to use to determine if the mission has been successful from a marketing point of view. Expectations of this progression are some significant reports. The stock of assets records all assets accessible for the task. These may incorporate individuals (Data excavators, yet additionally those with master).

Figure 11.3 Shows business understanding phase of CRISP-DM model.
Data on the business issue, Data supervisors, specialized help, and others), Data, equipment, and programming. Prerequisites, suspicions, and compels are recorded.
Prerequisites, for instance, incorporate a timetable for culmination, legitimate and security commitments, and necessities for adequate completed work. Also, you distinguish causes that could postpone the finish of the undertaking and set up an emergency course of action for every one of them. A significant part is making a typical comprehension of phrasing. You may make a glossary with meanings of business and Data mining terms that apply to your task so everybody engaged with it can have a typical comprehension of those terms. Besides, you set up a money-saving advantage investigation. If the advantages don’t fundamentally surpass the costs, stop and rethink this examination and your undertaking. After that, you likewise characterize Data mining achievement rules, which are specialized models important to help the business achievement standards. You attempt to characterize these in quantitative terms (for example, model precision or prescient improvement contrasted with a current strategy).
11.4.1 What Are the Ideal Yields of the Venture?
Set targets—This implies depicting your essential goal from a business viewpoint. There may likewise be other related inquiries that you might want to address. For example, the main goal seems to be to maintain existing users on track by predicting if they are already likely to switch to the contestant. Business development Concerns could be “would the network used affect not just whether users stay or go?” or “Will bring down ATM charges fundamentally decrease the quantity of high-esteem clients who leave?”
Produce venture plan—Then, you’ll see the framework for all the achievement of information gathering and core competencies. The agreement should specify the resources to be used throughout the remaining amount of the undertaking, including all the fundamental options of technologies and techniques.
Business achievement measures—Sometimes, you can distribute the parameters that you will use to determine if such an initiative has so far been successful from a business point of view. This should also ideally be clear and measurable, for instance, a decrease of client stir to a specific level, anyway. In some cases, it may be important to have more abstract measures, for example, “give helpful experiences into the connections.” If this is the case, then it should be clear who it is that makes the emotional judgment.
11.4.2 Evaluate the Current Circumstance
It, therefore, involves further point-by—Reference details describing almost every resource, restrictions, expectations, and influences that you will have to decide on the Data Analysis Purpose and Action Strategy.
Availability of assets—Inventory of resources that are available to the venture, such as:
- Workers (industry experts, computer analysts, technical assistance, data mining experts)
- The aid of information technology (resolved main product, real, stored, or functional data)
- Identification of properties (appliances stages)
- computing (Data mining equipment, other related computing).
Basic requirements, theoretical framework—Outline all the conditions of the undertaking, for example, the schedule for resolution, the requisite understandability and consistency of the measurement, and any data protection issues, as well as every regulatory matter. Try to make sure users are permitted to use the Data. Pulled away from the worries of the operation. There might be some concerns more about details that can be confirmed throughout data mining, but these may also include vague requirements of the organization involved. Throughout reality, it is especially noteworthy to emphasize the last ones listed in the sense that they influence the reliability of the experiment. Rundown the imperatives on the venture. These might be imperatives on the accessibility of assets, however, they may likewise incorporate innovative requirements, for example, the size of the informational collection that it is common sense to use for demonstrating.
Hazards and Opportunities—List the hazards or opportunities that could delay the plan or make it short. Run down the list of possible actions—which steps would you take if certain hazards or circumstances arise?
Phrasing—Formulate a synopsis of the text specific to the project. And in the most aspect, this could have two sections:
- A checklist of significant trade phrasing that establishes part of every business concept that is available to the company. Creating this flowchart is a useful investment of “data identification” and guidance.
- A definition of the text of Data Mining, outlined with the concepts related to the market problem resorted to.
Expenditures and Benefits—Create a money-saving opportunity analysis for an activity that measures the costs of the endeavor and the potential benefits of the arrangement in the condition of its effectiveness. The whole association should be as clear as might normally be considered. For example, in a work setting, you can use strategic actions.
11.4.3 Realizes Data Mining Goals
The main business specifies the locations in the industry text. The data mining goal specifies company goals on a comprehensive basis. For example, the sector motive may consist of ‘Incremental Index Offers to Current Clients.’ The data mining objective may consist of ‘Anticipate how many devices and consumer transactions have taken into account their transactions in recent years, the details segment (age, income, location, etc.) and the cost of the item.’
Technological breakthrough Models—portrays the anticipated returns of an initiative encouraging the acquisition of company attractions.
Data mining accomplishment models—characterize the criteria for the successful performance of an activity in advanced requirements—for instance, a special degree of sensory precision or identity identification at a particular stage of the “boost” process. As with marketing achievement phases, theoretical Information may be needed in which cases the user or individuals trying to make a sensible choice are involved.
A project of advancement production:
Depict the planned structure for the accomplishment of the Data Mining objectives and the success of the strategic goals in this context. The agreement should specify the methods to be used for the rest of the mission, except the basic specification of the technologies and techniques.
Scope statement—List several processes to be completed throughout the undertaking, including the length of the undertaking, the resources provided, the structured data, the outcomes, and the parameters. Wherever practicable, request and clearly state the focus of the Broad Scale in the Data Mining method, e.g., repetition of the show and evaluation phases. In particular, as part of the risk strategy, it is important to examine the circumstances throughout time schedules and hazards. Mark the implications of such inquiries specifically in the risk plan, possibly with events and strategies where the hazards are illustrated. Select again which assessment technique would remain utilized at the estimation stage? The business strategy is going to be a special collection. Towards the end of each point, you can audit progress and milestones and update the business plan as well. The emphasis of the specific research on these updates should be relevant for the business strategy.
Start of Assessment of Equipment and Procedures—just at the end of the main point, an assessment of the tools and techniques should be attempted. After this, for example, users choose a Data Mining System that supports different strategies in different phases of the process. It is important to track techniques and services right from the start in the method because of the choice of devices and systems which affect the entire project.
11.5 Stage Two—Data Sympathetic
Figure 11.4 shows data understanding phase of CRISP-DM model. As a feature of the Data understanding, an endeavor is made to get a first outline of the accessible Data and their quality. This includes checking whether all the necessary Data (to meet the Data Mining objectives) is accessible, just as building up an arrangement to figure out which Data is required. To begin with, users present the Information that has been gathered, along with its structure, its magnitude, some new substrate outlines that have already been established. Users determine unless the Data you have collected fulfills certain requirements. On the off chance that a portion of the Data you need is inaccessible, you need to conclude how to address that issue. Choices could be subbing with an elective Data source, narrowing the extent of the undertaking, or assembling new Data. Bringing the Data into the Data mining stage, you’ll be utilizing for the task causes it conceivable to affirm you to do as such and that you comprehend the cycle. Throughout this preliminary, you may find programming (or equipment) restrictions you had not envisioned, such as cutoff points on the number of cases, fields, or on the measure of memory you may utilize or powerlessness to peruse the Data arrangements of your sources.

Figure 11.4 Shows data understanding phase of CRISP-DM model.
At that point, you investigate the Data utilizing questioning, Data perception, and detailing procedures. This may incorporate discovering the dissemination of key characteristics, basic accumulations, or basic factual examinations. To maintain a strategic distance from potential traps, the Data quality is investigated and assessed. Issues with the nature of the current Data comparable to the assignment characterized in the past stage must be recognized.
- Normal investigations during that point are as follows:
- Is indeed the Information full (spreads out all the cases requisite)?
- Would it be right, or would it cause complications, so if there are mistakes, how natural is it?
- Are there insufficient attributes throughout the dataset?
11.5.1 Portray Data
Inspect the “gross” or “surface” properties of the obtained Information and statement proceeding with the outcomes.
Knowledge portrait document—Identify the Information that has been gathered, as well as its structure, its quantity (the number of proceedings and turfs in the respective table taken as an instance), objects elements, and any new substrate details that consume already remained defined. Evaluate if the Information gathered satisfies the needs.
11.5.2 Investigate Facts
In this fact, you will discuss data mining attributes using questioning, statistical modeling, and disclosure methods. They may include:
- Utilization of main characteristics (e.g., objective consistency of the target task)
- Relations among collections or limited amounts of quality
- Findings of specific collections
- Assets of notable sub-populations
- Simple analysis of the evidence.
Such reviews can directly answer Data Mining priorities. These can also incorporate or improve information description and presentation assessments and feeding into improvements and other steps in the preparation of data required for advanced analysis.
Information investigation report—Explain the devastation of the data processing and its impact on the rest of the tasks like first findings or assumptions. To display data quality, which suggests further evaluation for compelling data subsets, illustrations and graphs may be integrated into this.
11.5.3 Confirm Data Quality
Look at the nature of the Data, tending to questions, for example,
- would be the data correct (distributes all specific points)?
- would it be correct or includes errors and, also, if flaws, so fundamental is it?
Seem to be the Data deficient in quality? If so, who are they openly discussed, where else are they occurring, and even how important are they?
11.5.4 Data Excellence Description
Redesign the results from the data product testing. If quality issues exist, propose potential arrangements. Answers for Data quality issues by and large rely intensely upon both Data and Business Data.
11.6 Stage Three—Data Preparation
In this stage, the Data is ready for further Data mining measures. Data readiness is one of the most significant and frequently tedious parts of Data mining. Indeed, it is assessed that Data planning, as a rule, takes 50–70% of an undertaking’s time and exertion. Business choices depend on examination. Yet, on the off chance that the Data is off base or inadequate, your investigation illuminates wrong business choices. Terrible investigation implies helpless business choices.
In this manner, data from various sources is blended and tidied up so that there is no copy, erroneous or inadequate passages (see Figure 11.5). Changes are made, for example, finding sources to make explicit Data amendments, barring a few cases or individual cells (things of Data), or supplanting a few things of Data with default esteems. The deliverable for this undertaking is the Data cleaning report, which records each choice and activity used to clean the Data. This report should cover and allude to every Data quality issue that was distinguished in the confirm Data quality errand in the Data understanding period of the cycle. The subsequent stage is to set up the substance of the Data, which implies that the Data is moved into usable organizations. Users could require certain assets to include, in a great structure, maximum data, or entirely new traits, innovative devices that are formed from at least one already current structure. Methods should be identified other than choices. This includes features (segments) as well as the selection of data in a graph. The guidelines where you can also use for this selection implement the accuracy of the study for your information retrieval goals, the characteristics of the research, and additional specific considerations, such as large data thresholds and data types. The data system is used for a final instance show that describes the purpose of the subsequent demonstration timespan.

Figure 11.5 Shows data preparation phase of CRISP-DM model.
11.6.1 Select Your Data
This will be the stage of the organization in which you select the Data that can be analyzed. The criteria that may use to assess this option include the purpose of data mining information, information quality, and many other future challenges like bandwidth utilization or data types limitations. Make sure that data evaluation includes quality selection (sections) as well as record selection (columns) in the graph.
Justification for concern/exclusion—Describe the facts and intent behind options to be transformed/excluded.
11.6.2 The Data Is Processed
That order involves the quality of the data to the degree specified by the testing procedures selected. It might involve selecting precise data subtypes, introducing sensible configurations, or even more focused techniques such as evaluation by the demonstration of the incomplete data.
Reporting on data pre-processing—Explain which solutions you have made and how you have moved to deal with data production problems. Accept any modifications required in the data for cleansing and its potential effect on the results of the case.
11.6.3 Data Needed to Build
This company involves valuable data preparation activities, for instance, the development or improvement in the quality of current assets, certain characteristics, or the whole records.
Defined Attributes—New features came up with a similar database of at minimum one existing feature that may be used to evaluate another area attribute, for example.
Databases created—users reflect the creation of entirely new Information now. It will also have to log users who won’t be buying in the preceding period, for example. None no justification for these details to be found in the rough details, yet it can communicate loudly the way normal customers have made nil purchases for illustrating uses.
11.6.4 Combine Information
There are methods by which Data is compiled into new documents or values from several files, tables, or Information.
Combined data—The merger of tables applies to at least two tables of separate data involving common aspects being consolidated. For example, there might be a table with data on the overall efficiency of stores (for example, floor room, sort of center), a table with a description of deals (for example, incentives, improvements in deal percentages from previous years), and a table with data on the socioeconomics of the area as a whole. Each table includes for each store one record. These tables can be combined into another one-store table with fields from source tables entering each store.
Collections—arrangements refer to operations in which data from different documents and specific tables are gathered in new characteristics. For example, turning over a client’s table transactions where each transaction has one record at another table and where there is one report at each client with fields such as purchase amounts, regular purchase sums, percentage of MasterCard requests prepared, percentage of items in progress, etc.
11.7 Stage Four—Modeling
Displaying is the explanatory center of the Data mining measure. This is the place the determination and utilization of demonstrating procedures occur. Before really constructing a model, you ordinarily separate the data-set into train, test, and approval sets. At that point, you construct the models on the train set. Several signifying procedures mark open presumptions approximately the Data, for occurrence, the entire behaviors have constant circulations or not any lost abilities are acceptable. Also, with any demonstrating device, there is frequently an enormous number of boundaries that can be balanced. You need to record any suspicions made and list the boundaries and their picked qualities. The discovered models at that point go through a specialized assessment stage. They are evaluated for precision and over-simplification. The discovered standards are applied to test Data records that were not utilized in the demonstrating.
Figure 11.6 shows the modeling phase of CRISP-DM model. Iterative advances are utilized to move toward step by step the last Model, which just permits negligible upgrades from a Data diagnostic point of view.
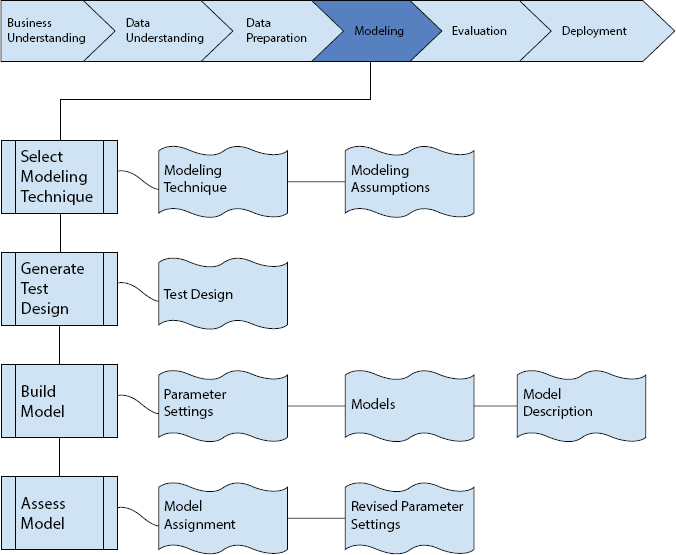
Figure 11.6 Shows modeling phase of CRISP-DM model.
11.7.1 Select Displaying Strategy
Also, as preliminary stages of the show, users will pick a specific demonstration technique that they will be using. It’s because you’ve only selected a technique mostly during the corporate strategy. At this point, you will choose a specific display system, e.g., the tree of selection operating with C5.0 or the cognitive organization age with return propagation. If various approaches are used, perform this assessment separately for each process.
Demonstration Process—Report the actual show technique that will be used.
Showing assumptions—Several presentation techniques state clearly assumptions about either the data, for example, that all attributes require standard commercial activities, that neither lacking values are required, that the category feature should be indicative, and so on. Track any questions raised.
11.7.2 Produce an Investigation Plan
Ever since users produce a product, one must build a strategy or part to evaluate the accuracy and reliability of the scale. For instance, in controlled data mining firms, for example, arrangement, it is entirely assumed that error rates will be used as quality metrics for data mining models. As a result, you usually divide the dataset into the train and test sets, install the Model on the train set, and measure its consistency on the different test sets.
Test strategy—Explain the intended plans for the planning, implementation, and evaluation of the designs. A crucial part of the settlement is determining how and where to isolate the open database in the planning, review, and acceptance of databases.
11.7.3 Fabricate Ideal
She is outing the displaying instrument on the prepared dataset towards making at least a single demonstration.
Boundary settings—With any displaying instrument, there is frequently an enormous number of boundaries alright, it could be done. They were running down the barriers and their preferred attributes, along with the reason for the judgment on frontier variations.
Models—those would be the real models produced by the demonstration system, not the design study.
Concept Portraits—Identify the following models, report on the perception of the models, and document any problems with their consequences.
11.7.4 Evaluation Model
Read and understand the designs as suggested by the Storage space, certain Data Mining Efficiency Expectations, and the desired test schedule. Evaluate the success of the use of demonstration and disclosure techniques; in fact, at that stage, connect market analysts and area experts afterward to speak regarding data mining creates a workplace environment. This undertaking just thinks about models, while the assessment stage likewise considers all different outcomes that were delivered throughout the task.
At this stage, you should rank the models and survey them as indicated by the assessment standards. You should consider the business destinations and business achievement rules as far as possible here. In most Data mining ventures, a solitary strategy is applied more than once, and Data mining results are produced with a few distinct strategies.
Model appraisal—Review the aftereffects of this project, list the appearances of one’s produced replicas (e.g.in expressions of precision), and flourishing their excellence corresponding to some alternative.
Changed boundary backgrounds—Permitting to the ideal appraisal, modify boundary sets, and adjust them for the subsequent displaying course. Demonstrate the structural Model and assessment once users completely embrace the discovery of the appropriate system(s). Document all these modifications and reviews.
11.8 Stage Five—Evaluation
The assessment guarantees a definite examination of the made Data models with the assignment and chooses the most appropriate Model (see Figure 11.7 which shows evaluation phase of the CRISP-DM model). The consequences of the past advances are assessed utilizing the business rules built up toward the start of the undertaking. So this stage is tied in with checking whether the Data mining arrangement fulfills the business issue and trying can determine if there would be a market motive behind its lack of a blueprint. One option is to evaluate the system(s) for test applications in such a real program, to decide if it fills in as well in the work environment as it did in your tests if time and spending limitations grant. Presently you may set aside an effort to survey your cycle. This is a chance to spot gives that you may have neglected furthermore, that may cause you to notice imperfections in the work that you’ve done while you, despite everything, have the opportunity to address the issue before the organization.

Figure 11.7 Shows evaluation phase of the CRISP-DM model.
At long last, the Model might be prepared to send, or you may decide that it is smarter to rehash a few stages and attempt to improve it.
11.8.1 Assess Your Outcomes
Previous evaluation measures have handled variables such as accuracy and generalization of the method. Throughout this development, one will determine how often the Model meets your business targets and try to determine if there is any corporate incentive behind its failure of this design. Another other option is to validate the system(s) for application areas in a specific implementation if the time and cost conditions are given. In contrast, the evaluation process involves the review of some of the other data mining algorithms that you could have made. Data mining findings involve models that are associated with the first business objectives and all the various discoveries that are not really associated with the first business objectives but may also reveal additional challenges, details, or indicators for potential disturbances.
Assessment of data mining algorithms—Overview assessment sets out the terms of business achievement steps, along with the current declaration as to whether the project already meets the underlying business objectives.
Authorized Models—After reviewing models for business achievement standards, the models developed that achieve the chosen parameters remain defined versions.
11.8.2 Survey Measure
Now, the subsequent models give off an impression of being agreeable and to fulfill business needs. This is currently necessary if you to carry out something more supervisory review of the Data Mining commitment to determine there is some big issue or mistake which has already been ignored in one aspect other. This audit additionally covers quality confirmation issues—for instance: did we accurately fabricate the Model? Did we utilize just the characteristics that we are permitted to utilize and that are accessible for future investigations?
Audit of a cycle—Illustrate the process analysis or the characteristics of the activities which have been skipped so those that should be repeated.
11.8.3 Decide on the Subsequent Stages
Contingent upon the consequences of the appraisal and the cycle audit, you currently conclude how to proceed. Do you finish this undertaking and proceed onward to sending, start further emphasizes, or set up new Data mining ventures? You ought to likewise assess your outstanding assets and financial plan as this may impact your choices.
Overview of possible activities—Describe the planned additional tasks, as well as the goals beyond and against each substitute.
Alternative—Explain the option about how to proceed, including the reasoning.
11.9 Stage Six—Deployment
Figure 11.8 shows deployment phase of the CRISP-DM model. After Data planning, model structure, and model confirmation, the chose model is utilized in the organization stage. Creating an ideal remains usually not the appearance of the project. Irrespective of whether the objective was to extend the Data on the Data, the Data increased should now be handled and introduced to the client so the client can utilize it with no issues. Contingent upon the prerequisites, this improvement stage can comprise the formation of a straightforward report or the perplexing usage of a repeatable Data mining measure all through the organization. The cautious arrangement of a support methodology assists with evading superfluously large proportions of inaccurate use of data mining results. To monitor the transfer of the Data Mining result(s), the group requires a point-by-point calculation program. The whole structure acknowledges a specific type of organization.

Figure 11.8 Shows deployment phase of CRISP-DM model.
At last, the Data mining group should survey its work. This is the place a blueprint of any work techniques that worked especially well ought to be done, so they are archived to utilize again later on, and any upgrades that may be made to your cycle. It’s additionally the spot to archive issues and terrible encounters, with your suggestions for evading comparative issues later on.
11.9.1 Plan Arrangement
At the phase of the agreement, users will consider the findings of the evaluation and settle on a method for submitting them. When an effective strategy for making the related model(s) has been established, this approach is recorded here for later organization. It is necessary to recognize the required assets of the firm mostly during the phase of business comprehension because although delivering is crucial to the implementation of the initiative. That’s where the perceptive analysis helps to strengthen the objective function of the market.
Mailing a proposal—Outline the agreement process, discussing essential developments, and how to make them work.
11.9.2 Plan Observing and Support
Observation and assistance are major concerns unless the findings of data mining prove to be of interest to day-to-day activity and its situation. The careful structure of the maintenance approach helps to prevent unnecessarily broad areas of abuse of data mining performance. In screening the structure of the Data Mining Outcome(s), the business requires a thorough control plan. This structure is known to be a special form of organization.
Testing and Maintenance Plan—Review evaluation and management strategies, including key developments and how to execute them.
11.9.3 Produce the Last Report
Towards the end of the plan, users are always going to check the last article. Dependent on the attempting to send a proposal, the whole article could only be a summary of the arrangement and its meetings (if it isn’t being reported as a constant flow for now though) or it could be a final and in-depth presentation of the Data Mining result(s).
Final Report—it will be the last recorded study on the Data Mining Contribution. It involves all previous assumptions, summarising, and filtering out all the data.
Final Presentation—A conference will also take place regularly after the company, at which the findings will be reported to the user.
11.9.4 Audit Venture
Review whatever worked with and what turned out to be incorrect, what worked well, and what needs to be changed.
Perception reports—Review the substantial experience acquired during the undertaking. For example, any entanglements you have encountered, deluding methods, or insights into the choice of the most suitable Data Mining approaches in comparative and correlational may be important to this report. In ideal obligations, the record of experience shall also cover any records which have been made up of individual projects in the past duration of the mission.
11.10 Data on ERP Systems
The ERP systems offer an improved degree of association to support focus company activities and are a mixture of the three most important segments—Market Management Techniques, Data Technology, and Clear Business Objectives. Until the previous decade, organizational and specific requirements and not data were the central focus of most ERP use. At the heart of ERP is an all-around distributed data store, which collects data from and flexibly into fragmented applications running at an all-inclusive processing level. Data in big corporations Partnerships are aggregated across a wide variety of functional categories and at times separated by geographical boundaries [10]. Such information areas can help support structural units, but do not attempt to extend to a wide range of operations, speeds, and capabilities (see Figure 11.9 for ERP Framework).

Figure 11.9 Shows coordination of various modules in ERP frameworks.
In such situations, it is time critical to store the dispersed data in a solitary database called a Data Warehouse (DW) before sending it to the Data Mining Movement. The main goal of the ERP system is to integrate and aggregate data and cycles from all useful divisions of the association for easy access and structured work processes. Joining is typically developed through the creation of a single data set shop, which corresponds to numerous product requirements, putting together separate categories of business insights and results.
This main element of data mining in ERP Systems is to manage data in the Company database system for the digitalization of adaptive and measure planning. SAP provides a complete data storage situation that optimizes its most challenging activity in developing a data distribution center—data capture from ERP applications and developing closed-circuit highly customized for business-particular purposes [1, 10]. For our analysis, the liquidity Calculation Data of the financially supported is used to update the CRSIP methodology and to focus on useful data. Fund flow declaration consists of ERP Data from Sales, Deposits, Loans, Transactions, and Collections through subsidiaries and Specific recreation activities.
11.11 Usage of CRISP-DM Methodology
The development of the design is not generally the end of the company. Despite as to whether the purpose and behind the model is to create Data on Data, the data collected must be filtered out again and constructed in such a way that it can be used by the client. The methodology adopted for working capital Data mining is shown in Figure 11.10.
We have utilized instruments accessible in SAP Business Data Warehouse (BIW) to deal with exceptions, missing, conflicting, and copy esteems in the source Data [7]. The regularly looked for an advantageous incentive from this DM Model incorporates forestalling extortion, offering showcasing guidance, looking for productive clients, foreseeing deals and stock, and rectifying Data during mass stacking of the Database, otherwise called the Extract-TransformLoad activity (ETL) [8]. Encouragement for the use of DM originates from the value it brings to the candidates, and it lowers costs almost every time, for example by leaving aside cash if the process is efficient [9].
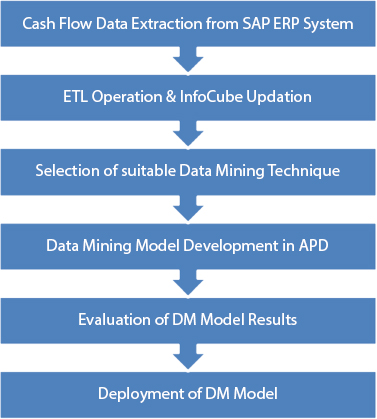
Figure 11.10 Cash flow data mining CRISP-DM methodology.
Two elevated level DM objectives are expectation and depiction. The first attempts to discover examples to anticipate the worth or conduct of some substance later on and the subsequent one attempts to discover designs portraying the qualities or conduct in a structure justifiable to people. These elevated level objectives are sought after through a few DM techniques, for instance, arrangement, relapse, bunching, summarisation, reliance displaying, and change, just as deviation identification [15]. The technique seems to have several computations that can be used to accomplish the goal, but a few calculations are best suited to certain challenging areas than others [20]. The ETL map is generated in the SAP BIW workstation with InfoCube Update shown below. This InfoCube is the DM Model Data Hotspot to be developed later in the SAP Analysis Process Designer (APD) work table (see Figures 11.11 and 11.12).

Figure 11.11 InfoCube loading in SAP BIW’s ETL mapping.

Figure 11.12 DM modeling & visualization of SAP ADP.
APD is a worktable used to visualize, alter, and submit data from the Company Delivery Center [22, 24]. APD software supports KDD steps where we can integrate and monitor data locations for complex data mining requirements.
Modeling and implementation of mining data:
The specific steps concerning CRISP-DM are set out below.
- a. Commercial knowledge
Following discussions with the Financing Working Board, the data related to accounting, Receipt and Payment Power, G/L Transactions for each date of posting, and the comparison of amounts registered shall be selected. In contrast, it is preferred to construct a processing method to forecast that G/L is likely to reflect those vendors with similar abilities. From that kind of data, we can determine amounts that are supposed to be paid or credited by each vendor on each date of publishing. These data can also be used in the Services and Expenditure Sub-Capacity field. - b. Recognizing of data
Voluntary Data generated in SAP ECC sources of data are managed in the SAP Business Distribution Center by highly trained data extraction [22]. The extraction process includes source data metadata and is designed to support the delta system, re-crysp-BIW with modified consistency. Quality management issues are resolved in the BIW worktable by limiting the relevant feature performance and the perceived attributes of the DM model. - c. Preparation of data
Released Source Data reaches the PSA (Persistent Staging Area) level of SAP BIW. in this, developers can change any database and correct any bugs if any. The specificity level of the PSA level is the same as that of the source frameworks. After the data was purged, it was stored into a DSO (Data Store Object). Data in DSO is stored in a respond correctly which can also be used to mount SAP InfoCube or Info Provider.
11.12 Modeling
Bring up the proper Data Mining Model is a complex arrangement but should recognize the confidence and self for the preparation of the evaluation period. With SAP APD equipment, we can construct Mining Simulations using DM Algorithms such as—cluster analysis, Grouping, Association analysis, and multiple regression analysis. The descriptive material used in these DM measurements [10] and the reasons and behind the compilation of a particular measurement is provided below.
11.12.1 Association Rule Mining (ARM) or Association Analysis
It is a The Data Mining method that was designed to assess the relationship between individual circumstances. The purpose of the association review is to explore designs, primarily in the field of commercial steps, and to prepare acceptable guidelines, such as ‘If a customer selects item A, the customer purchases items B and C also.’ Association Analysis Models are used to differentiate between strategically targeting doors open for different objects. Most of the analysis centers around the standard items and the processing sub-problem, i.e., finding all the constant items, each occurring at more than a base recurrence (min. maintain) between all transactions. Notable successive calculations incorporate Apriori, Eclat, FP-development, and CLUB. For the Cash Flow Data examination, the ARM model isn’t discovered reasonably, and henceforth the investigation results are not examined.
11.12.2 Classification Algorithms
Similar methods aim, only with the aid of certain approximation, to classify things into predetermined target audiences. The framework of the agreement model includes the preparation of data sets with known, separable objective classes, which means that the order results are continuously discreet [11]. Grouping targets vary from parallel to multi-class characteristics, and the models that attempt to predict the target class are correct with the aid of illustrative connexions from the data quality. Data grouping is a two-stage method in which the basic stage is the initiation phase in which the classifier measurement manufactures the classifier with the tuple preparation set, and the subsequent stage is the characterization stage in which the model is used for organization, and its execution is broken down by the tuple test set [12]. Option three is a Classification Scheme that generates a tree and a lot of rules, based on a model of different groups, from a given informative set [13]. Records that are open to the development of order techniques are usually partitioned into two different subsets—Training Set and Test Set. The former is used to evaluate the classifier, while the latter is used to calculate the accuracy of the classifier. Also, the precision of the classifier is regulated by the level of the test models that are successfully organized. Choice Tree The results of our evaluation are presented in the next region.
11.12.3 Regression Algorithms
The Projection model suggests the calculation of the statistical data area; this is the objective field in which the data record is based on the established predictions of other data fields with a similar nature. Established estimates of other required fields are termed input data fields or logical data fields. They can be either statistical or unmitigated. The predicted value is not likely to be distinct from any value found in the data used to produce the design [14]. A regression model is rendered and configured based on the informative sets of data records, the target field values of which are known. You may apply the planned model to recognized or unidentified data. The estimates of the knowledge fields are recognized in ambiguous data; however, the approximation of the objective field is not known [15]. A simple instance of cause similar, where the totality of measured mistakes is restricted.

The most extreme probability model is out(x) = wx, which is utilized for the forecast.
11.12.4 Clustering Algorithms
Grouping in Data mining remains a revelation cycle That packages a large amount of data with the final aim of boosting the intracluster similarity and limiting the clustering resemblance. Unless there is no fixed class, bundling is used to collect items that seem to drop away naturally. For our investigation, bunching calculations are generally discovered appropriate to distinguish important groups for examination. Bunching calculations are mostly of three kinds in particular—Hierarchical, Partition based, and Density-based Methods [16]. The significant calculations under every one of these techniques are examined herein.
a) Hierarchical Methods: Such methodology bundles data elements into a group tree. This approach can be frequently alluded to as either amount of starch or obstructive, depending on whether different leveled destruction is arranged in a base-up (pairing) or top-down (splitting) layout [17]. This strategy examines all the clusters that have so far been available at each process of the combination; the clustering strategies that we have gradually analyzed work, for example, by event occurring [18]. At any point, the grouping frameworks a tree with events on the leaves and a root hub that corresponds to the whole database. And first highest, the tree consists of a single root. Occurrences are included on an individual basis, and the tree is updated appropriately at each point. Relevant measurements in the different graduated groupings are:
- I. Agglomerative Clustering (Bottom-up): It calculates the difference between the same two categories and handles every circumstance as a variety on its own, at which point it identifies the two closest classes, combines them, and proceeds to do this until only one community is left. Evidence of the convergence of the frameworks of the different graded particular construct—parallel primarily available [19]
- II. Spider web Algorithm: It generally thinks about the best host, including another leaf, consolidating the dual top has and parting the greatest host while thinking about wherever to put another case
b) Partition-based Method: The bunches are framed to advance a target apportioning basis, for example, a difference work dependent on separation, so the articles inside a group are “comparable,” though the objects of various groups are “divergent” regarding the informational collection traits. Given D, an informational index of n articles, and k, the number of groups to frame, an apportioning calculation composes the items into k segments (k ≤n), where each segment speaks to a group [20]. Significant parcel grouping calculations are K-Means and EM (Expectation-Maximization)
c) Density-based Methods: This finds bunches with subjective shapes and commonly see groups as thick districts of articles in the Data space that are isolated by areas of a low thickness (speaking to clamor) [21, 22]. DBSCAN develops groups as indicated by a thickness-based network investigation. OPTICS stretches out DBSCAN to create a bunch requesting got from a wide scope of boundary settings. DENCLUE bunches objects are dependent on a lot of thickness dispersion capacities
11.13 Assessment
Only for evaluation of group, instance-based models, designers provide component data input for the planning and research process. The separating norm is that 66% of the information is used to plan and the remainder to test the effects of the model. The bunch model has formed ten groups and used to obtain yield visualization quantization time. Various What-If scenarios were run on these models; the accuracy is discovered to be within the desired range. The required quality characteristics are accepted against known outcomes, and as needs are the option of the model Data boundary as many leaf hubs, stooping standards are balanced to achieve the desired accuracy of the model. Care should be taken to refrain from over-fitting data with the intention that perhaps the design can require variations in data input [24].
11.14 Distribution
The consequences of SAP Data Mining replicas can be gotten to by all the worried in the subsequent manners. Model outcomes can be composed on to a level record and distributed on big business entryways of SAP, for example, at individuals combination layer
ii. Model outcomes are graphically imagined, and wanted outcome outlines are communicated to all partners
iii. Model outcomes in text structure are taken care of go into Enterprise Reports for dynamic at all levels.
11.15 Results and Discussion
The Decision Tree is a classification method that uses the approximation of data variables to predict the assessment of a specific factor. In the SAP Decision Tree Model, we have defined the G/L Accounts as an expected factor [25]. The area DT Pred Val002 in Table V refers to the estimate expected by the DM Model for the G/L Account. Field DT Pred Node002 is the core value in the decision tree, and Field DT Pred Prob002 is the probability of predicting accuracy. Certainly, the 1.0 probability estimate provides a clear accuracy of the predicted outcome, but the findings are exceptionally reliable with such a probability estimate of 0.2, 0.48, 0.78, and so on, as shown in Table 11.1 below.
Table 11.1 Shows cash flow statement source field in SAP System.
| Field | Description | SAP data type | Length | Default value |
| BUKRS | Company code | Char | 4 | 1000 |
| SAKNR | G/L Account | Char | 10 | No Default Value |
| BUDAT | Posting Date | Dats | 8 | No Default Value |
| BIZ_HEAD | Business Head | Char | 10 | OPER |
| WRBTR | Amount in LC | Curr | 13 | No Default Value |
| BELNR | Document Number | Char | 10 | No Default Value |
| GJAHR | Fiscal Year | Nume | 4 | 2012 |
| LIFNR | Vendor | Char | 10 | No Default Value |
| KUNNR | Customer | Char | 10 | No Default Value |
| WAERS | Currency | Cuky | 5 | INR |
The boundary used for the Cluster model is—Binning Interval—10; Reference Factor Weight—1.0. In Table 11.2 and Figure 11.13 below, field CL Pred Cluster002 speaks to the expected input data community. Again from Generalized Impact Map in Figure 11.14, Cluster No 6 has a specific number of items and can be used for mysterious data estimations.
For Regression Model, field SC_Score002 represents the predicted score for attribute amount.
11.16 Conclusion
In this examination, the CRISP-DM calculation and steps were explored; later, the Data related phases of the CRISP-DM use in a task (Data checking and assessment) were analyzed and clarified by utilizing a model application. In this cycle, the ERP frameworks situated in CRISP-DM calculation for Data Mining are broken down and prepared and demonstrated that the ERP framework has restricted abilities concerning research that really can resolve core business concerns, Mutual Knowledge, and Actionable Awareness to respond quickly to advertising requests with appropriate choices at each stage. Company analysts highly rely on analysis and answers to provide them with the Data they need to come to a firm conclusion on income and misfortunes, products and advantages, budgetary execution and business drifts, etc. Individuals should have a far-reaching discussion and disclosure capability that can tap Data from massive amounts of Item advancement, and here CRISP-DM provides an operation that can be obtained to assist these needs. Through Data Mining Techniques, ERP Systems will facilitate the examination of a large amount of data from all sides to assess the existing business situation, to analyze the complexities, and to predict involved in critical consequences of further progress, through certainty if the analysis is carried out. The aftereffect of a Data Mining venture under the CRSIP-DM teaching method isn’t simply Designs yet furthermore findings that are considerable in achieving the objectives of the company or that are considerable in giving rise to new inquiries, lines of approach, or effects. There will be various directions for future work and discovery, such as delineating more issue districts in ERP frameworks and illustrative properties with CRSIP-DM by investigating more informational indexes. Along these lines, it is expected that make mindfulness about CRISP-DM, and the effect of this cycle on ventures is required to be perceived.
Table 11.2 Shows key figures, dimensions, and characteristics of infocube.
| Dimension | Characteristics | Technical name | Data type | Length |
| Business Head (ZFI_ CASH1 | Business Head | ZBUSNHEAD | Char | 10 |
| Accounting Document No | 0AC_DOC_NO | Char | 10 | |
| Company Code | 0COMP_CODE | Char | 04 | |
| GL Account (ZFI_ CASH2) | G/L Account | 0GL_ACCOUNT | Char | 10 |
| Chart of Accounts | 0CHRT_ACCTS | Char | 04 | |
| Posting date in the Document | 0PSTING_DATE | Dats | 08 | |
| Customer (ZFI_ CASH3) | Customer Number | 0DEBITOR | Char | 10 |
| Account Number of Vendor | 0CREDITOR | Char | 10 | |
| Key Figure | Amount Without Unit | ZAMOUNT1 | Char | 09 |

Figure 11.13 Shows overall influence chart of relative dominance in clustering model.
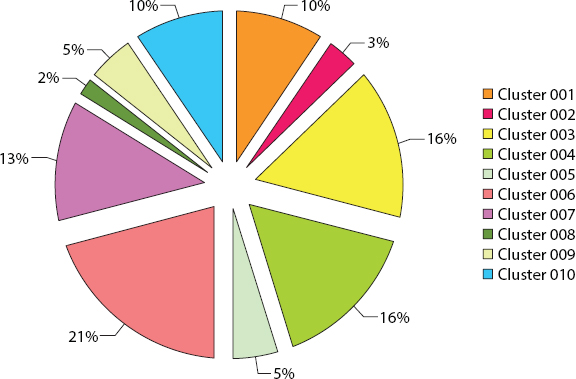
Figure 11.14 Overall influence chart of clustering model.
References
1. Marbán, O., Mariscal, G., Segovia, J., A Data Mining & Knowledge Discovery Process Model, in: Data Mining and Knowledge Discovery in Real Life Applications, Ponce, J. and Karahoca, A. (Eds.), pp. 438–453, February 2009.
2. Kurgan, L. and Musilek, P., A survey of Knowledge Discovery and Data Mining process models. Knowl. Eng Rev., 21, 1, 1–24, Cambridge University Press, New York, NY, USA, 2006, March 2006.
3. Azevedo, A. and Santos, M.F., KDD, SEMMA, and CRISP-DM: A parallel overview, in: Proceedings of the IADIS European Conference on Data Mining 2008, pp. pp 182–185, 2008.
4. Sastry, S.H. and Prasada Babu, M.S., ERP implementation for Manufacturing Enterprises. Int. J. Adv. Res. Comput. Sci. Software Eng. (IJARCSSE), 3, 4, 18–24, April 2013.
5. Chapman, P., Clinton, J., Kerber, R. et al., The CRISP-DM User Guide, 1999. https://s2.smu.edu/~mhd/8331f03/crisp.pdf
6. Chapman, P., Clinton, J., Kerber, R., Khabaza, T., Reinartz, T., Shearer, C., Wirth, R., CRISP-DM 1.0 Step-by-step data mining guide, CRISP-DM consortium: NCR Systems Engineering Copenhagen, USA and Denmark, DaimlerChrysler AG, Germany, SPSS Inc., USA and OHRA Verzekeringen en Bank Groep B.V, The Netherlands, 2000. https://www.kde.cs.uni-kassel.de/wp-content/uploads/lehre/ws2012-13/kdd/files/CRISPWP-0800.pdf
7. Sastry, S.H. and Prasada Babu, M.S., Cluster Analysis of Material Stock Data of Enterprises. Int. J. Comput. Inf. Syst. (IJCIS), 6, 6, 8–19, June 2013.
8. Kamber, H.M., Introduction to Data Mining, pp. 429–462, Morgan Kaufman Publishers: an imprint of Elsevier, Waltham, MA, USA, 2006.
9. Rokach, L. and Maimon, O., Data Mining and Knowledge Discovery Handbook, pp. 322–350, Springer, USA, 2010.
10. Sastry, S.H. and Prasada Babu, M.S., Performance evaluation of clustering Algorithms. Int. J. Comput. Sci. Inf. Technol., 1, 4, 95–109, 2013.
11. Tan, P.-N., Steinbach, M., Kumar, V., Introduction to Data Mining, pp. 330–340, Pearson Addison-Wesley, March 2006. https://www-users.cse.umn.edu/~kumar001/dmbook/index.php
12. Hand, D., Mannila, H., Smyth, P., Principles of Data Mining, pp. 292–305, Prentice Hall of India, 2001.
13. Sastry, S.H. and Prasada Babu, M.S., Analysis of Enterprise Material Procurement Leadtime using Techniques of Data Mining. Int. J. Adv. Res. Comput. Sci. (IJARCS), 4, 4, 288–301, April 2013.
14. Sahu, A.K., Sharma, S., Tanveer, M., Internet of Things attack detection using hybrid Deep Learning Model. Comput. Commun., 176, 146–154, 2021. https://doi.org/10.1016/j.comcom.2021.05.024.
15. Dunham, M.H., Data Mining: Introductory and Advanced Topics, pp. 135–162, Prentice Hall of India, 2003. http://index-of.co.uk/Data-Mining/Dunham%20-%20Data%20Mining.pdf
16. Shmueli, G., Patel, N.R., Bruce, P.C., Data Mining for Business Intelligence, pp. 220–237, John Wiley & Sons, 2007. https://onlinelibrary.wiley.com/doi/abs/10.1111/j.1751-5823.2007.00015_9.x
17. Pyle, D., Data Preparation for Data Mining, pp. 100–132, Morgan Kaufmann Publishers, San Francisco, USA, 1999.
18. Boudaillier, E., Interactive Interpretation of Hierarchical Clustering. Principles of Data Mining and Knowledge Discovery: Proceedings of First European Symposium, PKDD’97, Trondheim, Norway, June 24–27, 1997, pp. 280–288.
19. Ester, M., Kriegel, H.-P., Sander, J., Xiaowei, X., A Density-Based Algorithm for Discovering Clusters in Large Spatial Databases with Noise, in: Proc. of 2nd International Conference on Knowledge Discovery and Data Mining (KDD ‘96), AAAI Press, 1996.
20. Fayyad, U., Piatetsky-Shapiro, G., Smyth, P., From Data Mining to Knowledge Discovery in Databases. AI Mag., 17, 37–54, 1996b.
21. Kurgan, L.A. and Musilek, P., A survey of Knowledge Discovery and Data Mining process models. Knowl. Eng. Rev., 21, 1, 1–24, 2006.
22. Sastry, S.H. and Prasada Babu, M.S., Implementing a successful Business Intelligence framework for Enterprises. J. Global Res. Comput. Sci. (JGRCS), 4, 3, 55–59, April 2013.
23. Jain, S., Mahmood, Md. R., Raja, R., Laxmi, K.R., Gupta, A., Multi-Label Classification for Images with Labels for Image Annotation. SAMRIDDHI: A Journal of Physical Sciences, Engineering and Technology, 12, Special Issue (3), 183–188, 2020.
24. Grabmeier, J. and Rudolph, A., Data Mining and Knowledge Discovery, in: Techniques of Clustering Algorithms in Data Mining, vol. 6, pp. 303–360, Springer, 1996. https://link.springer.com/article/10.1023/A%3A1016308404627
25. Shtub, A., Enterprise Resource Planning (ERP): The dynamics of operations management, Kluwer Academic, Boston, 2002.
- *Corresponding author: [email protected]