
7
Predictive Analytics in IT Service Management (ITSM)
Sharon Christa I.L.1* and Suma V.2
1Dept. of Computer Science & Engineer, Graphic Era University, Dehradun, India
2Dept. of Information Science & Engineer, Dayananda Sagar College of Engineer, Bengaluru, India
Abstract
Predictive analytics and applied machine learning techniques have taken a significant role in the state of the art in technology that make use of data mining techniques for knowledge extraction. It is observed that machine learning techniques perform and produce better results than what is achieved in hard computing techniques. Further, the IT service sector is a dominating component in the global market while machine learning techniques are most suitable to be applied in the areas of high uncertainty. Since client management and incident management aspects of IT service management are highly uncertain, integrating machine learning in IT service is a better choice as they can produce near accurate, robust results from uncertainty and partial truth. Services provided to the customers and efficiency of the service provider can be optimized in different ways using machine learning techniques. The different aspects of IT service sector and integration of machine learning techniques to enhance the productivity and quality of the deliverable using the machine learning techniques is presented in this chapter.
Keywords: Knowledge extraction, predictive analytics, machine learning, IT service, service maintenance
7.1 Introduction
Progression in technology has revolutionized the day to day activities of humans. Companies are embracing automation, artificial intelligence, Internet of Things, etc. Software systems are no longer used by experts but is embraced by common man in their day to day lives. Computing systems have a strong impact globally in varied domains and software systems are integrated to it directly or indirectly. According to the Institute of Electrical and Electronics Engineers (IEEE) Standard 610.12-990 [1] software is a condition or a capability needed by a user for problem solving/achieve a capability [1]. Therefore, the quality of software system depends on the stakeholders. The same is defined by Stephen H. Khan as an intangible concept that can be discussed, felt and judged from the customer’s perspective [2].
If the software system meets the expectations of the customer and works as per the requirement, software systems are said to be successful [3]. The software systems come with a set of services and service level agreement. IT service management (ITSM) is the activities that are performed by an organization to design, plan, deliver, operate and control services associated with the software system offered to customers [4].
But what are IT services? All the services provided by your IT team can be termed—IT services. For example, Firewall Services, Cyber-security Services, Data Backup & Restoration, etc.
An IT Service Team is responsible for end-to-end management of these services and can rely on ITSM software like Freshservice to effectively manage these services. ITSM has detailed steps that need to be followed when a service request comes up or an incident occurs [5]. Figure 7.1 specifies the process followed when a ticket is raised by the customer that is defined by ITSM.
Therefore, failure in meeting the SLA clauses and resolving the incidents on time has a negative impact on the business strategy of the service providers. The demand on the improvement of software as well as the associated techniques are constantly rising and so is the need to recognize its consistency [6].
An effective ITSM not only benefits the company by creating processes to address each of the IT organization’s most important functions, establishing what roles are required to deliver on each of those processes, clearly defining the responsibilities and participation of each role in the process but also establishes a process that supports the Service Catalog Management which establishes and maintains an up-to-date repository of all services that can be requested by the business and Knowledge Management process that maintain a knowledge base where they can document information and knowledge that is accrued through the delivery of IT services. This can be beneficial to the customers as well. The ITSM follows a process oriented approach which is reactive that can aid the organization in addressing incidents and performing manual operational tasks. This in turn can result in cost reduction. Further, the process provides consistent, standardized incident response service through a tracked ticketing system, structured service catalog and in turn better adherence to SLAs.
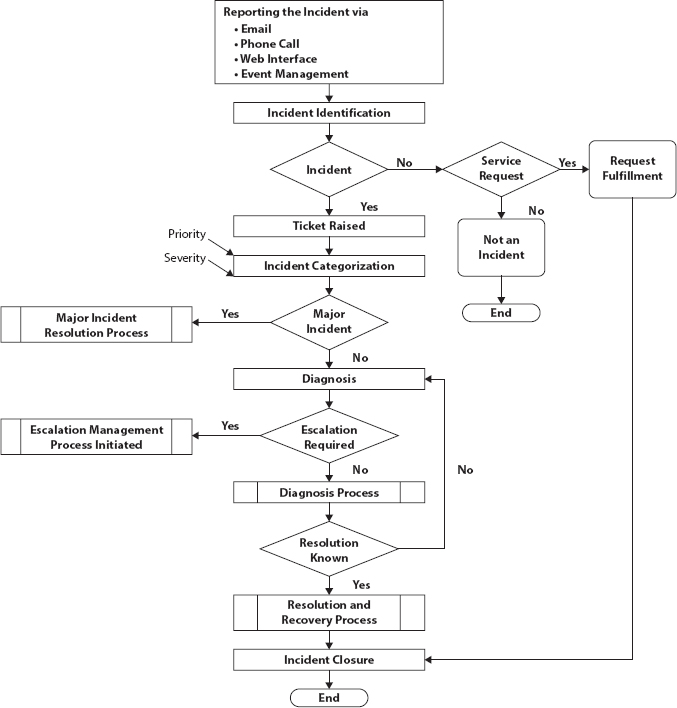
Figure 7.1 Process flow of incident and ticket.
The ITSM cannot be replaced or removed since service providers need to address the glitches in the services provided and should be addressed. The ITSM provides a framework to address the same. This can improve efficiency, control and governance over the various stakeholders and assets, collaboration and the most important customer satisfaction.
The significance of ITSM is undeniable and this chapter focuses on the aspects of predictive analytics that can impact the IT Service sector. Further, the chapter put forth a case study on ticket analytics based on the ticketing service offered as a part of ITSM [7].
7.2 Analytics: An Overview
Analytics is the process of deriving patterns from data. A systematic analysis and interpretation of existing data will in turn result in identifying the patterns in data. These can further be used in predicting the future events, risk analysis, process optimization, and overall improvement in business performance. While analysis of the data will give insights on what happened in the past and why it happened, analytics provide insights that can guide in decision making process. Analytics in fact is a multidisciplinary field involving mathematics, statistics, data modeling, computer programming, etc.
Data analytics is adopted in manufacturing sector to healthcare sector. The data related to downtime, work queue and run-time for various machines can be used by manufacturing companies to plan capacity management of machines. In the Six Sigma program, data analyzes the number of defects per million in a production line can be measured to derive its optimizing factor. Travel and hospitality on the other hand adopted data analytics for better turn around by collecting the customer data. Further, based on the insights on problems, steps can be taken to fix the same. Healthcare and retails industry generates a huge amount of structured and unstructured data. Healthcare data analytics can be used to predict the spread of diseases, care quality, diagnosis, etc. Further, the data can be used in detecting fraud insurance practices in the health care sector.
Retail industry on the other hand can identify the future trends, recommend products based on the trends, improve the supply chain accordingly and can increase the profit with an optimized data analytics. Another striking example of application of data analytics is in the gaming industry and content companies. User behavior data is used by game developers to maximize the gamer involvement, predict gaming bottlenecks, etc. whereas content analytics relies on the analysis of user behavior that predicts the engagement, clicks on various contents, etc. Adopting data analytics to the business model of an enterprise has manifold advantages like reduction in operating cost, optimizing performance, etc. Data can be used for analytics in order to identify the efficient ways of doing business, derive insights from customer trends and satisfaction and in turn better business decisions [8].
In order to perform data analytics, the primary step is to ask the right question like what are the insights the company is looking for or how the performance can be improved, etc. Once the goal is set, then the data requirements to answer the questions raised are to be identified along with the attributes that has to be considered. Further, the required data is collected through different sources. The data should be in an organized format in order to perform cleaning, duplication check, error detection, removing in- complete data, etc., and is then transferred for data analytics. A data analyst is responsible for deriving the conclusions based on the data presented to them. Data analytics can be broken down into four based on the value and difficulty and the question that it addresses. Figure 7.2 depicts the same in which Descriptive and Diagnostic analytics address what’s happening in the enterprise based on the Root Cause Analysis (RCA). Predictive and Perspective analytics give a foresight on what may happen and how it can be made to happen [9].

Figure 7.2 Process flow of incident and ticket.
7.2.1 Predictive Analytics
This chapter focuses on predictive analytics in IT Service Management and it is customary to give a brief on what is the whole idea. Predictive analytics is the amalgamation of a variety of statistical techniques like data mining, data modeling, machine learning, artificial intelligence, etc. A predictive model is developed using these techniques that captures the trends in the historical data. The model will be able to answer what can happen in the future using the real time data with a higher probability. The outcome is that, optimal decisions can be taken with the knowledge of the future and the desired outcomes; nothing but decision making [10]. Predictions are so hard to get right, so why exactly is it adopted by enterprises worldwide? Predictive analytics can identify which customers were likely to churn, which are the loyal customers, etc. and a coffee shop in New York could cut down 38% of the marketing cost by predicting exactly the same. A 10% increase in revenue was achieved by Rue La La by price optimization. A public service agency in the U.S. avoided budget overruns, predict consumer demand and could adapt to market changes based on models developed using historic data, demand study, market research, etc. [8].
To start with, identification of the anticipated result or outcome will be the first step towards embracing predictive analytics in the business model. What has to be achieved? In the case of the public service agency in the U.S., how to avoid budget overruns will be the right question. To answer the questions raised, what data is present? And with the data what can be done? Are to be addressed first. Further, exploratory data analysis is performed to that summarizes the data and gives an overview of the basic characteristics of the data. The outcome of EDA can help in the hypothesis generation, identifying the outliers and so on [11]. These steps were performed to get an overall understanding of the problem and the hypothesis. With a precisely defined problem statement and hypothesis, statistical model/AI based model or ML model can be developed using the historic data collected. The same is validated with the help of real time data to further calibrate the model. Various models can be developed that will best correlate with the historic data. The model is deployed to guide with the decision making process that can answer the questions. Poor design/validation of the models, poor decision making can result in more of negative impact than the anticipated outcome [12]. So how can IT Service Management gain from predictive analytics is presented in Section 7.3.
7.3 Significance of Predictive Analytics in ITSM
ITSM as mentioned in Section 7.1 is highly driven data. The ticketing system is used by IT service providers to address the service requests and other service related aspects. The service request effort estimation and incident resolution work-flow is depicted in Figure 7.3 and the overall incident management and ticket addressing process is depicted in Figure 7.7. The data generated as a result of these existing process is enormous. The data can be structured or unstructured. To give an overview, Table 7.1 gives the number of tickets raised by 24 different accounts due to the occurrence of an incident/service request, etc. and the number of tickets resolved on the same day. The data is provided by one of the world’s top most service providers subjected to Non-Disclosure Agreement. An average of 1, 11,000 tickets were raised per day as per the data from 2016. With the adoption of technology, this number will be on a rise.
How can ITSM benefit from predictive analytics? Ticketing is a day to day process in ITSM and Ticket Analytics can be used to draw comparisons like Resolution time by Technology, Ticket Volumes by Technology, Resolution time by Industry Domain, Ticket Volumes by Industry Domains, Account wise Tickets resolved the same day, RCA, etc. The advantage of the same is that based on the analysis, the source of maximum tickets can be identified and it can be addressed, which type of tickets have high resolution time can be identified and addressed. Predictive maintenance can be scheduled based on the identification of the root causes for incidents [13]. The insights like which industry domains will have major chunk of tickets can be mapped to the type of expertise required for the resolution and the amount of manpower. The time of arrival of tickets in different time zones and its severity and priority can also be mapped to the amount of manpower required for ticket resolution [14].
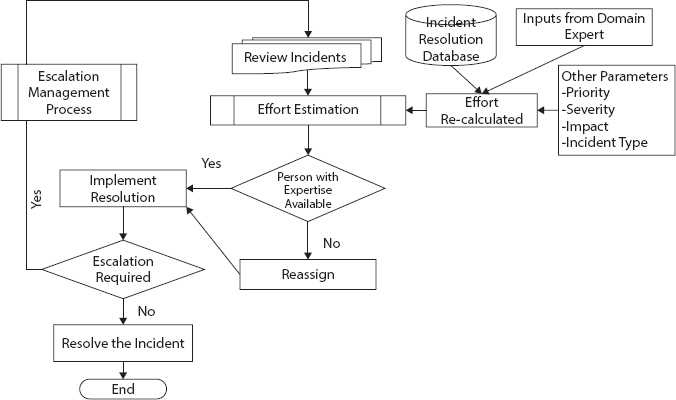
Figure 7.3 Service request effort estimation and incident resolution workflow.
Table 7.1 Number of tickets raised by 24 accounts/day and closed tickets/day: data from a leading service provider.
| Account | Resolved same day | Total tickets |
| 1 | 6,552 | 14,364 |
| I2 | 5,436 | 8,316 |
| 3 | 3,632 | 36,100 |
| 4 | 2,603 | 2,696 |
| 5 | 2,532 | 7,672 |
| 6 | 2,390 | 5,251 |
| 7 | 1,610 | 6,452 |
| 8 | 1,423 | 3,208 |
| 9 | 1,383 | 3,598 |
| 10 | 1,197 | 2,522 |
| 11 | 713 | 909 |
| 12 | 331 | 3,232 |
| 13 | 273 | 3,266 |
| 14 | 273 | 1,287 |
| 15 | 254 | 2,412 |
| 16 | 250 | 2,172 |
| 17 | 220 | 396 |
| 18 | 191 | 460 |
| 19 | 158 | 3,244 |
| 20 | 65 | 2,618 |
| 21 | 29 | 1,174 |
| 22 | 16 | 60 |
| 23 | 3 | 23 |
| 24 | 1 | 180 |
| Total | 31,535 | 111,612 |
Figures 7.4 and 7.5 are the depiction of the analytics performed on the tickets. Priority of the raised tickets where the same is segregated based on days of the week is performed. The time of the day is considered further and tickets logged with the same priority on different hours of the day are segregated to give an insight into the ticket occurrence rate during business hours [15].
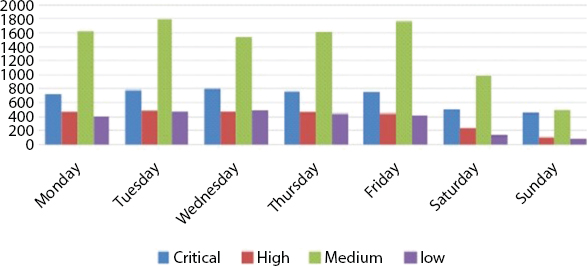
Figure 7.4 Ticket count vs. day of week based on priority of the tickets.

Figure 7.5 Ticket count vs time of the day in which it is logged based on priority of the tickets.
Statistical analysis on tickets raised due to the occurrence of an incident is performed and Figure 7.6 depicts the result obtained. The number of tickets logged under different industry domains of each client of the IT Service industry is the first level of analysis performed and Figure 7.6 shows the result [16].
These are some of the sample analyses performed as a part of ticket analytics in the ITSM arena. So Ticket Analytics provides insight into ticket details and identifies potential root cause. Addressing the root cause brings down the incidents’ volume and improves productivity. Reduced ticket volume and reduction in ticket resolution time is equal to improved client satisfaction. Further, delivery team gets insight to potential problem areas and can take proactive actions. An overall comparative analysis of productivity and ticket resolution time across accounts, industries, technologies, service areas will help in establishing performance baseline. This can improve day to day practices by addressing systemic issues. Furthermore, precision in capacity modeling and better review of SLA commitments are achieved. Higher accuracy in resolution, better insights into ticket arrival patterns and resolution time are all added advantages.
These can be beneficial to the enterprise since the ticket analytics have more to offer than the current practices like identification of the root causes through automated process, standardized productivity metrics, easy identification of tickets that can be moved to self-service and scope for automation. It will be easier to identify the accounts that need improvement and accounts that are giving good results. Also repetitive incidents can be identified and can be eliminated. As a fore-note the ticket analytics benefits reaped by two different clients are presented further.

Figure 7.6 Industry domain by ticket volume.
Client 1
The questions raised by Client 1 was, “What will be the type of tickets that can be expected in the next 6 months and what will be the root cause of the majority of the tickets?” The insights from the ticket analytics performed on the tickets raised by the users of the services offered by Client 1 are as follows:
- five applications are responsible for the 54% of overall incidents
- In a 6-month period, three jobs failed more than 120 times
- The root cause of 137 failures in a single application is due to memory issue
- Data issue is the root cause of 60 failures in another application
Based on the insights corrective actions/decision were taken by the clients and was implemented. Issues in the areas of memory and data issues were addressed and preventive maintenance was performed. As a result, 25 applications moved to zero incident count and more productive work could be performed by the effort saved from avoiding these incidents. Issues in the areas of memory and data issues were addressed and preventive maintenance was performed.
Client 2
The questions raised by Client 2 were, what is the current volume of tickets under different areas and what caused the incidents?
The insights from the ticket analytics performed on the tickets raised by the users of the services offered by Client 2 are as follows:
- Higher than usual volume of ticket is generated by application under a specific area
- One of the major root causes for the occurrence on an incident is access related issues
Based on the insights corrective actions/decision were taken by the clients and were implemented. Application under the specific area was subjected to thorough code re-factoring and testing to address the recurring issues. Access control procedures were further reviewed and a reduction of 5 and 2% of total incidents were achieved respectively. Also resource optimization was performed that leads to a total savings of $4000/month.
Since, these models developed learning and modify as per the real time trends and data, remodeling and refitting of the data are not required. The insights can be based on the present data. Also automating the process can aid in acquiring the required insights from the model as and when it is required. Therefore, predictive analytics can completely reshape the way enterprise reporting is happening.
7.4 Ticket Analytics: A Case Study
An enterprise handling accounts in the Healthcare sector need insight on reducing the effort required to close a ticket raised due to an incident as a part of service maintenance. Based on the requirement, machine learning based predictive model that can predict required effort for each category of the ticket is modeled. The questions addressed are 1) How can effort be reduced while resolving an incident? and 2) Can effort required to resolve each category of incidents be predicted?
To answer the questions, the data is collected in the form of tickets and each recorded ticket has different fields and the format of a sample ticket is depicted in Figure 7.7. The collected tickets as a raw data are depicted in Figure 7.8.
Figures 7.8 and 7.9 depict the entire methodology followed for this case study.

Figure 7.7 Sample ticket format.
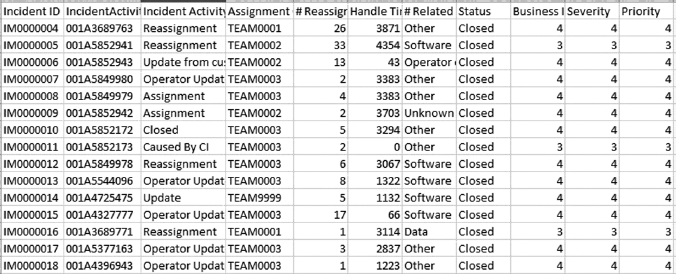
Figure 7.8 Raw data collected from organization.
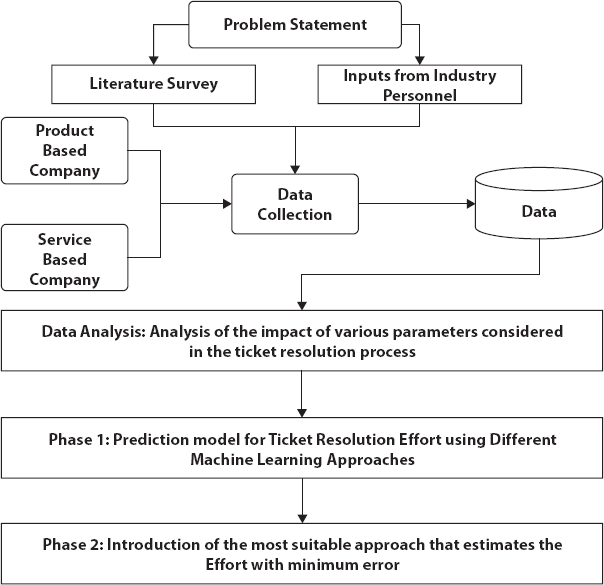
Figure 7.9 Research methodology to develop effort prediction model.
7.4.1 Input Parameters
As per EDA, the L2 and L3 severity and L2 and L3 priority tickets have more average TTR compared to high and low priority tickets, altogether, and the volume of tickets logged during weekdays from 8 AM to 6 PM is more. Therefore, further in this research, L2 and L3 level severity and priority tickets logged on weekdays from 8 AM to 6 PM will be considered. Insights obtained from related research and the opinions from expert reviews are considered further for the selection of input parameters for the modeling of prediction of effort required in resolving different incidents. Based on the preliminary analysis, the following input parameters are identified in the developing the predictive model for incident closure effort.
- Application: An overall of tickets logged under seven applications are considered that comes under custom and packaged product technologies.
- Priority: In this research priority levels 2 and 3 are considered.
- Severity: Tickets with severity levels 2 and 3 are considered in this research
- SLA Compliance: Both tickets that met and could not meet the SLA clauses are considered.
- Primary Technology: Five different primary technologies are considered.
- Root Cause: Six different root causes are present in the tickets that are used in the modeling.
- Complexity: Tickets with four levels of complexity were present in the ticket logs.
- No. of reassignments: The number of reassignments required to resolve an incident and close the associated tickets depends on the ticket type and the associated data is considered as such.
- Risk Assessment: tickets with Medium and High level risk factors are considered in the research.
7.4.2 Predictive Modeling
Effort prediction models for the tickets raised are modeled using random forest tree based algorithm. The same is presented further in this chapter. Further, analysis of the model is based on the result obtained.
7.4.3 Random Forest Model
Random Forest is a tree based ensemble model. Multiple trees are grown as per the training set data. Each tree is grown based on a subset of variables and a subset of data points. The process of growing the trees are called tree bagging. Its main advantage is that it overcomes over fitting of the model and change in the dataset has little effect on the outcome. Average of the trees when adopted in prediction will decrease the noise. Further, optimization is achieved using cross validation that estimates the level of fit. The algorithm for random forest is as follows:
Given a training dataset X = x1, x2, x3, ..., xn and the response be Y = y1, y2, y3, ..., yn.
- Initialize B which is a random value and the number of times bagging should be repeated
- For b = 1, 2, ..., B:
- – Sample the dataset with replacement, training data-set from X, Y. Xb, Yb be the sampled subsets of X and Y respectively.
- – Grow a regression tree fb on Xb, Yb
Prediction on test dataset x’ is a function f(x’) which is

A total of 500 decision trees are randomly modeled using the training dataset. The development of the model is performed using the random Forest package meant for the classification and regression based on a forest of trees using random inputs. The Breiman and Cutler’s Random Forests for Classification and Regression package [17] provides a randomForest() function that is used to build the model using training dataset and is further used in the prediction of incident resolution effort in the test dataset. Error measures like MAPE, MSE, RMSE and MAE tests are performed in order to validate the same.
The actual and the predicted effort by the developed models, for the training and test dataset are represented in Figures 7.10 and 7.11 for regression tree and random forest respectively.

Figure 7.10 Effort values predicted vs. observed using training and test dataset.
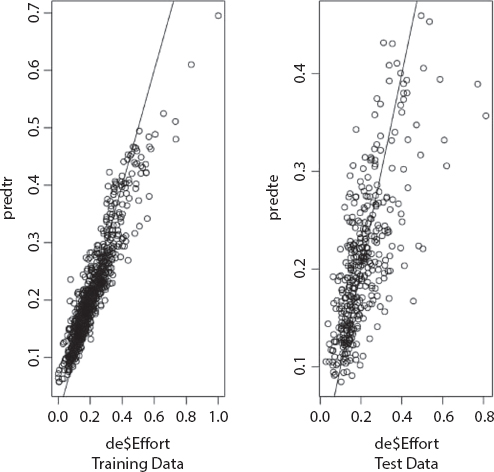
Figure 7.11 Effort values predicted vs. observed using training and test dataset.
Table 7.2 Overfitness, testing error and accuracy of the random forest model.
| Model | Over fitting | Accuracy | Testing error |
| Random Forest | 0.3475 | 0.88 | 0.3228 |
7.4.4 Performance of the Predictive Model
The tabulated results presented in Table 7.2 shows that the decision tree based predictive model can predict the effort required in resolving an incident with an accuracy of 88%. The overfittings value is less while considering random forest algorithm. But a general property of random forest is its inability to predict accurately in the presence of data values that are not present in the dataset. Therefore, this general property of random forest model makes it unsuitable for considering it as a predictive model for incident resolution effort. In such a situation, alternate approaches has to be adopted. Other machine learning based models can be developed in the similar way and its performance can be compared. Analyze the features that is required and whether it is suitable for the problem under consideration need to be addressed. An optimum model that will give more accurate result with the minimum error need to be deployed for predictive analytics and effort prediction.
7.5 Conclusion
All the services provided by your IT team can be termed—IT services and ITSM is a framework that has detailed steps that need to be followed when a service request comes up or an incident occurs. The data generated in the ITSM process is not friendly enough to easily produce metrics and reports. Adopting of predictive analytics can help in dealing with these issues. Increased speed of execution, cost reductions, improved customer experience, reduced human error, increased task adaptability, self-service are some of the advantages that predictive analytics offer enterprises when adopted with ITSM. Day to day operation in ITSM can further result in TTR effort pre-diction, root cause analysis, predicting occurrence of maintenance activity, track and manage the performance of IT assets efficiently, automated solutions, proactive prevention of tasks, automatic classification of incidents and service requests, predict SLA/contract violations, workload optimization, etc. This chapter further presents a case study on Ticket Analytics. The effort required to resolve an incident is predicted using Random Forest-based machine learning model. The process adopted is presented as a case study and why Random Forest model is not suitable is also presented. In such cases what can be the alternate approach that has to be adopted is also presented.
References
1. Radatz, J., Geraci, A., Katki, F., IEEE standard glossary of software engineering terminology. IEEE Std, 610121990, 121990, 3, 1990.
2. Kan, S.H., Metrics and Models in Software Quality Engineering, 2nd ed., Addison-Wesley Longman Publishing Co., Inc., Boston, MA, USA, 2002.
3. Sharma, J. and Rawani, A., From customers’ requirements to customers satisfaction—quality function deployment in service sector. Int. J. Product. Qual. Manage., 5, 4, 428–439, 2010.
4. IT Service Management (ITSM) software 2018 global market growth, opportunities and analysis, forecast to 2025, https://marketersmedia.com/it-service-management-itsm-software-2018-global-market-growth-opportunities-and-analysis-forecast-to-2025/292458. Accessed: 2018 [4] 12-31.
5. Sun, Y., Xu, Z., Zhang, T., On-board predictive maintenance with machine learning. Tech. Rep., SAE Technical Paper, WCX SAE World Congress, 2019.
6. Barafort, B., Betry, V., Cortina, S., Picard, M., Renault, A., St-Jean, M., Valdés, O., Luxembourg, ITSM Process Assessment Supporting ITIL (TIPA), Van Haren Publishing, Luxembourg, 2009.
7. Christa, S. and Suma, V., Analysis of ticket severity: A case study, in: 2017 International Conference on Innovative Mechanisms for Industry Applications (ICIMIA), pp. 763–765, 2017.
8. Kubiak, P., Rass, S., Pinzger, M., IT-application behaviour analysis: Predicting critical system states on Openstack using monitoring performance data and log files. In Proceedings of the 15th International Conference on Software Technologies (ICSOFT 2020), SCITEPRESS – Science and Technology Publications, Lda, pp. 589–596, 2020.
9. Hechler, E., Oberhofer, M., Schaeck, T., AI and change management, in: Deploying AI in the Enterprise, pp. 235–252, Springer, Germany, 2020.
10. Allamanis, M., Barr, E.T., Devanbu, P., Sutton, C., A survey of machine learning for big code and naturalness. ACM Comput. Surv. (CSUR), 51, 4, 81, 2018.
11. dos Santos Messejana, J.D., Predictive analysis of incidents based on software deployments, Masters Dissertation, Department of Information Science and Technology, ISCTE - Lisbon University Institute, Lisboa, Portugal, August 2019.
12. Virata, A.J.A. and Niguidula, J.D., Mining it job-order services: Basis for policy formulation & it resource allocation, in: International Conference on Big Data Technologies and Applications, Springer, pp. 97–106, 2017.
13. Gupta, R., Prasad, K.H., Mohania, M., Automating ITSM incident management process, in: 2008 International Conference on Autonomic Computing, IEEE, pp. 141–150, 2008.
14. Christa, S., Madhusudhan, V., Suma, V., Rao, J.J., Software maintenance: From the perspective of effort and cost requirement, in: Proceedings of the International Conference on Data Engineering and Communication Technology, Springer, pp. 759–768, 2017.
15. Christa, S. and Suma, V., An analysis on the significance of ticket analytics and defect analysis from software quality perspective, in: Inventive Computation Technologies (ICICT), International Conference on, vol. 1, IEEE, pp. 1–5, 2016.
16. Christa, S. and Suma, V., Significance of ticket analytics in effective software maintenance: Awareness, in: Proceedings of the ACM Symposium on Women in Research 2016, ACM, pp. 126–130, 2016.
17. Breiman, L., Cutler, A., Liaw, A., Wiener, M., Breiman and Cutler’s random forests for classification and regression package ‘randomforest’. Version 4.6-14, Software available at: http://stat-www.berkeley.edu/users/breiman/RandomForests, 2012.
- *Corresponding author: [email protected]