
14
New Algorithms and Technologies for Data Mining
Padma Bonde1, Latika Pinjarkar2*, Korhan Cengiz3, Aditi Shukla4 and Maguluri Sudeep Joel5
1CSE, SSTC, Bhilai, India
2Shri Shankaracharya Technical Campus SSGI Bhilai, India
3Department of Electrical-Electronics Engineering, Edirne, Turkey
4Guru Ghasidas Vishwavidyala (A Central University) Bilaspur CG, Bhilai, India
5Sreyas Institute of Engineering and Technology, Hyderabad, India
Abstract
Information mining alludes to the disclosure and extraction of examples and information from enormous informational collections of organized and unstructured information. Information mining procedures have been around for a long time, notwithstanding continuous development with ML (Machine Learning). Computer performance, including computational computing, has made knowledge mining techniques easier to update with extensive information collections and business-driven undertakings. Developing ubiquity of information mining in the business investigation and showcasing is likewise because of the expansion of Big Data and Cloud Computing. Massive circulated information bases and strategies for similar preparation of information, for example, MapReduce, make immense volumes of information reasonable and valuable for organizations and the scholarly world. Thus, the expense of putting away and overseeing information is decreased by cloud specialist organizations (CSPs) which compromise a paymore only by way of costs arise ideal towards getting to interconnected workers, stockpiling limits (plate drives), GPUs (Graphics Processing Unit), and disseminated data sets. Thus, organizations can store, measure, and break down more information showing signs of improvement in business experiences.
Without anyone else, cutting-edge information mining strategies are ground-breaking in numerous classes of assignments. Some of them are inconsistency discovery, grouping, characterization, affiliation rule learning, relapse, and rundown. Every one of these errands assumes a critical part in whatever setting one may consider. For instance, abnormality discovery procedures assist organizations with securing against network interruption and information penetrate. In essence, regression models become effective in predicting market trends, sales, and charges. Bunching methods are among the most significant value in collecting enormous amounts of information on reliable objects that provide examples, situations both within and between them, despite prior knowledge on any legislation that administers beliefs. Because these models reflect, knowledge mining can position knowledge in the management of organizations and systems overall.
Data mining is now one of the real systems in data science with an emerging mechanical impact in the last several years. Without any probability, the data mining research would pursue and sometimes even improve over its upcoming years. All through this research, developers’ scribbling their vision of changes to come from data mining. Starting with the unique sense of “data mining,” we focus on issues which — as we would like to think — would also establish learnings in data mining.
Keywords: Future patterns, knowledge discovery, data mining, learning algorithm
14.1 Introduction
Throughout the 21st century, entities are used to a massive extent in the regular community in numerous developments. Every single day, entities use big data analytics and this data is in multiple areas. It could be as records, maybe visual setups, a recording, maybe a document (fluctuating cluster) while the data is presented in the different sorts such that the best available moves can be developed. Not only to analyze this evidence but also to make a good selection and follow relevant information. The user wants the relevant data, it should be retrieved from the data source and decided on a good alternative. Such a method is called data mining or Knowledge Hub or simply KDD (Knowledge Discovery Process). There is also a tremendous amount of knowledge, but we are merely prepared to give it valuable records/knowledge for market dynamics. It takes a massive amount of data to generate data. It may be different setups, such as sound/video, numbers, text, statistics, hypertext designs. Again for the exploitation of data, the retrieval of data is, in essence, inadequate, it involves a device for the scheduled analysis of data, the retrieval of the pit of data discarded, & the distribution of samples in original information [1].
Through vast quantities of data collected in papers, data sets, and various databases, it is essential to promote flexible tools for analyzing and recognizing specific data and analyzing useful information that could gain rapidly. The best response to all the above is ‘Data Mining.’ Data analysis is the processing of confidential, knowledgeable data from broad predetermined standards; this is an incredible innovation with an incredible community to enable organizations with the procurement of its most valuable data in their database server [2−4].
Data mining arrangements anticipate future patterns and activities, inspire organizations to implement constructive information-driven decisions. The mechanized, upcoming studies provided by data mining have pushed past reviews of various examinations, offering the proposed devices a specific option of incredibly expressive networks. Information mining techniques will resolve investigations that were usually too time-consuming to evaluate. We prepare sets of data for the discovery of secret instances, also for the detection of observant data, specialists can neglect the fact that it is beyond their expectations [5].
Data mining, known as Knowledge Discovery in Databases ( KDD), is a non-trivial retrieval of evidence, previously unrecognized and essential data from data sources. It is a way of defining the embedded data/instance of the vaults.
AI & measurable calculation are two regular information mining calculations. The first is to utilize computerized reasoning innovation to naturally locate the necessary examples and boundaries in preparing and learning many example sets. The second is to utilize discriminant and likelihood examination, grouping, and relationship investigation to do tasks. Various calculations have diverse relating objectives and zones. These calculations can be free and they can be joined with one another for their utilization. Counterfeit neural organization strategy in AI calculation has a broad scope of uses, has a decent capacity to manage information, and self-sorting out learning capacity, yet can precisely distinguish, which is helpful for the grouping of issue information handling. Displaying can be utilized to work. Models are more assorted and various needs can be met. From the general perspective, the model of this strategy has higher exactness, better power, and more grounded elucidating capacity. It need not bother with the help of specialists for application, yet additionally has a few weaknesses. It is essential to prepare information. Additional time is spent, information is not insightful to comprehend, and there are constraints of versatility and receptiveness. AI is an approach to improve execution consequently by utilizing gathered information. The forerunner of the AI technique is the measurable learning and improvement hypothesis. It was brought into the world with the development of the PC. Up to now, numerous calculations have been proposed for various controls and various issues. The delegate calculations incorporate Bayesian assessment, choice tree, and neural organization, uphold vector machine, k neighbor strategy, etc. It is an effective method to take care of information mining issues. Information mining is an interdisciplinary, application-situated idea. On the off chance that there is a lot of information gathering in enterprises and fields, for example, media communications, money, retail, and logical exploration, there are issues and needs of information mining [6, 7].
14.2 Machine Learning Algorithms
There will be countless estimates that can appear difficult as the details of the facts and figures are being spread around, and you are just supposed to know what they are doing where they are heading [8].
- First, is a set of rules related to knowledgeability?
- The second is sets of rules through their comparison in design or ability (such as collecting equivalent organisms).
Calculations Grouped by Learning Style
There are several other contexts in which a measurement could illustrate a problem that depends on its relationship to an activity or situation or something that we want to call data information. It is indeed prominent in AI and human-made thinking research articles to understand the teaching strategies that the estimation will take.
There are only a few simple cognitive processes or educational models that computation can have, and we are starting to discover them here with a few occurrences of measurements and issues the ways they fit.
One such quality laboratory or process of organizing Evaluated based is beneficial because it allows us to evaluate the roles of information examination and design prevention steps and choose a better-suited issue to produce the highest probable result [9].
14.3 Supervised Learning
Data information is called the production of data with a label or effect, e.g. spam/non-spam or an inventory value instantly. A framework is designed through some planning period in which it would be necessary to make assumptions and is modified when certain assumptions are not accurate. The security support continues until the deliverables meet a desirable level of precision in the planning details shown in Figure 14.1 [10].

Figure 14.1 Shows supervised learning algorithm.
14.4 Unsupervised Learning
Data is not labeled and has no established result. The framework is designed by assuming the frameworks that are currently in the data sets. This may be to delete the essential advice. It may be by a statistical loop that the amount is systematically minimized, or it could be that the data is ordered by proximity shown in Figure 14.2 [11].
14.5 Semi-Supervised Learning
Data information seems to be a combination of identified and unprocessed versions. There seems to be an optimal forecasting problem, but the system must acquire expertise in composing the data and the objectives shown in Figure 14.3.

Figure 14.2 Shows unsupervised learning algorithm.

Figure 14.3 Shows semi-supervised learning algorithm.
Review of Machine Learning Algorithms
While munching information towards appearance corporate choices, this is best commonly utilizing managed besides unaided knowledge strategies. An emotionally debated issue is semi-managed learning strategies in regions, such as picture order where massive datasets with not many named models [12].
Algorithm Grouped By Similarity
Measurements are being routinely collected based on their ability (how they qualify). Design, tree-based methods, and computational organization-motivated strategies.
It is a valuable technique used to collect, but it is not perfect. Also, some algorithms might easily match such various groups, such as learning image segmentation, which is both a simulated neuronal process and a case-based technique. In contrast, some categories have a similar structure that defines the problem and the category of measurements, such as regression and grouping [13].
Developers may operate with these circumstances through posting computations multiple times or by identifying a number that is qualitatively the “right” contest.
Throughout this section, we list many well-known Data frameworks compiled in the way we consider to become the most evolutionarily adaptive. The description is not detailed from either the activities or the estimates, but we believe it is an operator and will be helpful to think about the state of the property.
14.6 Regression Algorithms
Regression is concerned with demonstrating the link among both variables that are recursively developed using a quantity of the error in the method’s assumptions shown in Figure 14.4.
Multivariate approaches are a solid performer of observations and have been suggested that pre-selected for realistic AI. It can also be misleading in recognizing that we can use regression to relate to the particular complaint and evaluation category. Relapse is a loop [14].
14.7 Case-Based Algorithms
Occasion-based supervised learning remains a matter of preference for circumstances or instances of preparation of knowledge deemed essential or essential to the design shown in Figure 14.5.

Figure 14.4 Shows regression learning algorithm.

Figure 14.5 Shows instance-bases learning algorithm.
Those approaches periodically build necessary data for developed models and correlate additional knowledge with existing data are using a degree of similarity to find the best solution and make a prediction. Such example-based tactics are collectively known challengers physically carry all the strategies of prominence and memory-based practice. Zero is used for the portrayal of remote instances and the calculation of similarity used across incidents [15].
14.8 Regularization Algorithms
Enhancement to the following strategic approach (usually relapse strategies) that persecutes designs that rely solely on their complexity, favoring simpler designs that are also effectively summed up [16]. Recorded regularisation algorithms independently here, counting the fact that they are popular, ground-breaking, and essential modifications introduced to advanced methodologies in the most component shown in Figure 14.6.
14.9 Decision Tree Algorithms
Choice tree techniques create a model of decisions made in an accurate evaluation of the relevant data features. Choices fork in the decision tree until an expected decision has been made for data records [17]. Choice trees are planned for identification and relapse details. Choice trees are fast and accurate continuously and a large famous in AI shown in Figure 14.7.
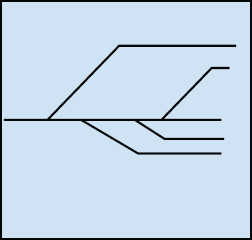
Figure 14.6 Shows regularization algorithm.
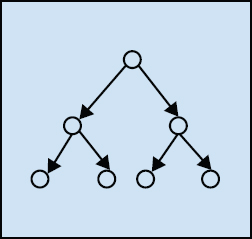
Figure 14.7 Shows decision-tree algorithm.
The most famous choice tree calculations are:
- CART(Classification and Regression Tree)
- ID3(Iterative Dichotomiser 3)
- C4.5 & C5.0
- CHAID(Chi-squared Automatic Interaction Detection)
- Decision Stump
- M5
- Conditional Decision Trees.
14.10 Bayesian Algorithms
Bayesian techniques explicitly apply Bayes’ Theorem for issues, such as characterization and relapse shown in Figure 14.8.

Figure 14.8 Shows bayesian algorithm.
The most famous Bayesian calculations are [18]:
- Naive Bayes
- Gaussian Naive Bayes
- Multinomial Naive Bayes
- AODE(Averaged One-Dependence Estimators)
- BBN(Bayesian Belief Network)
- BN(Bayesian Network).
14.11 Clustering Algorithms
Bunching, related to recurrence, shows the category of issues and the category of technologies.
Bunching algorithms are generally composed of display methods, e.g. centroid-based and hierarchical. All technologies are concerned overusing the relevant data’s characteristic structures to recognize the relevant data through the most intense accessed treasury collections shown in Figure 14.9.
The most mainstream bunching calculations are [19]:
- k-Means
- k-Medians
- EM (Expectation–Maximization)
- Hierarchical Clustering.
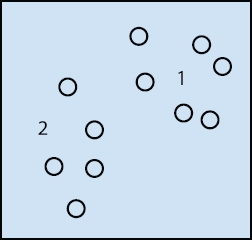
Figure 14.9 Shows clustering algorithm.
14.12 Association Rule Learning Algorithms
Association decides on different precepts for learning strategies that best illustrate the linkages among information factors [20]. Such recommendations can consider a meaningful and money-related beneficial relationship in massive, multifaceted databases that an organization can assault shown in Figure 14.10.
The most mainstream affiliation rule learning calculations are:
- Apriori calculation
- Eclat calculation.
14.13 Artificial Neural Network Algorithms
Counterfeit neural network models are concepts that stimulate the system and extra investment of natural neural organizations [21]. They are responsible for coordinating examples that are usually used for remission and clustering problems but are a massive site-field that includes so many computations and variations for all types of problems (Figure 14.11).

Figure 14.10 Shows association rule learning algorithm.

Figure 14.11 Shows artificial neural network algorithm.
The most famous counterfeit neural organization calculations are:
- Perceptron
- MLP(Multilayer Perceptrons)
- Back-Propagation
- Stochastic Gradient Descent
- Hopfield Network
- RBFN(Radial Basis Function Network).
14.14 Deep Learning Algorithms
Profound Learning Methods [22] are mostly a cutting-edge improvement to the Artificial Neural Networks that misuses plentiful respectable calculations. They are seriously concerned about constructing a bit larger and much more mind-boggling cognitive organizations. As noted above, methods are mainly concerned about enormous datasets of named simple information, for example, picture, text, sound, and video shown in Figure 14.12.
The most mainstream profound learning calculations are [23]:
- CNN(Convolutional Neural Network)
- RNNs(Recurrent Neural Networks)
- LSTMs(Long Short-Term Memory Networks)
- Stacked Auto-Encoders
- DBM(Deep Boltzmann Machine)
- DBN(Deep Belief Networks).

Figure 14.12 Shows deep learning algorithm.
14.15 Dimensionality Reduction Algorithms
Besides clustering methods, computational complexity reduces the search for and misappropriation of the intuitive design of the data, but for this circumstance in a solo manner or asks to summarize or illustrate information using fewer data [24]. This may be of value to visualize under-representation or disaggregate data that could then be used in controlled learning theory. A considerable lot of these techniques can be adjusted for use in arrangement and relapse shown in Figure 14.13.
- PCA (Principal Component Analysis)
- PCR (Principal Component Regression )
- PLSR (Partial Least Squares Regression)
- Sammon Mapping
- MDS (Multidimensional Scaling)
- Projection Pursuit
- LDA (Linear Discriminant Analysis)
- MDA (Mixture Discriminant Analysis)
- QDA (Quadratic Discriminant Analysis)
- FDA (Flexible Discriminant Analysis).
14.16 Ensemble Algorithms
Gathering techniques are designs made up of several more delicate designs that are easily ready and able and whose objectives are united here and there to make a particular prediction. Much effort is being put into helpless learners to participate and how they can be consolidated [25]. This seems to be an amazingly wonderful category of methodologies, and it is standard shown in Figure 14.14.

Figure 14.13 Shows dimensionality reduction algorithm.

Figure 14.14 Shows ensemble algorithm.
- Enhancement
- Bootstrapped clustering
- AdaBoost
- conventional system
- layered Generalization
- GBM (Gradient Boosting Machine)
- GBRT (Gradient Boosted Trees of Regression)
- Random Forests.
14.17 Other Machine Learning Algorithms
- Feature selection algorithms
- Algorithm precision assessment
- Performance measures
- Optimization calculations
- Computational intelligence
- CV(Computer Vision)
- NLP(Natural Language Processing)
- Recommender Systems
- Reinforcement Learning
- Graphical Models [26].
14.18 Data Mining Assignments
Data mining aims to identify permissible innovative, feasibly useful, and acceptable links and instances in available systems [27]. Data mining tasks can be shown either as predictive or descriptive. The Predictive Model predicts the estimation of information using realized results from different information, while the Descriptive Model recognizes examples or links in information. Compared to the perceptive model, an illuminating model is used to examine the inspected properties, not to predict new properties. Prescient model information Mining initiatives include the investigation of order, forecasting, relapse, and timing. The Descriptive Errand includes clustering, summaries, association rules, and sequence examination (Figure 14.15).
Among all the predictive analytics, identification is expected to be the strongest-perceived of all data mining is approaching. There are three main features in sorting undertakings.
- The learning process is handled
- The element required is a straight shot
- The design constructed can assign additional knowledge to one with several well-defined groups.
For example, provided groups of patients linked to clinical treatment reactions, the form of care to which each patient is expected to respond are recognized [28]. Unlike the model of characterization, the motive behind the analysis model is to determine the potential outcome related to present behavior. Its output can be a clear cut or a unique identifier. For example, given the prediction models of the Mastercard transactions, the likelihood that a specific transaction is wrong can be expected.
Another Analytical Model known as Factual Regression is a Controlled Learning Technique, which involves analyzing the dependency of specific performance characteristics on the approximation of various acronyms in a similar circumstance and developing a model capable of predicting these characteristics in new situations. For example, in the sense of the Mastercard Exchange Information Index, a method that can predict the likelihood of deception for new services can be created. Prediction programs including at least one previous-subordinate feature are referred to as time-arrangement issues.

Figure 14.15 Information mining assignments and models.
Time arrangement investigation typically involves numerical forecasting outcomes, such as the potential cost of individual stocks [29].
The second data mining approach is known as the Descriptive Technique. Expressive knowledge mining is usually used to create recurrence, cross-organization, and linkages. The enlightenment technique can be characterized by discovering interesting knowledge-related normalities, revealing examples, and discovering fascinating subgroups concerning the central part of the information [30]. In preparation, considers [31] used Descriptive to assess the effect of the section on individual elements. Rundown maps details in subsets of associated basic images [32]. Essential metrics, e.g. Mean, Standard Deviation, Variance, Mode, and Median, may be used as a Summary approach.
In Clustering, much knowledge is divided into many groups to gather items with comparative attributes. Bunching is best used to discover the gatherings of objects that are comparative. For example, provided an informative set of clients, subgroups of clients with similar purchase activity can be identified. Affiliations or Relation Analysis are used to find similarities between attributes and objects, e.g., the presence of one example implies another example. For example, how often one thing is identified with another in terms of circumstances and logical outcomes. This is regular in establishing a form of objective relation between the different related factors of the model. These relationships may be the relationship between ascribes within a similar information thing like (‘Out of the customers who bought milk, 64% also bought bread’) or the relationship between different information things like (‘very time a particular stock drops 5%, it triggers a resultant 13% in another stock somewhere in the range of 2 and a month and a half later’). Affiliation Rules are a well-known form of business bin checking, as all possible blends of conceivably fascinating item groupings can be investigated [33].
Consequently, the study of relations between items over an unknown timeframe is regularly referred to as a sequence analysis [34]. Succession Analysis is used to classify consecutive examples of knowledge. Examples in the dataset depend on the timing of the events, and they are like affiliation information. The relationship depends on the schedule and Market Basket inquiry. The goods are to be purchased simultaneously for Sequence Analysis.
14.19 Data Mining Models
There exist various approaches to sort out and investigate information. How to deal with select relies much upon our motivation and the type of information (organized versus unstructured). However, we can wind up with a specific setup of information that may be beneficial for one errand, however not very great for another. Subsequently, to make information usable, one ought to know about hypothetical models and approaches utilized in information mining and acknowledge possible compromises and traps in every one of them.
14.20 Non-Parametric & Parametric Models
The viewpoint on the data processing paradigm is whether or not it has borders. As far as limits are concerned, we get a judgment between parametric and non-parametric models. In the main type of models, we choose the ability that, in our opinion, is ideally suited to the planning details. For example, we can choose the straightforward capacity of the structure F (X) = q0 + q1 x1 + q2 x2 + q. + qp xp, in which x’s are the outlines of the details (e.g., house size, floor, different rooms), and q’s are the ambiguous limits of the model. These limits may be conceived of as amounts that specify the contribution of various gatherings (e.g., house size, floor size, number of rooms) to calculate capacity Y (e.g., house cost). The task of a functional form is then to explore limits Q using certain measurable methods, such as straight relapse or measured relapse.
The fundamentally best position of estimation methods is that they contain an ability for connexions between peaks in our knowledge. This allows parametric models an incredible heuristic, deriving, and anticipatory system. At the same time, whatever it might be, parametric models have a few entanglements. If the capacity we have chosen is overly simplistic, it may fail to explain the intricate details’ designs adequately. This problem, known as under-fitting, is continuously used in direct capacity with non-direct details. Again, suppose our ability is overly intricate (e.g., with polynomials). In that case, it may end up in overfitting, a situation in which our model responds to the disturbance of knowledge instead of the actual examples and is not generally applicable to new products shown in Figure 14.16.

Figure 14.16 Descriptions of under-fit, standard, and over-fit versions.
Non-parametric systems are exempt from all these concerns because they are not suspicious of the primitive sense of capability. In this manner, non-parametric models are appropriate for the management of unorganized data. Also, because non-parametric systems do not reduce the issue by evaluating a few limits, they require extensive databases to obtain an accurate assessment of power.
14.21 Flexible vs. Restrictive Methods
Data mining and ML designs can also differ in terms of versatility. As a rule, solution methods, such as direct relapse, are known to be deeply infeasible on the basis that they require ordered information and genuine reactions (Y) to function. However, this very aspect makes them ideal for deduction – the discovery of similarities among features (e.g., how the percentage of local crime impacts household costs). In the same way, prohibitive prototypes are subject to interpretation and simple. Even so, this definition is not valid for able to adapt models (e.g., non-parametric models). Since adaptable models do not doubt the form of ability that regulates cognition, they are minor subject to interpretation. In specific environments, however, the lack of usability is not an issue. For, e.g., when our solitary intrigue is a forecast of stock costs, we should not, in any way, worry about both the usability of the design.
14.22 Unsupervised vs. Supervised Learning
These days, we receive a ton of nearly administered and solo Machine Learning. New neural organizations dependent on these ideas remain to gain ground in picture &discourse acknowledgment or self-ruling driving consistently. A characteristic inquiry, however, is the contrast between unaided and directed learning draws near? The principle distinction is in the type of information utilized and strategies to investigate it. In a managed getting the hang of setting, we utilize marked information that comprises highlights/factors and ward factors (Y or reaction). This information is then taken care of to the learning calculation that looks for designs and a capacity that controls connections among autonomous and subordinate factors. The restored potential could then be related to the anticipation of high expectations. We are also watching a vector of highlights in unaided learning (e.g., house size, floor). That being said, the differentiation with active learning does not have any associated outcomes (Y). In this case, we cannot have any significant bearing on a straight relapse model since there is no reaction esteems to anticipate. Along these lines, in a solo setting, we are working visually impaired in some sense shown in Figures 14.17a and 14.17b.

Figure 14.17a Shows supervised learning.
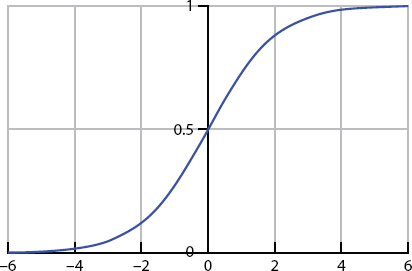
Figure 14.17b Shows sigmoid function.
14.23 Data Mining Methods
In this segment, we will portray specialized subtleties of a few information mining techniques. Our decision fell on direct relapse, grouping, and bunching strategies. Such strategies are amongst the best known in knowledge mining as they cover a wide range of activities involving assumption and anticipation. In comparison, such techniques thoroughly highlight the critical outlines of the data mining models mentioned above. For example, straight relapse and order (strategic relapse) are parametric, administered, and restrictive techniques, whereas clustering (k-implies) has a position with a subsection of non-parametrical methods unaided strategies [35].
Linear Machine Learning Regression
Simple regression is a technique for seeking a specific capability that intelligently resembles the relation between some of the objectives of the knowledge and the hierarchical parameter. It finds an enhanced capacity to speak to and clarify information. Contemporary advances in handling force and calculation techniques permit utilizing direct relapse in the mix with ML calculations to deliver snappy and effective capacity streamlining. In this segment, we will portray an execution of the direct relapse with slope plummet to create an algorithmic fitting of information to straight capacity.
Logistic Regression Classification
The command is a period of judgment on the class/categorization to whom the object has its location. Analysis methods using AI calculations have different applications varying from marketing emails to diagnostic techniques and suggested structures. Relating to specific regression, we are working on a grouping problem with a designated collection of preparations that integrates a few examples. However, expectations in the knowledge index map do not reflect a numerical reward, as it necessarily implies, but rather a simple reduction in value (e.g., class). For example, patients' clinical data may reflect on groups of patients: those with heart disease and those with a deadly illness. The activity to measure the order is to acquire the expertise to predict better what kind of illness (dangerous or amiable) a patient has. If there are only two groups, the problem is known as a dual classification. Alternatively, a multi-class structure may be used when we have more groups of knowledge.

Figure 14.18 Shows one-versus all or multi-class classification.
Proactive regression is one of the most well-known mechanisms of classification in health sciences and ML. Proactive regression focuses on the perceptron ability with a remarkable property: it maps every actual number to the (0,1) range. Therefore, it can be helpful to determine the probability (somewhere between the range of 0 and 1) that perception falls within a particular class. For example, a theoretical calculation. Six would mean a 60% likelihood that a patient’s malignant growth would be at risk if we defined the disease as 0 and harmful malignancy as 1. These properties make sigmoid ability useful for simultaneous depiction, but the multi-class structure is also imaginable shown in Figure 14.18.
Clustering Methods
As we have seen, grouping is an unaided strategy that is helpful when the information is not marked or if there is no reaction esteems (y) [36]. Bunching perceptions of an informational index include apportioning them into unmistakable gatherings, so perceptions inside each gathering are very like one another, while perceptions in the various gatherings share less for all intents and purpose. To delineate this technique, we should take a model from advertising. Accept that we have a significant volume of information about customers. This information may include middle family salary, occupation, good ways from the closest metropolitan territory, etc. This data might then be utilized for the market division. Our errand is to recognize different gatherings of clients without the earlier information on shared characteristics that may exist among them. Such division might be then utilized for fitting advertising efforts that target explicit bunches of shoppers.
There are various grouping strategies to do this; however, the most wellknown are k-mean bunching calculation and progressive bunching. This segment will portray the k-implies strategy, an exceptionally productive calculation covering a broad scope of utilization cases. In the k-implies bunching, we need to parcel perceptions into a pre-indicated number of groups. Even though setting various groups before bunching is viewed as a constraint of the k-implies calculation, it is a highly incredible procedure. In our grouping issue, we are given a preparation set of xi,...,x(m) shoppers with particular highlights xj. Highlights are vectors of factors that depict different properties of customers, for example, middle pay, age, sexual orientation, etc. The standard is that every perception (customer) ought to have a place with precisely one group and no perceptions ought to have a place with more than one bunch shown in Figure 18.19.
The concept behind the k-implies bundling is that a decent crew is the one for which even the internal bundle variation or the internal bundle of squares (WCSS) (difference) is insignificant. Buyers in a common category should interact more with each other for all purposes and purposes than with buyers from separate classes. Our involvement is to restrict WCSS computationally to all pre-indicated classes to achieve this design. This task shall be done in the corresponding state.
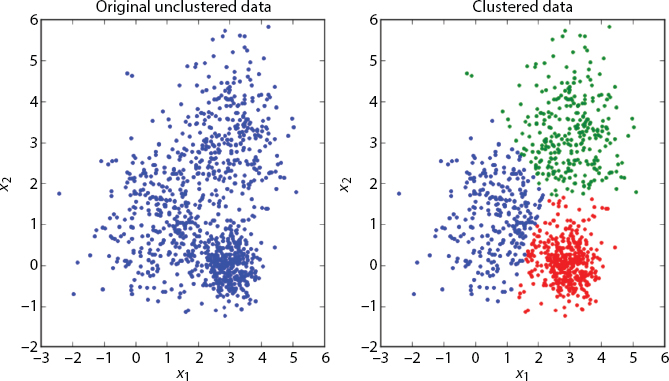
Figure 18.19 Shows illustration of clustering process.
14.24 Proposed Algorithm
14.24.1 Organization Formation Procedure
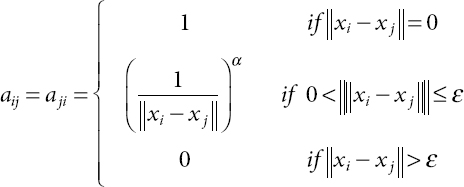
Initially, an unfocused and weighted organization with a related solitary section is worked for each class. In the existing system, Gl describes the fundamental class l ϵ{1,2, ..., L}. There would be an interface between an individual’s vertexes, on the off possibility that they are not necessarily a predetermined edge between both the element vectors of the Euclidean separation (ED). Even the relation should have been at odds with the heaviness of the component divergence. Therefore, the intensity border between some of the centers is conveyed as an equation.
In the built organization, all the hubs are inward associated under the rule of a contiguous grid. There is a d feature in any significant developments in the situation, and there should be a dimensional information package. The second feature of the I-th tuple properties referred to the knowledge object type mark. The motive behind AI is to plan from x to y, and this preparation is called a classification algorithm. Note that each class needs to have an organization association part, so the selection of boundaries of ε must mirror the circumstance. After the progression, we effectively develop our organization, which is additionally communicated in formula (14.2).
In the next span of the depiction cycle, the whole of the is first of the organizations will be addressed, analyzed, outlined in the subsequent parts.
Network Entropy Computing [37]
The Network Control Theories for the plan of distributed control method, the whole structure made up of various subsystems, each of which was decided by a particular regulator. For example, one possible implementation subsystem and communication between the regulatory diagrams, use the issue to schedule the regulator, conduct some regulation or limit control costs, and simultaneously consider these connectivity models. Organizational entropy is the entropy of a stochastic system connected to the constituent network [34, 36]. In this manner, we set out the definition of the stochastic system in formula (14.3).

With this severe technique, we can ascertain the organization utilizing the stochastic cycle of the extent of pij dynamic entropy portrays the change i → j. Furthermore, it is the fixed dispersion of π = πp. Combined optimizing of the presentation of the distributed data mining system are preparing an analyzed web-based learning measurement and drawing out its usual incentive. The best-suited combination arrangement could get online content grouping problem gives total data on characteristics and their classification ability is added to the accuracy and expense of the data. We describe the regret of the contrast between the absolute expected return best-expressed order scheme is given maximum information classification ability of accuracy and the expected absolute returns of each participant using the measurement. We render H(p) a complex abundance. Point by point of enrolment shall be defined as:
14.25 The Regret of Learning Phase
Throughout this segment, we define the lament as the exhibition proportion of the learning measure used by learners [38]. Simple to understand, it is a sorrow that has been decreased due to the mysterious structure elements. Researchers sincerely apologize for the student’s learning estimation has characterized the best for us. The article work for the stage is characterized as:

The information collected in the transmitted handling of many disseminated heterogeneous students with the precision of the grouping capability is ambiguous. Throughout this context, counting and service costs find it irrational to assume learners use the centralized information mining innovation to access the entire collected data. Will regulate first get acquainted with a classification algorithm for each view case using the labels. Most confident about the perceptions of each unidentifiable information classifier and then use the focus to create extra named information planning. By determining the various perspective on a similar data index, it is possible to find a correlation between specific types of information from a predetermined context. Some other linked specialized committee device is designed from the classification of the object. The portrait is shown in Figure 14.20.
The Validation & Decision Procedure
At last, we will characterize the fluffy classifier C that chooses what class the information thing has a place with. The plan to clarify the organization’s property to manage irregular changes, so the information thing does not have a place with a specific class will not influence the separate organization.
Consequently, the task order is the significance of class. The SVN calculation is a “delicate” grouping strategy in which the articles are allocated to the bunches with a level of conviction. In this way, an item can have more than one bunch with various degrees of conviction. It attempts to discover the component focuses in each bunch, named the group’s focal point, ascertaining each item’s enrolment in the bunch. The numerical articulation appears as follows.

Figure 14.20 The description of the learning phase.

Experimental Discussion and Simulation
To check the viability and possibility of our proposed technique, we lead mathematical and exploratory reenactment in this segment. Right off the bat, we present the test condition. Later, we present three reproductions to outline the productivity of the significant proposed level order technique when applied in genuine and counterfeit informational collections and contrast its outcomes and conventional order strategies.
Condition of the Experiment
The state of reenactment shall be set out in the corresponding conditions. Four physical devices (MacBook Pro) with 4 TB hard rings and 6 GB of RAM and a rehabilitation program are implemented on Windows Win7 level. The databases we have adopted change a lot. The following datasets are simply models: (1) Seeds Data Set; (2) UCI database; (3) Iris Information Index; (4) Cornell University database; (5) Harvard College database [38].
Reenactment of Harvard Datasets
The Harvard database contains three classes (Iris setosa, Iris versicolour, Iris virginica) and 150 times, where each class refers to a kind of plant. Figure 14.21 indicates our result, and we should conclude that our methodology is hearty. The different results are shown in Figures 14.22–14.24.

Figure 14.21 Harvard database result.

Figure 14.22 Sub-part result of Iris setosa.
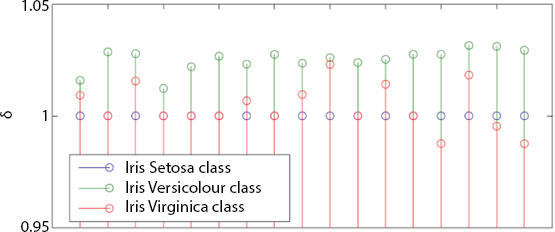

Figure 14.24 Sub-part result of Iris virginica.
14.26 Conclusion
Many enormous data technologies are also being built and discussed in the software engineering network, requiring online sorting and an example of recognition of enormous data pools obtained from component organizations, picture and video structures, online conversation phases, medical offices, and so on. However, as a complicated NP problem, data mining processes are facing many challenges. In this part of the progression.
Information mining models and strategies depicted in this paper permit information researchers to play out a wide cluster of errands, including surmising, forecast, and investigating. Direct relapse is impressive in the expectation of patterns and induction of connections between highlights. In its turn, a strategic relapse might be utilized in the programmed grouping of practices, cycles, and items, which makes it helpful in the business examination and inconsistency recognition. At last, grouping permits to make bits of knowledge about unlabeled information and derive concealed connections that may drive compelling business choices and critical decisions.
Throughout this Chapter, we propose an innovative explanation analysis and data order method for mining techniques and the release of information. We are receiving the organization to change the standard technologies. The outcome shows the viability of our work and we intend to accomplish more test investigation and numerical exploration and quickly checked on the different information mining patterns and applications from its initiation to the future. This audit puts the center around the hot and promising zones of information mining. Even though not many territories are named here in this paper, they are typically overlooked. This paper gives another view of a specialist concerning the utilization of information mining in colonial government assistance.
References
1. Introduction to Data Mining and Knowledge Discovery, Third Edition, Two Crows Corporation, Potomac, MD, U.S.A, 1999.
2. Larose, D.T., Discovering Knowledge in Data: An Introduction to Data Mining, John Wiley & Sons Inc., Hoboken, New Jersey, 2005.
3. Dunham, M.H. and Sridhar, S., Data Mining: Introductory and Advanced Topics, 1st Edition, Pearson Education, New Delhi, 2006.
4. Chapman, P., Clinton, J., Kerber, R., Khabaza, T., Reinartz, T., Shearer, C., Wirth, R., SPSS, CRISP-DM 1.0: Step-by-step data mining guide, NCR Systems Engineering Copenhagen (USA and Denmark), DaimlerChrysler AG (Germany), SPSS Inc. (USA) and OHRA Verzekeringenen Bank Group B.V (The Netherlands), SPSS, USA, 2000.
5. Pathak, S., Raja, R., Sharma, V., Ramya Laxmi, K., A Framework of ICT Implementation on Higher Educational Institution with Data Mining Approach. Eur. J. Eng. Res. Sci., 5, 2506–8016, 2019.
6. Camargo, A., Papadopoulou, D., Spyropoulou, Z., Vlachonasios, K., Doonan, J.H., Gay, A.P., Objective definition of rosette shape variation using a combined computer vision and data mining approach. PLoS One, 9, 5, e96889, 2014.
7. Samei, B., Li, H., Keshtkar, F., Rus, V., Graesser, A.C., Context-based speech act classification in intelligent tutoring systems, in: Intelligent Tutoring Systems, pp. 236–241, Springer International Publishing, Honolulu, HI, USA, 2014.
8. Samei, B., Li, H., Keshtkar, F., Rus, V., Graesser, A.C., Context-based speech act classification in intelligent tutoring systems, in: Intelligent Tutoring Systems, pp. 236–241, Springer International Publishing, Honolulu, HI, USA, 2014.
9. Valsamidis, S., Kazanidis, I., Kontogiannis, S., Karakos, A., A Proposed Methodology for E-Business Intelligence Measurement Using Data Mining Techniques, in: Proceedings of the 18th Panhellenic Conference on Informatics, ACM, pp. 1–6, 2014.
10. Shukla, D.P., Patel, S.B., Sen, A.K., A literature review in health informatics using data mining techniques. Int. J. Software Hardware Res. Eng. J., 2, 1–8, 2014.
11. Berry, M.J. and Linoff, G., Data mining techniques: For marketing, sales, and customer support, John Wiley & Sons Inc., The Hague, Netherlands, 1997.
12. Vaughan, L. and Chen, Y., Data mining from web search queries: A comparison of google trends and Baidu index. J. Assoc. Inf. Sci. Technol., 66, 1, 13–22, 2015.
13. Sonawane, N. and Nandwalkar, B., Time-Efficient Sentinel Data Mining using GPU. Int. J. Eng. Res. Technol., ESRSA Publications, 4, 02, pp. 10–17, February 2015.
14. Barrera, L.E., Montes-Servín, A.B., Ramírez-Tirado, L.A., Salinas-Parra, F., Bañales-Méndez, J.L., Sandoval-Ríos, M., Arrieta, Ó., Cytokine profile determined by data-mining analysis set into clusters of non-small-cell lung cancer patients according to prognosis. Ann. Oncol., 26, 2, 428–435, 2015.
15. Kao, J.-H., Chen, H.-I., Lai, F., Hsu, L.-M., Liaw, H.-T., Decision Tree Approach to Predict Lung Cancer the Data Mining Technology, in: Ubiquitous Computing Application and Wireless Sensor, pp. 273–282, Springer Netherlands, 2015.
16. Tiwari, L., Raja, R., Awasthi, V., Miri, R., Sinha, G.R., Alkinani, M.H., Polat, K., Detection of lung nodule and cancer using novel Mask-3 FCM and TWEDLNN algorithms. Measurement, 172, 19–38, 2021, 108882.
17. Moeyersoms, J., de Fortuny, E.J., Dejaeger, K., Baesens, B., Martens, D., Comprehensible software fault and effort prediction: A data mining approach. J. Syst. Software, 100, 80–90, 2015.
18. Fujimoto, M., Higuchi, T., Hosomi, K., Takada, M., Manchikanti, L., Pampati, V., Benyamin, R.M. et al., Association between Statin Use and Cancer: Data Mining of a Spontaneous Reporting Database and a Claims Database. Int. J. Med. Sci., 12, 3, 223–233, 2015.
19. Maucec, M., Singh, A.P., Bhattacharya, S., Yarus, J.M., Fulton, D.D., Orth, J.M., Multivariate Analysis and Data Mining of Well-Stimulation Data by Use of Classification-and-Regression Tree with Enhanced Interpretation and Prediction Capabilities. SPE Economics & Management Preprint, 2015.
20. Rohit Kumar, K. and Raja, R., Broadcasting the Transaction System by Using Blockchain Technology, in: Design Engineering, pp. 2115–21, June 2021. http://thedesignengineering.com/index.php/DE/article/view/1912.
21. Li, Y., Yang, Q., Lai, S., Li, B., A New Speculative Execution Algorithm Based on C4. 5 Decision Tree for Hadoop, in: Intelligent Computation in Big Data E.
22. Sathyadevan, S. and Nair, R.R., Comparative Analysis of Decision Tree Algorithms: ID3, C4. 5 and Random Forest, in: Computational Intelligence in Data Mining, vol. 1, pp. 549–562, Springer, India, 2015.
23. Zhang, S.J., Zheng, X.S., Wang, Q., Fan, Y.W., Ma, X.D., Hao, X.O., New satellite image associative classification algorithm based on Gabor texture, in: Remote Sensing and Smart City, vol. 64, p. 257, 2015.
24. Hussain, F. and Jeong, J., Efficient Deep Neural Network for Digital Image Compression Employing Rectified Linear Neurons. J. Sens., 2016, 10–25, 2015.
25. Sahu, A.K., Sharma, S., Tanveer, M., Internet of Things attack detection using hybrid Deep Learning Model. Comput. Commun., 176, 146–154, 2021, https://doi.org/10.1016/j.comcom.2021.05.024.
26. Gong, M., Su, L., Jia, M., Chen, W., Fuzzy clustering with a modified MRF energy function for change detection in synthetic aperture radar images. IEEE Trans. Fuzzy Syst., 22, 1, 98–109, 2014.
27. Wang, F., Xiong, Y., Weng, Z., Neural Network Modeling of Submarine Shell, in: Vibration Engineering and Technology of Machinery, pp. 1055–1064, Springer International Publishing, India, 2015.
28. Wang, H. and Wang, J., An effective image representation method using kernel classification, in: Tools with Artificial Intelligence (ICTAI), 2014 IEEE 26th International Conference on, November 2014, pp. 853–858.
29. Chen, P., Fu, X., Teng, S., Lin, S., Lu, J., Research on Micro-blog Sentiment Polarity Classification Based on SVM, in: Human-Centered Computing, pp. 392–404, Springer International Publishing, 2015.
30. Dellepiane, U. and Palagi, L., Using SVM to combine global heuristics for the Standard Quadratic Problem. Eur. J. Oper. Res., 241, 3, 596–605, 2015.
31. Sumit, S., High-performance EEG signal classification using classifiability and the Twin SVM. Appl. Soft Comput., 30, 305–318, 2015.
32. Zhang, T., Wu, S., Dong, J., Wei, J., Wang, K., Tang, H., Yang, X., Li, H., Quantitative and classification analysis of slag samples by laser-induced breakdown spectroscopy (LIBS) coupled with support vector machine (SVM) and partial least square (PLS) methods. J. Anal. At. Spectrom., 1, 1–5, 2015.
33. Ghougassian, P.G. and Manousiouthakis, V., Minimum entropy generation for isothermal endothermic/exothermic reactor networks. AIChE J., 61, 1, 103–117, 2015.
34. Bindzus, N., Cargnoni, F., Gatti, C., Richter, B., Jensen, T.R., Takata, M., Iversen, B.B., Mapping the complete bonding network in KBH 4 using the combined power of powder diffraction and maximum entropy method. Comput. Theor. Chem., 1053, 245–253, 2015.
35. D.C. Frost and S.F. Bryant, Probe Packet Discovery of Entropy Value Causing Specific Paths to be Taken Through a Network. U.S. Patent 20,150,003,255, 2015) January 1.
36. Wright, P., Parker, M.C., Lord, A., Minimum- and Maximum-Entropy Routing and Spectrum Assignment for Flexgrid Elastic Optical Networking [Invited]. J. Opt. Commun. Networking, 7, 1, A66–A72, 2015.
37. Yu, D. and Deng, L., Computational Network, in: Automatic Speech Recognition, pp. 267–298, Springer, London, 2015.
38. Pathak, S., Bhatt, P., Raja, R., Sharma, V., Weka VS Rapid Miner: Models Comparison in Higher Education with these Two Tools of Data. SAMRIDDHI, 12, Special Issue 3, pp. 85–88, 2020.
- *Corresponding author: [email protected]