
15
Classification of EEG Signals for Detection of Epileptic Seizure Using Restricted Boltzmann Machine Classifier
Sudesh Kumar, Rekh Ram Janghel* and Satya Prakash Sahu
National Institute of Technology, Raipur, India
Abstract
Epilepsy is a disease that is an electrophysiological disorder related to the brain and is characterized by various types of recurrent seizures. Electroencephalogram (EEG) is a test that is developed by various neurologists to capture the electrical signals that occur in the brain and is widely used for the Analysis and detection of epileptic seizures. As we know that it is tough to identify the various types of electrical activities by visual inspection; thus, it opens up the vast research in the field of biomedical engineering to develop a system and various algorithms for the identification of these activities and changes in the human brain. Therefore an automated seizure detection system is needed for the classification of epileptic seizures. We handled the EEG dataset of CHB-MIT (scalp EEG) to discover if our model could outflank the best in class proposed models. We have proposed a methodology based on the Restricted Boltzmann Machine (RBM) neural network model, which is used to perform classification over the EEG signals among binary classes, namely a healthy (non-seizure) and non-healthy (seizure) classes. The analysis is performed on an open accessible CHB-MIT data set. The model performance is assessed based on various performance metrices like accuracy, specificity and sensitivity. The test results accomplished in terms of accuracy, sensitivity, and specificity are 99.20%, 98.94%, and 98.89%, individually. The results outperformed the existing methods.
Keywords: Deep learning, restricted boltzmann machine, epilepsy, classification, electroencephalogram, seizure detection, contrastive divergence, Gibbs sampling
15.1 Introduction
Epilepsy is a common disorder which affects more than 40 million people worldwide, and affecting mostly people coming from developing countries like China, the U.S.A, India, etc. The research study of the World Health Organization shows that more than 2 million people are affected with epilepsy. Also, their study shows that at least 40% of the cases occur during childhood or adolescence [1]. Most of the people whose age is more than 65 years are also affected by the onset seizure of this disease. Study shows that the people who are affected by this disease are likely to die at an early age when compared with the normal people who do not have this disease. Hence, researchers have found that the study of epilepsy is a field that needs to be researched in biomedical studies.
Epilepsy is a disorder that occurs in the human brain, and it is characterized by various seizures which can affect various aged persons because it is a disease that normally occurs in any person. Recurrent convulsions occur effectively over a time period in the human brain when the seizure occurs. The episodes may vary as long as 1 s to as long as one year over a time period. Many think that epilepsy and the disorder that occurs due to seizures are the same, but this is not true as both are considered to be two different things [2]. One of the most important things, if one has to detect an epileptic seizure in the human brain, is that they have to be kept under constant monitoring, which usually requires a patient to take in-admission in the hospital. This is considered to be the most expensive thing, and it might take many days to detect the epileptic seizure in the human brain. The disadvantage is that when the patient is being screened for the seizure from the EEG records across the many days can become quite an unusual task. So, in these types of situations automated seizure detection system can become quite useful [3].
In addition to the modern-day seizure detection systems, early warning seizure systems have also become quite useful these modern days. Research studies show that there is growing awareness that this system has become a powerful tool in the detection of seizures in the brain [4]. Many researchers have proposed various types of machine learning and deep learning algorithms to elaborate the study of epilepsy in order to design such algorithms which can detect the epileptic seizure with high-performance metrics like accuracy, etc. [5]. Researchers have categorized the brain signals in five different waveforms, which can be seen in Table 15.1. The beta and the gamma waveforms are the waveforms in which an epileptic seizure is more likely to be found. Our study shows that the algorithm which we have proposed is quite unique as it is the first algorithm which is designed using Restricted Boltzmann Machine algorithms, which is a novel deep learning algorithm [6].
Our Chapter is set up in the accompanying manner. The literature review work that has been done in the past for epilepsy classification has been portrayed in Section 15.2. Section 15.3, depicts the proposed methodology, description of dataset, normalization and preprocessing of the dataset where all the training and testing evaluations that has been applied for epilepsy identification. All the experimental arrangements for training and testing data have been discussed in Section 15.4. Experimental results and discussion of the proposed work for epileptic seizure classification have been done in Sections 15.5 and 15.6. Section 15.7 represents the conclusion of work.
Table 15.1 Different waveforms present in the brain.
| Waveform | Range (Hz) | Preferred locality | Symptoms |
| Delta waveform | <4 | Visually in grown-ups, back in kids, high amplitude waves | Grown-up slow wave rest has been found during some constant consideration tasks |
| Theta waveform | 4–7 | Found in areas not identified with the in hand task | Higher in little youngsters, laziness in grownups and teenagers |
| Alpha waveform | 8–15 | Posterior regions of the brain, the two sides higher in amplitude on the dominant model | Loose/reflecting, shutting the eyes, related with restraint control, inhibitory action in various areas across the brain |
| Beta Waveform | 16–31 | The two sides, balanced appropriation, most obvious visually, low amplitude waves | Dynamic thinking, center, high ready, anxious |
| Gamma waveform | >32 | Part of your cerebrum that receives and processes sensory data from the whole body (Somatosensory cortex) | Shows during cross-modular sensory handling, appeared during short term memory coordinating of recognized items |
15.2 Related Work
Electroencephalogram (EEG) is a sort of procedure that examines or recognizes movement in cerebrum signals [7]. Artificial Neural Networks (ANNs) were first developed several decades ago by researchers attempting to develop the learning process of the human brain. Artificial Neural Networks (ANNs) are typically composed of interconnected “units” which denote the modeled neurons. Nigam and Graupe represented a novel approach for the classification of epileptic seizures from EEG signals in 2004 [8]. Kannathal et al. [9] compared different entropy estimators when applied to EEG data, and it has been proven that EEG data using ANFIS classifier have achieved an accuracy of up to 90%. Guo et al. [10] put forward a technique that uses Relative Wavelet Energy (RWE) for the Analysis of EEG signals which are then classified using ANNs; this method has achieved an accuracy of 95.20%. Homan et al. [11] proposed an Epileptic Seizure Prediction system based on Recurrent Neural Networks. Guler et al. [12] proposed an EEG signal classification system based on Recurrent Neural Networks using Lyapunov exponents, which have achieved an accuracy of up to 97.38%.
In 2017, Talathi [13] proposed an Epileptic Seizure classification method dependent on deep RNNs, which have accomplished an accuracy of up to 99%. Taking into account this paper, the author does right off the normalization of CHB-MIT dataset. This classification is useful for the medical procedure choice of epilepsy patients. The CHB-MIT Children’s Hospital Boston database [14] is used for feature extraction and characterization utilizing the DBNs models. They contrast on the aligned heartbeat. The performance is evaluated using specificity and sensitivity metrics Nowadays, when millions of data come into the clinical area for better accuracy, they use deep learning algorithms. Further, Pereira et al. [15] have done automatic segmentation of brain tumors with the help of the convolutional neural network. Acharya et al. [16] in 2017 proposed an application that detection automated infraction using EEG signal that given 92.50% accuracy. Acharya et al. have done a deep Convolutional neural network in EEG signals for detection of coronary artery disease and get an accuracy of 94.95%.
In 2018, Troung et al. [17] separated the features utilizing Short Term Fourier Transform (STFT) method, and four distinct features are extracted; and for performing classification, ConvNets classifier is utilized for the seizure detection and his proposed strategy accomplished an sensitivity of 81.2% while in year 2019 Ozcan et al. [18] extracted the statistical features and utilized convolutional neural network classifier for epilepsy classification and got a sensitivity of 87.01%. Numerous scientists have been focusing on the ConvNets classifier because of the more number of layers associated with this classifier, and in 2018, Zhou et al. [19] have extracted the features with time-domain signals utilized this classifier and recorded an accuracy if of 97.5%. Other than Convolutional neural network, researchers have likewise utilized recurrent neural networks (RNNs), DBNs, and auto-encoder in classifying epilepsy.
In 2018, Tsiouris et al. [20] utilized RNNs by extraction of features numerous methodologies have been proposed by various researchers. However a couple of researchers have accomplished the ideal outcome for the detecting and classifying an epileptic seizure.
The hybridization concept also plays a crucial role in detecting epileptic seizures as many researchers have proposed many deep learning hybrid algorithms. In 2019, Frieselbern et al. [22] proposed a hybrid algorithm that uses CNN and GRU (Gated Recurrent Unit) on time-domain signals and achieved a sensitivity of 89% and accuracy of 75.6%, while in 2019, Hisham et al. [23] achieved an accuracy of 99.6% by using CNN and LSTM (Long Short Term Memory) on extracting the features based on wavelet coefficients. In 2019, Xiaoyan et al. [24] have used CNN and LSTM and achieved an accuracy of 93.4%, sensitivity of 91.66%, and specificity of 86.13%. In 2019, Weixia et al. [25] have proposed his methodology and achieved an accuracy of 99%, and proved that his methodology outperformed all the existing methodology which was used in epilepsy seizure detection. In this paper, we have proposed a new type of deep learning algorithm called Restricted Boltzmann Machine, which is the first classifier used for the detection of an epileptic seizure.
15.3 Material and Methods
15.3.1 Dataset Description
The informational index used to assess the presence of our patient explicit locator comprises consistent Scalp EEG chronicles from 23 pediatric patients (age <18) experiencing medicine withdrawal for epilepsy medical procedure assessment at the Boston Children’s Hospital. The EEG was inspected at 256 Hz and recorded utilizing a 23-channel, 10–20 bipolar montage. As indicated by the 10–20 bipolar montage, EEG cathodes can be seen on the scalp as appeared in the physionet.org dataset. Generally, this 23 understanding informational index contained 844 h of persistently recorded EEG and 198 seizures [26].
Table 15.2 shown above describes the CHB-MIT dataset in which 23 pediatric patients of different age has been used for the study of epilepsy detection. The data shown above describe the age of the patient, the number of channels that were used for the recording of the seizure, the number of seizures that were detected during the various periods, and last but not least, the total time of the seizure (ictal) during the study of the particular patient.
Table 15.2 CHB-MIT patient wise description.
| Patient identifier number | Patient age | Patient sex | Number of channels | Number of seizures | Total seizure time (Minutes:Seconds) |
| 1 | 11 | Female | 23 | 8 | 7:10 |
| 2 | 11 | Male | 23 | 4 | 2:50 |
| 3 | 14 | Female | 23 | 8 | 5:40 |
| 4 | 22 | Male | 23 | 5 | 4:00 |
| 5 | 7 | Female | 23 | 5 | 9:00 |
| 6 | 1.5 | Female | 21 | 11 | 2:00 |
| 7 | 14.5 | Female | 21 | 4 | 5:10 |
| 8 | 3.5 | Male | 23 | 6 | 15:10 |
| 9 | 10 | Female | 21 | 5 | 4:00 |
| 10 | 3 | Male | 21 | 8 | 6:50 |
| 11 | 12 | Female | 23 | 4 | 13:20 |
| 12 | 2 | Female | 23 | 26 | 14:50 |
| 13 | 3 | Female | 18 | 13 | 8:10 |
| 14 | 9 | Male | 23 | 9 | 2:30 |
| 15 | 16 | Female | 22 | 21 | 27:20 |
| 16 | 7 | Female | 23 | 9 | 1:20 |
| 17 | 12 | Female | 23 | 4 | 4:40 |
| 18 | 18 | Female | 23 | 7 | 4:50 |
| 19 | 19 | Female | 23 | 4 | 3:40 |
| 20 | 6 | Female | 23 | 9 | 3:30 |
| 21 | 13 | Female | 23 | 5 | 3:10 |
| 22 | 9 | Female | 23 | 4 | 3:10 |
| 23 | 6 | Female | 21 | 8 | 6:40 |
On the other hand, we can set up the dataset while utilizing the subset of three classes as we have arranged the dataset utilizing ictal and inter-ictal classes. Also, we can prepare the dataset using ictal and pre-ictal classes. Table 15.3 shows the ictal, pre-ictal, and inter-ictal seizure data, which we have prepared for our methodology, but in order to detect epilepsy, we need to take only ictal and inter-ictal data [40].
15.3.2 Proposed Methodology
Figure 15.1 addresses the flow chart of our proposed methodology. The total working of the proposed conspired is partitioned into three sections. The raw EEG signal is gotten to from CHB-MIT database and is available online on physionet.org. First section deals with the normalization methodology over the raw EEG signals. After generating the normalized data, the forwarded into preprocess the data, which is done using PCA (Program Component Analysis). After the preprocessing, the data is split among two different sets i.e. training set and testing set where data is trained using 3-Layer of Restricted Boltzmann Machine, but before applying the RBM algorithm, we have used Contrastive Divergence and Gibbs Sampling to achieve better results. At third section these parameters are passed as input to the classifier which is chosen as Softmax to perform classification between a Non-seizure and Seizure signals.
Table 15.3 Ictal (Seizure), Inter-ictal (Normal), and Pre-ictal (Partial Seizure) subdivision.
| S. no. | Class | Time | Patients | Seizure records | Total segments |
| 1 | Seizure | 8 s | 23 | 198 | 1,200 |
| 2 | Normal | 8 s | 23 | 240 | 1,200 |
| 3 | Partial Seizure | 8 s | 23 | 248 | 1,200 |
15.3.3 Normalization
In this proposed technique, our dataset is having a few variables of big variance and some small variance. So essentially, standardization is utilized when information are considered as an random variable; normalizing implies changing to normal distribution. We apply z-score standardization as preprocessing the dataset. Normalization is applied for information preprocessing for learning mechanism. The principle objective of normalization is to enhance the values of numeric sections in the dataset without misjudging differences in the ranges of values [27]. Usually utilized or required just when features have various ranges. Standardization is a more extreme change. The equation which we have utilized for normalizing our dataset is represented as:
where Z z-score, x is the random variable, μ is referred as mean, and σ represents standard deviation.
15.3.4 Preprocessing Using PCA
The benefit of utilizing Principal Component Analysis (PCA) is that it can extract the valuable data which is required from the EEG dataset and to de-correlate the factors dependent on the extracted data. Perhaps the main properties of PCA is that the Principal Components (PCs) acquired are essentially the linear combinations of the original variables and the weight vector, which is additionally the eigenvector that fulfills the property of principal of least squares [28]. In this research work, we have utilized X as the input information matrix, whereas k is the number of variables that is 2,048, and t is the total observations i.e. 3,200. Allow us to consider the situation of ordinary PCA, which is discussed underneath:

Figure 15.1 Represents the flow chart of proposed methodology using three layers of RBM.

Figure 15.2 Flow diagram of PCA algorithm used in our proposed methodology.
- Suppose we have k original variables: s1, s2, ..., Sk.
- We need to produce k new variables: t1, t2, ..., tk.

such that: sk’s are uncorrelated (orthogonal)
s1 explains as much as possible of original variance in the data set
s2 explains as much as possible of the remaining variance etc.
By applying the above algorithm, PCA transforms the multivariate data into a new configuration dataset that is easier to interpret.
Figure 15.2 shows how our input data is transformed while applying the PCA algorithm for dimensionality reduction.
15.3.5 Restricted Boltzmann Machine (RBM)
RBM is an undirected variant that assumes an important role in Deep Belief Networks (DBNs). It characterizes a bunch of rules in the method, which is useful in dimensionality decrease, pattern recognition, regression, and collaborative filtering [29]. Rather than utilizing deterministic dispersion, RBM utilizes stochastic units of probability distribution represented in Section 15.3.1. RBM utilizes two different biases which make it not the same as auto-encoders:

Figure 15.3 Simple architecture of 3-Layer RBM.
- The hidden bias which helps in to reproduce the activation on the forward pass.
- The visible bias which helps in to reproduce the activation on the backward pass.
RBM is an external model that represents a two-layered network which is visible and hidden layer. Figure 15.3 shows the architecture of RBM, where each circle represents the neuron-like unit where calculation takes place. One of the most important features of RBM is that there is no communication between the internal layers which is there as a restriction in RBM model. Each node in this model performs stochastic decisions on whether to send that to the input or not. Low level features are taken by the visible layer for the data to be learned.
15.3.6 Stochastic Binary Units (Bernoulli Variables)
Stochastic Binary Units or we simply say Bernoulli variables are the units that have a state of 0s and 1s. The probability of turning on is determined by the weighted input from the other inputs (plus a bias) [30]. Let us suppose s be the stochastic unit variable, b be the bias, and w be the weights used, then the formula is given by:

The above formula is used to calculate the probability distribution when the input is in a state 0 or 1. Stochastic binary units utilize similar conditions which are used by logistic units, however they represent the output of the logistic as generating a spike in a brief timeframe.
Working Principle of RBM
As we all know that low level feature is being taken by the RBM in order to learn the data. Restricted Boltzmann Machine is a deep learning model that comprises of two layers, the first layer to a hidden layer and the second layer to be a hidden layer. Suppose x is the input layer at a particular node, and w is the weights that are fed into each input layer, and b is the bias used. Now to produce the node’s output, we use the formula given below:
where ‘a’ represents the output, and this proceeds for all other layers which are available in the network. In the instance of numerous hidden layers, the weights are changed until that layer is able to approximate the input from the previous layer [31]. Proper initial value of weights to later training and performing classification is one of the benefits of a Restricted Boltzmann machine (RBM).
In our proposed methodology, we have made an algorithm in which three layers of RBM are used, which is shown in Figure 15.1. Each output of the RBM layer becomes an input to the succeeding input layer of RBM, which are shown in the form of a hidden layer in the proposed methodology. The input layer is in which all the initial calculation of the weights is done and are fed into the hidden layer, and from there, new weights are calculated, and this process continues until all the hidden layers update their weights likewise in backpropagation network. Finally, the output is fetched from the last layer, which is present in the restricted Boltzmann machine network [32].
15.3.7 Training
The training of RBM is different than another neural network as this neural network works on the stochastic gradient descent method. There are two types of methods that are involved in training the data via restricted Boltzmann machine.
15.3.7.1 Gibbs Sampling
Gibbs Sampling is a Markov Chain Monte Carlo (MCMC) method used to get the observations in sequential from the multivariate probability distribution of information. It can also be used to approximate the joint probability distribution. Gibbs sampling generates the samples which are related to Markov Chains which are similar to the other samples which are generated.
Algorithm 15.1 described below shows how the Gibbs Sampling works on our proposed methodology. Gibbs Sampling is preferred for our methodology as it helps us to make accurate results while performing the training further [33].
15.3.7.2 Contrastive Divergence (CD)
Contrastive Uniqueness is a Monte Carlo Markov Chain (MCMC) gradient descent learning method especially appropriate for learning products of experts (PoE) and energy-based model parameters. A general algorithm for contrastive divergence is described below, which is used in our proposed methodology [34]. Although contrastive divergence algorithm is very tricky to solve, it provide better results than any other convergence algorithm, which is better for our proposed methodology. Algorithm 15.2 describes how the CD algorithm works on our dataset, which is used in our proposed methodology.
15.4 Experimental Framework
In this research work, we have employed different ratios for training and testing data split as 90–19, 80–20, and 70–30 Additionally, we make a tenfold cross validation approach. Firstly, the signals are divided into ten equal parts. Then to perform the signals in the training phase, nine parts are used. For the testing phase, one-tenth of the part is used which is used for validation of our proposed algorithm. This methodology was sustained up to 10 times by changing the testing and training dataset. It fills in as a convolutional backpropagation where batch is 11. Evaluation of the gradient of loss function contrary to the weights in backpropagation is employed during training phase. It results feedback for error signals in backward direction to the network. In training phase, it helps in updating the weights of the network. Batch size is utilized for getting various signals for training updations. Gibbs Sampling is performed during training stage, which is utilized to get the observation sequentially for the multivariate probability distribution of information. A Contrastive divergence an algorithm which is useful in giving better results while in the training phase of the algorithm. The whole dataset is tuned with multiple training and testing parameters so that results can be improved during the calculation of the various measures.
Table 15.4 Performance evaluation measures.
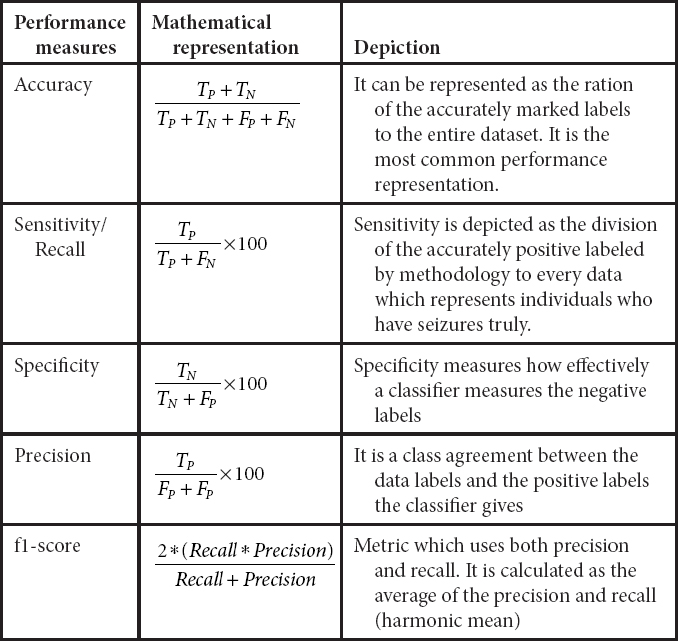
The software which is utilized for this methodology is Anaconda version 2019.10, in which python 3.6 is used as our programming language on Windows 8.1. Libraries like keras, tensorflow have been included for accomplishing better results. An 8-GB RAM Lenovo ThinkStation P330 is used as a hardware. To reduce the time operational ability, this workstation which requires 2 min for each epochs to run while contrasting it and the ordinary system, may requires 8 min for each epoch to execute. The entire methodology has been operated over 200 epochs to accomplish better performance result while contrasting to already proposed methodology. Different parameters have been tuned to get the best results; a representation of different performance metrics is represented in Table 15.4 [39]. The best outcome is resulted by setting the parameters as batch size 11, the size proportion as 80–20, and learning rate as 0.01, which gives us the higher results measures when contrasted with tuning other parameters of the model.
15.5 Experimental Results and Discussion
15.5.1 Performance Measurement Criteria
Following are the various performance measures which have been calculated:
15.5.2 Experimental Results
In order to achieve the best results for the detection of an epileptic seizure, we used various tuning parameters like learning rate, size ratio, batch size, etc. Various performance measures have been calculated, which are shown in the tables below.
Table 15.5 Performance metric when learning rate is set to 0.001.
| Batch size | Size ratio | Sensitivity | F1-score | Accuracy | Specificity | Precision |
| 2 | 90–10 | 95.23 | 94.87 | 94.87 | 95.25 | 94.97 |
| 4 | 90–10 | 94.97 | 94.81 | 94.81 | 95.21 | 94.23 |
| 6 | 90–10 | 95.23 | 94.92 | 94.92 | 95.67 | 95.01 |
| 8 | 90–10 | 95.21 | 94.91 | 94.91 | 95.61 | 94.90 |
| 10 | 90–10 | 95.14 | 94.67 | 94.67 | 95.21 | 94.28 |
| 11 | 90–10 | 92.23 | 92.87 | 92.87 | 93.25 | 93.97 |
| 2 | 80–20 | 91.19 | 92.12 | 92.12 | 92.12 | 92.09 |
| 4 | 80–20 | 92.97 | 92.81 | 92.81 | 93.21 | 92.23 |
| 6 | 80–20 | 93.23 | 92.92 | 92.92 | 92.67 | 93.01 |
| 8 | 80–20 | 93.21 | 93.91 | 92.91 | 93.61 | 92.90 |
| 10 | 80–20 | 92.14 | 93.67 | 93.67 | 92.21 | 92.28 |
| 11 | 80–20 | 96.34 | 95.47 | 95.47 | 95.28 | 95.12 |
| 2 | 70–30 | 95.12 | 94.47 | 94.47 | 94.12 | 93.16 |
| 4 | 70–30 | 95.23 | 94.92 | 94.92 | 95.01 | 95.01 |
| 6 | 70–30 | 92.34 | 90.69 | 90.69 | 91.23 | 91.98 |
| 8 | 70–30 | 92.56 | 90.94 | 90.94 | 91.35 | 92.01 |
| 10 | 70–30 | 92.45 | 90.91 | 90.91 | 91.30 | 91.98 |
| 11 | 70–30 | 93.21 | 91.21 | 91.21 | 92.27 | 92.30 |
Table 15.5 represents the various performance measures which is calculated with different tuning parameters but one of the parameter is kept constant which is the learning rate used. The best results are achieved with the tuning parameters when batch size was kept as 11, the training testing size ratio set as 80–20 and learning rate was fixed as 0.001. More results have been calculated with the learning rate of 0.01 and 0.1, which are shown in Tables 15.6 and 15.7, respectively. The best results among all the three learning rate is achieved with the learning rate of 0.01 which is shown in Table 15.6.
Table 15.6 Performance metric when learning rate is set to 0.01.
| Batch size | Size ratio | Sensitivity | F1 score | Accuracy | Specificity | Precision |
| 2 | 90–10 | 95.12 | 94.47 | 94.47 | 94.12 | 93.16 |
| 4 | 90–10 | 95.23 | 94.92 | 94.92 | 95.01 | 95.01 |
| 6 | 90–10 | 92.34 | 90.69 | 90.69 | 91.23 | 91.98 |
| 8 | 90–10 | 92.56 | 90.94 | 90.94 | 91.35 | 92.01 |
| 10 | 90–10 | 92.45 | 90.91 | 90.91 | 91.30 | 91.98 |
| 11 | 90–10 | 93.21 | 91.21 | 91.21 | 92.27 | 92.30 |
| 2 | 80–20 | 94.56 | 94.36 | 94.36 | 94.56 | 94.78 |
| 4 | 80–20 | 95.97 | 95.81 | 95.81 | 95.21 | 94.23 |
| 6 | 80–20 | 96.23 | 96.92 | 96.92 | 95.67 | 96.01 |
| 8 | 80–20 | 97.21 | 97.91 | 97.91 | 96.61 | 96.90 |
| 10 | 80–20 | 98.14 | 98.67 | 98.67 | 98.21 | 97.28 |
| 11 | 80–20 | 98.94 | 99.20 | 99.20 | 98.89 | 98.86 |
| 2 | 70–30 | 95.12 | 94.47 | 94.47 | 94.12 | 93.16 |
| 4 | 70–30 | 95.23 | 94.92 | 94.92 | 95.01 | 95.01 |
| 6 | 70–30 | 92.34 | 90.69 | 90.69 | 91.23 | 91.98 |
| 8 | 70–30 | 92.56 | 90.94 | 90.94 | 91.35 | 92.01 |
| 10 | 70–30 | 92.45 | 90.91 | 90.91 | 91.30 | 91.98 |
| 11 | 70–30 | 93.21 | 91.21 | 91.21 | 92.27 | 92.30 |
Table 15.7 Performance metrics when learning rate is set to 0.1.
| Batch size | Size ratio | Sensitivity | F1 score | Accuracy | Specificity | Precision |
| 2 | 90–10 | 93.23 | 92.87 | 92.87 | 92.25 | 92.97 |
| 4 | 90–10 | 92.97 | 92.81 | 92.81 | 92.21 | 92.23 |
| 6 | 90–10 | 92.23 | 92.92 | 92.92 | 92.67 | 92.01 |
| 8 | 90–10 | 92.21 | 92.91 | 92.91 | 92.61 | 92.90 |
| 10 | 90–10 | 93.14 | 93.67 | 92.67 | 93.21 | 93.28 |
| 11 | 90–10 | 92.23 | 92.87 | 92.87 | 93.25 | 93.97 |
| 2 | 80–20 | 92.21 | 92.45 | 92.45 | 92.89 | 92.19 |
| 4 | 80–20 | 92.97 | 92.81 | 92.81 | 93.21 | 92.23 |
| 6 | 80–20 | 93.27 | 92.92 | 92.92 | 92.67 | 93.01 |
| 8 | 80–20 | 93.21 | 93.91 | 92.91 | 93.61 | 92.90 |
| 10 | 80–20 | 92.14 | 93.67 | 93.67 | 92.21 | 92.28 |
| 11 | 80–20 | 91.34 | 91.47 | 91.47 | 91.28 | 91.12 |
| 2 | 70–30 | 91.12 | 91.47 | 91.47 | 91.12 | 91.16 |
| 4 | 70–30 | 91.23 | 91.92 | 91.92 | 91.01 | 91.01 |
| 6 | 70–30 | 92.34 | 90.69 | 90.69 | 91.23 | 91.98 |
| 8 | 70–30 | 92.56 | 90.94 | 90.94 | 91.35 | 92.01 |
| 10 | 70–30 | 92.45 | 90.91 | 90.91 | 91.30 | 91.98 |
| 11 | 70–30 | 93.21 | 91.21 | 91.21 | 92.27 | 92.30 |
15.6 Discussion
Restricted Boltzmann Machine is a methodology that is valuable in dimensionality reduction, regression, pattern classification, topic demonstration and collaborative filtering. Various researchers have extracted a large number of features from the EEG signals in the time domain and frequency domain in order to detect or predict epileptic seizures. Table 15.8 shows the various existing methods which have been proposed before this work. In 2018, Troung et al. [17] used the CNN classifier to achieve the sensitivity of 81.2% using Short Term Fourier Transform for the feature extraction. Various researchers have also proposed their methodology; in 2017, Khan et al. [36] proposed his technique dependent on wavelet transform coefficients and a ConvNet classifier that accomplished a sensitivity of 87.8%. In 2019, Xingua et al. [21] used a new classifier known as Bi-LSTM. They achieved 88.80 and 88.60% of sensitivity and specificity, while in the same year, Xiaoyan et al. [24] have used a hybrid method which used CNN and LSTM on the time domain signals and achieved an accuracy of 93%, sensitivity of 91.88% and specificity of 86.13%. But in 2018, Zhou et al. [19] forwarded his mechanism, which utilizes a ConvNet classifier and accomplished an accuracy of 97.5%, outperforming all the state-of-art methods. The methodology which is used by our paper uses Restricted Boltzmann Machine, which is the first algorithm used on the CHB-MIT dataset. The results achieved by our methodology that has an accuracy of 99.20%, a sensitivity of 98.94%, and a specificity of 98.89%, outperformed all the state-of-the-art methods which have been performed for epilepsy seizure detection. Figure 15.4 shows the comparison of the accuracy of the three learning rates by using 80–20 as the size ratio. Figure 15.5 shows the comparison of the sensitivity of the three learning rates by using 80–20 as the size ratio. Figure 15.6 shows the comparison of specificity of the three learning rates by using 80–20 as the size ratio.
Table 15.8 Comparative analysis of already proposed methodologies.
| Authors | Features | Classifier used | Performance metric |
| Thodoroff et al. [35] | Discrete wavelet transform coefficients | RCNN | Sens: 85% |
| Yusuf Khan et al. [36] | Discrete wavelet transform coefficient | ConvNets | Sens: 87.8% |
| Truong et al. [17] | Short Term Fourier Transform | ConvNets | Sens: 81.2% |
| Yoo, Ji-Hyun [26] | Frequency Domain Signals | RCNN | Sens: 90% |
| Rajamanickam et al. [37] | Discrete wavelet transform coefficients | ConvNets | Sens: 86.29% |
| Zhou et al. [19] | Time Domain Signals | ConvNets | Accu: 97.5% |
| Ozcan et al. [18] | Spectral power, Statistical moments | ConvNets | Sens: 87.01% |
| Xinghua et al. [21] | Time Domain Signals | Bi-LSTM | Sens: 88.80% Spec: 88.60% |
| Frieselbern et al. [22] | Time Domain Signals | CNN-GRU | Sens: 89% Accu: 75.6% |
| Xiaoyan et al. [24] | Time Domain Signals | CNN-LSTM | Acc: 93.4% Sens: 91.88% Spec: 86.13% |
| Wei Xia et al. [25] | Discrete wavelet transform coefficients | CNN-LSTM | Acc: 98.60% Spec: 98.54%, Sens: 84% |
| Choi et al. [38] | Short Term Fourier Transform | CNN-GRU | Sens: 89.4% |
| Proposed Method | Time Domain Signals | Restricted Boltzmann Machine | Acc: 99.20% Spec: 98.89%, Sens: 98.94% |
As the characteristics of seizure may vary over time, the algorithm for seizure detection is necessary. One of the great advantage for an expert to predict the seizure is through minimum feature extraction, which allows faster update so that the patients can benefit from the seizure prediction algorithm rather than detecting a seizure which requires a large amount of time. The methodology that we have proposed can be improved further by taking the huge amount of EEG data related to the time domain and frequency domain which contains epileptic seizures. This epileptic seizure can have distribution over time as one seizure can be as long as one year or 1 h. Figure 15.7 describes the details of the seizure which occurs at each hour for all the subjects combined for the CHB-MIT dataset. From the graph, we can see that the lowest number of seizures occurs around 9 p.m. while the highest number of seizures occurs around 7 a.m. in the morning.

Figure 15.4 Performance Metric Comparison (Accuracy) by using 80–20 as size ratio with learning rate 0.001, 0.01, and 0.1 used in our proposed methodology.

Figure 15.5 Performance Metric Comparison (Sensitivity) by using 80–20 as size ratio with learning rate 0.001, 0.01, and 0.1 used in our proposed methodology.

Figure 15.6 Performance Metric Comparison (Specificity) by using 80–20 as size ratio with learning rate 0.001, 0.01, and 0.1 used in our proposed methodology.

Figure 15.7 The seizure occurs during each hour for all the pediatric patients of CHB-MIT.
15.7 Conclusion
In this research work, we have dealt with the Restricted Boltzmann machine neural network architecture for spontaneous seizure detection utilizing EEG signals. Thinking about the best in class strategy, this model has an ability that learns better and done viably separates among seizure and normal EEG. We have played out all ratios of training and testing dataset and saw that when our model is getting the training data-set of lower extents, at that point it gives us lower accuracy when contrasted to the training dataset of higher ratios. The primary reason for lower accuracy is the lesser proportion of the training dataset. During learning phase, it naturally takes feature extraction and selection in this way; it needs more numbers for data for learning. We have performed binary class classification in our proposed system, and it acquired an average accuracy of 99.20%, specificity of 98.89%, and sensitivity of 98.94%, the proposed model has been inspected on an open accessible CHB-MIT EEG dataset and contrasted with various baseline methodologies. The outcomes decide the effectiveness and primacy of the proposed model in recognizing epileptic seizures. One more benefit of the proposed model is that it doesn’t need any feature extraction and selection mechanism. The performance of the proposed methodology can be enhanced by giving more amounts of data.
References
1. Satapathy, S.K., Dehuri, S., Jagadev, A.K., EEG signal classification using PSO trained RBF neural network for epilepsy identification. Inform. Med. Unlocked, 6, June 2016, 1–11, 2017.
2. Satapathy, S.K., Dehuri, S., Jagadev, A.K., ABC optimized RBF network for classification of EEG signal for epileptic seizure identification. Egypt. Inform. J., 18, 1, 55–66, 2017.
3. Kerr, M.P., The impact of epilepsy on patients’ lives. Acta Neurol. Scand., 126, S194, 1–9, 2012.
4. Zhou, W. and Gotman, J., Removal of EMG and ECG artifacts from EEC based on wavelet transform and ICA. Annu. Int. Conf. IEEE Eng. Med. Biol.—Proc., vol. 26 I, pp. 392–395, 2004.
5. Alickovic, E., Kevin, J., Subasi, A., Performance evaluation of empirical mode decomposition, discrete wavelet transform, and wavelet packed decomposition for automated epileptic seizure detection and prediction. Biomed. Signal Process. Control, 39, 94–102, 2018.
6. Kannathal, N., Min, L.C., Acharya, U.R., Sadasivan, P.K., Erratum: Entropies for detection of epilepsy in EEG. Comput. Methods Programs Biomed., 80, 187–194, 2005, Comput. Methods Programs Biomed., 81, 2, 193, 2006.
7. Tessy, E., Shanir P.P.M. and Manafuddin S., “Time domain analysis of epileptic EEG for seizure detection”, in: 2016 International Conference on Next Generation Intelligent Systems (ICNGIS), pp. 1–4, 2016.
8. Nigam, V.P. and Graupe, D., A neural-network-based detection of epilepsy. Neurol. Res., 26, 1, 55–60, 2004.
9. Kannathal, N., Choo, M.L., Acharya, U.R., Sadasivan, P.K., Entropies for detection of epilepsy in EEG. Comput. Methods Programs Biomed., 80, 3, 187–194, 2005.
10. Guo, L., Rivero, D., Seoane, J.A., Pazos, A., 18.Classification of EEG signals using relative wavelet energy and artificial neural networks, in: Proceedings of the First ACM/SIGEVO Summit on Genetic and Evolutionary Computation, pp. 177–184, 2009.
11. Petrosian, A. et al., Recurrent neural network-based prediction of epileptic seizures in intra-and extracranial EEG. Neurocomputing, 30, 1–4, 201–218, 2000.
12. Güler, N.F., Übeyli, E.D., Güler, I., Recurrent neural networks employing Lyapunov exponents for EEG signals classification. Expert Syst. Appl., 29, 3, 506–514, 2005.
13. Vidyaratne, L., Glandon, A., Alam, M. and Iftekharuddin, K.M., Deep recurrent neural network for seizure detection, in: 2016 International Joint Conference on Neural Networks (IJCNN), pp. 1202–1207, 2016.
14. Acharya, U.R., Fujita, H., Lih, O.S., Adam, M., Tan, J.H., Chua, C.K., Automated detection of coronary artery disease using different durations of ECG segments with convolutional neural network. Knowledge-Based Syst., 132, 62–71, 2017.
15. Pereira, S., Pinto, A., Alves, V., Silva, C.A., Brain tumor segmentation using convolutional neural networks in MRI images. IEEE Trans. Med. Imaging, 35, 5, 1240–1251, 2016.
16. Acharya, U.R., Fujita, H., Lih, O.S., Hagiwara, Y., Tan, J.H., Adam, M., Automated detection of arrhythmias using different intervals of tachycardia ECG segments with convolutional neural network. Inf. Sci. (NY), 405, 81–90, 2017.
17. Truong, N.D. et al., Convolutional neural networks for seizure prediction using intracranial and scalp electroencephalogram. Neural Networks, 105, 104–111, 2018.
18. Ozcan, A.R. and Erturk, S., Seizure Prediction in Scalp EEG Using 3D Convolutional Neural Networks with an Image-Based Approach. IEEE Trans. Neural Syst. Rehabil. Eng., 27, 11, 2284–2293, 2019.
19. Zhou, M. et al., Epileptic seizure detection based on EEG signals and CNN. Front. Neuroinf., 12, 95, 2018.
20. Tsiouris, Κ.Μ. et al., A Long Short-Term Memory deep learning network for the prediction of epileptic seizures using EEG signals. Comput. Biol. Med., 99, 24–37, 2018.
21. Yao, X., Cheng, Q., Zhang, G.-Q., Automated Classification of Seizures against Nonseizures: A Deep Learning Approach. arXiv preprint arXiv:1906.02745, 2019.
22. Freisleben, B., A Convolutional Gated Recurrent Neural Network for Epileptic Seizure Prediction. How AI Impacts Urban Living and Public Health: 17th International Conference, ICOST 2019, New York City, NY, USA, October 14–16, 2019, Proceedings. Vol. 11862, Springer Nature, 2019.
23. Daoud, H. and Bayoumi, M., Efficient Epileptic Seizure Prediction based on Deep Learning. IEEE Trans. Biomed. Circuits Syst., 13, 5, 804–813, 2019.
24. Wei, X. et al., Early prediction of epileptic seizures using a long-term recurrent convolutional network. J. Neurosci. Methods, 327, 108395, 2019.
25. Liang, W. et al., Scalp EEG epileptogenic zone recognition and localization based on long-term recurrent convolutional network. Neurocomputing, 396, 569–576, 2019.
26. Yoo, J.-H., Epileptic Seizure Detection for Multi-channel EEG with Recurrent Convolutional Neural Networks. J. IKEEE, 22, 4, 1175–1179, 2018.
27. Meng, L., Tan, A., Member, S., Wunsch, D.C., Adaptive Scaling of Cluster Boundaries for Large-Scale Social Media Data Clustering. IEEE Trans. Neural Netw. Learn. Syst., 27, 12, 2656–2669, 2016.
28. Alickovic, E., Kevin, J., Subasi, A., Performance evaluation of empirical mode decomposition, discrete wavelet transform, and wavelet packed decomposition for automated epileptic seizure detection and prediction. Biomed. Signal Process. Control, 39, 94–102, 2018.
29. Lu, N. et al., A deep learning scheme for motor imagery classification based on restricted Boltzmann machines. IEEE Trans. Neural Syst. Rehabil. Eng., 25, 6, 566–576, 2016.
30. Raja, R., Kumar, S., Rashid, Md., Color Object Detection Based Image Retrieval using ROI Segmentation with Multi-Feature Method. Wireless Pers. Commun. Springer J., 112, 1, 1–24, 2020, https://doi.org/10.1007/s11277-019-07021-6.
31. Tiwari, L., Raja, R., Awasthi, V., Miri, R., Sinha, G.R., Alkinani, M.H., Polat, K., Detection of lung nodule and cancer using novel Mask-3 FCM and TWEDLNN algorithms. Measurement, 172, 108882–108900, 2021, https://doi.org/10.1016/j.measurement.2020.108882.
32. Eslami, S.M.A. et al., The shape Boltzmann machine: A strong model of object shape. Int. J. Comput. Vision, 107, 2, 155–176, 2014.
33. Cueto, M.A., Morton, J., Sturmfels, B., Geometry of the restricted Boltzmann machine, in: Algebraic Methods in Statistics and Probability, vol. 516, pp. 135–153, 2010.
34. Salakhutdinov, R. and Hinton, G.F., Deep Boltzmann machines. Artificial Intelligence and Statistics, 2009.
35. Williams, C.K.I. and Agakov, F.V., An analysis of contrastive divergence learning in gaussian Boltzmann machines, Institute for Adaptive and Neural Computation, UK, 2002.
36. Thodoroff, P., Pineau, J., Lim, A., Learning robust features using deep learning for automatic seizure detection. Machine learning for healthcare conference, 2016.
37. Raja, R., Sinha, T.S., Dubey, R.P., Orientation Calculation of human Face Using Symbolic techniques and ANFIS. Int. J. Eng. Future Technol., 7, 7, 37–50, 2016.
38. Yuvaraj, R. et al., A deep Learning Scheme for Automatic Seizure Detection from Long-Term Scalp EEG. 2018 52nd Asilomar Conference on Signals, Systems, and Computers, IEEE, 2018.
39. Choi, G. et al., A Novel Multi-scale 3D CNN with Deep Neural Network for Epileptic Seizure Detection. 2019 IEEE International Conference on Consumer Electronics (ICCE), IEEE, 2019.
40. Vishwakarma, S.K., Sharma, P.C., Raja, R., Roy, V., Tomar, S., An Effective Cascaded Approach For EEG Artifacts Elimination. Int. J. Pharm. Res., 12, 4, 4822–4828.
- *Corresponding author: [email protected]