
7
Remote Evidence Collection
The preferred method for the acquisition of memory is through direct contact with the suspect system. This allows for adaptability by incident response analysts in the event that a tool or technique does not work. This method is also faster at obtaining the necessary files since it doesn’t depend on a stable network connection. Although this is the preferred method, there may be geographical constraints, especially with larger organizations where the incident response analysts are a plane ride away from the location containing the evidence.
In the case of remote acquisition, incident response analysts can leverage the same tools that are utilized in local acquisition. The one change is that incident response analysts are required to utilize remote technology to access the suspect systems and perform the capture. As with any method that is utilized, incident response analysts should ensure that they document any use of remote technology. This will allow for the proper identification of legitimate versus suspect connections later on.
In this chapter, we will cover the following main topics:
- Enterprise incident response challenges
- Endpoint detection and response
- Velociraptor overview and deployment
- Velociraptor scenarios
Enterprise incident response challenges
The previous chapter focused on acquiring evidence when an analyst or a responder has physical access to the system. The reality of the situation is that this is often not the case. Infrastructure moved to cloud services such as Amazon Web Services (AWS) or the move toward a remote workforce creates a situation where responders most likely will not have physical access to plug a USB device in and run their tools to acquire evidence.
Compounding this challenge is the need to get more actionable information much quicker than what traditional digital forensics can provide. For example, a traditional digital forensics methodology has analysts make a full image of an infected system, and capture the memory and other artifacts. These are then transferred to an analysis workstation and, over the course of hours or days, the analyst can obtain the necessary data. In situations where an incident may be localized or more detailed intrusion analysis needs to take place, this may be necessary. In other circumstances, this type of analysis methodology does not scale when looking at hundreds or even thousands of systems that may be impacted.
Moving away from this traditional digital forensics and investigation model is one that focuses on Live Triage. In this methodology, data is collected from systems that are suspected of being compromised. The focus here is on collecting high-value data in a central location where it can be indexed and analyzed. With the data in a central location, the analysts can then leverage tools and techniques to scale their investigation. Leveraging this technique will allow analysts to focus their efforts on systems with the greatest evidentiary value. It is on these systems that analysts can apply the full focus of digital forensics to gain the best understanding of the adversary and their behavior.
Endpoint detection and response
Ransomware has arguably been the one key threat that has changed how an incident response is conducted. The speed and widespread impact of such attacks has highlighted the need for tools that provide analysts with a method to search across the entire network infrastructure. This is where endpoint detection and response (EDR) tools come into the picture.
EDR tools grew out of the traditional signature-based antivirus that permeated the industry for nearly two decades. Building on the capability to match hash values and other signatures, EDR tools bring much-needed distributed capabilities to security and incident response teams. There are a variety of commercially available EDR platforms, each with distinctive features, but at a high level, they can generally perform the following functions:
- Monitor and detect threats on endpoints: This is where EDRs overlap with traditional antivirus. EDR platforms use a combination of signature matching, detection rules, and machine learning/AI to detect threats. This combination makes it possible for EDR platforms to detect behaviors that would otherwise appear legitimate to traditional antivirus. For example, adversaries often make use of legitimate system tools or binaries to conduct their attacks. For example, the post-exploitation tool Cobalt Strike will often use the legitimate Microsoft Windows regsvr32.exe binary to bypass Windows protection mechanisms and execute malicious code (https://attack.mitre.org/techniques/T1218/010/).
- Automated response: Another key function of EDR platforms is to automate response actions. For example, a malicious file detection may be set to trigger the isolation of an endpoint so that the adversary can not use it to move laterally. Other automated actions include banning malicious binaries from executing or cutting off network connections for specific processes. Another key automated feature that EDR platforms have is the ability to notify specific individuals through email or instant messaging for a quicker response.
- Digital forensic acquisition and analysis: The main advantage of EDR platforms for incident response analysts is the ability to acquire and analyze digital evidence remotely. For example, EDR platforms will have the ability to show binaries that have recently been executed or additional files added to the system. Analysts would be able to search for indicators such as these over the entirety of the network versus attempting to find these files on individual systems. An additional advantage is to also be able to acquire evidence such as individual files suspected of malicious activity or entire forensic packages. This functionality significantly reduces the time necessary to collect evidence while also allowing for searching and collection at scale.
Depending on the EDR platform, organizations also have flexibility in terms of deployment. The primary method of deployment is using a cloud management console that individual endpoints communicate with via an agent. This type of deployment can monitor both internal and cloud-based systems and provides flexibility for remote analysts and incident responders.
The one major disadvantage of EDR platforms is cost. This functionality does not come without a cost. Given the visibility and functionality of EDR platforms, they are quickly becoming a critical tool for organizations of all sizes and an important asset to incident responders to quickly gain incident awareness and the ability to investigate widespread adversary activity across the entire network.
Velociraptor overview and deployment
Aside from commercial platforms, there are open source tools that incident response teams can use that provide at least some of the functionality found in EDR platforms. One of these is Velociraptor. This tool uses a combination of a central server that endpoint agents connect to, as seen in Figure 7.1. These endpoint agents, called clients, manage the search of artifacts on remote systems. This places the load for searching and evidence acquisition on the endpoint, reducing the load on the server, and allowing for concurrent searches across multiple remote clients.
Velociraptor documentation
This chapter can only cover a limited portion of the features of Velociraptor. For a full breakdown of the features, including additional digital forensic use cases, review the Velociraptor documentation at https://docs.velociraptor.app/.

Figure 7.1 – Velociraptor setup
To demonstrate some of the functionality of Velociraptor, a server will be configured. After that, a Windows client will be created and deployed to a Windows endpoint. From there, we will look at how Velociraptor can be used to gain data on an endpoint’s behavior and extract meaningful evidence for further investigation.
Velociraptor server
The first portion of the Velociraptor tool is the server, which manages the agents that will later be installed on the endpoint. There are detailed instructions on deployment available on the Velociraptor GitHub page at https://github.com/Velocidex/velociraptor. There are also several options for deploying the server, including using Windows and Linux OS and Docker. In this case, the server application will be installed on an Ubuntu 20.04 LTS server. After installing the server, go through the following steps to install the application:
Static IP
One key consideration before getting started is to give Velociraptor a static IP address. The agents that will be configured later will need to have this IP address and any changes will make the agents useless.
- Once the Linux server is configured, either use the console or SSH into the server and install Velociraptor. First, create a directory for the Velociraptor files with the following command:
mkdir velociraptor
- Change to the Velociraptor directory:
cd velociraptor
- Download the Velociraptor package from GitHub via the Linux wget command:
wget https://github.com/Velocidex/velociraptor/releases/download/v0.6.4- 1/velociraptor-v0.6.4-1-linux-amd64
- Next, enter the following command to allow the Velociraptor package to execute:
chmod +x velociraptor-v0.6.4-1-linux-amd64
- Now that the Velociraptor has been set to run, the next step is to create the YAML configuration file that contains the setup:
./velociraptor-v0.6.4-1-linux-amd64 config generate > velociraptor.config.yaml
- The configuration file needs to be edited to include the IP address for the GUI and to communicate with the agents that will communicate with the server. Using VIM or Nano, edit the file. For example, Nano will be used here:
nano velociraptor.config.yaml
- In the velocirpator.config.yaml file, there are two entries for localhost. Find these and replace them with the IP address of your server. Next, there are three entries for the IP address 127.0.0.1; again, replace these with the IP address of the server.
- Move the configuration file into the /etc directory:
sudo mv velociraptor.config.yaml /etc
- Next, set an administrator password to access the Velociraptor GUI. Enter a password when prompted:
./velociraptor-v0.6.4-1-linux-amd64 --config /etc/velociraptor.config.yaml user add admin --role administrator
- To start the Velociraptor frontend GUI, execute the following command:
./velociraptor-v0.6.0-1-linux-amd64 --config /etc/velociraptor.config.yaml frontend -v
- If the installation was successful, you should be able to log in to the GUI, which opens the following dashboard:

Figure 7.2 – Velociraptor welcome screen
As the previous directions show, setting up Velociraptor is easy. Further, the server can be deployed in either the internal network or within a cloud infrastructure such as AWS or Azure. This allows incident response analysts to collect data from any system with connectivity to the internet. This also removes the need to maintain a system as Velociraptor can be deployed as necessary in the event of an incident or maintained as a virtual system and powered up as needed.
Now that the server has been configured, let’s go ahead and build a Windows collector that will allow an analyst to examine a remote Windows system.
Velociraptor Windows collector
The Velociraptor collector is the agent that is installed on monitored endpoints and is connected to the server. To configure a collector, follow these steps:
- Before a client can be configured, the Velociraptor application needs to be able to accept a self-signed SSL certificate. Access the velociraptor.config.yaml file that was moved to the /etc directory:
sudo nano /etc/velociraptor.config.yaml
- Add the following line after the nonce line for the first certificate:
use_self_signed_ssl: true
Refer to the following screenshot for reference:

Figure 7.3 – Configuring the Velociraptor YAML file
- From the Velociraptor server command line, change to the velociraptor directory:
cd velociraptor
- Create a client configuration file:
./velociraptor-v0.6.4-1-linux-amd64 --config /etc/velociraptor.config.yaml config client > client.config.yaml
- Download the Windows executable file from GitHub:
wget https://github.com/Velocidex/velociraptor/releases/download/v0.6.4-1/velociraptor-v0.6.4-windows-amd64.exe
- The following command takes the Windows executable and combines it with the configuration file so that the Windows endpoint can communicate with the server:
./velociraptor-v0.6.0-1-linux-amd64 config repack --exe velociraptor-v0.6.0-1-windows-amd64.exe client.config.yaml Velociraptor_Agent.exe
- Finally, ensure that the Secure Shell service is installed on the Velociraptor server:
sudo apt install openssh-server -y
The collector is now configured. To get the collector off the Velociraptor server, simply use any SFTP to transfer it off the system. Then, transfer it to the Windows endpoint or endpoints that you would like to monitor. Next, install the Velociraptor service using the Windows Command Prompt Velociraptor_Agent.exe service install command, as shown here:

Figure 7.4 – Velociraptor Agent intallation
Velociraptor scenarios
Velociraptor is a feature-rich platform that can be leveraged for a wide range of digital forensics and incident response tasks. For the purposes of this discussion, the focus will be on using Velociraptor to access the remote system command line to return data along with running evidence collection binaries.
Velociraptor evidence collection
Velociraptor is a feature-rich tool with a wide range of capabilities. In this chapter, the focus will be on getting basic information about the endpoint, evidence acquisition through the command line, and finally, acquiring an evidence package for further analysis. This should be enough to at least gain some familiarity with Velociraptor. In later chapters, we will look at using Velociraptor for analysis and threat hunting.
Using the Windows command line
One tool that is often overlooked when conducting an initial triage analysis is the Windows command line. From here, an analyst can examine running processes and network connections and extract files. Velociraptor has the capability for an analyst to run commands and evidence tools via the command line on a remote system:
- From the home screen, navigate to the Search clients box and select the down arrow. Select Show All for hosts:

Figure 7.5 – Searching for clients
- This will show all the systems that Velociraptor is communicating with. Those systems with a green button are currently communicating with Velociraptor. If there are red buttons, this means that the endpoint agent is not communicating with the server and needs to be restarted:

Figure 7.6 – Client list
- In this example, the analyst wants to review the hostname DESKTOP-9SK5KPF. Clicking on the corresponding Client ID reveals the following information:

Figure 7.7 – Client information
- One feature of Velociraptor that is useful for initial triage and investigation is the ability to leverage the Windows command line and PowerShell terminals on the Velociraptor server. To access this feature, navigate to the upper-right corner of the windows and click on the >_Shell button:
Figure 7.8 – Accessing Shell
- This opens a window where the analyst can access the command line, PowerShell, Bash, or VQL. In this case, the analyst runs the netstat command against the target system by entering the command and clicking on Launch. This will produce the following:

Figure 7.9 – Windows netstat command output
This feature is useful when conducting an initial analysis or triage of a system. Checking the network connections or running processes may reveal the presence of malware or command and control. This enables the analyst to focus on systems that may have those indicators. Another technique for evidence gathering is running tools that were discussed in the previous chapter from the command line.
CyLR
A simple way to acquire evidence from a remote system is to use the CyLR tool that was discussed in the previous chapter. In this case, the results can be sent to a remote server or workstation using SFTP. Simply run CyLR with the following command with the destination server username and password:
CyLR.exe -u username -p password -s 192.168.0.15
One technique that is useful is to send all the evidence to a central server where multiple analysts can work. In Chapter 12, CyLR will be combined with additional tools available on the Skadi platform.
WinPmem
WinPmem can be deployed on remote systems through native applications such as Remote Desktop or PsExec. Once installed on the remote system, the output of WinPmem can be piped to another system utilizing NetCat. For example, suppose that the incident response analyst is utilizing a system located at 192.168.0.56. If the analyst is able to access the compromised host via PSExec or RDS, they can establish a NetCat connection back to their machine by using the following command:
C:/winpmem-2.1.exe - | nc 192.168.0.56 4455
The preceding command tells the system to perform the capture and send the output via NetCat to the incident response analyst workstation over port 4455. The drawback of this technique is that it requires access to Command Prompt, as well as the installation of both NetCat and WinPmem. This may not be the best option if the incident response analyst is dealing with a system that is suspected of being compromised.
Virtual filesystem
Another key feature of Velociraptor is the virtual file system (VFS). This allows analysts to examine the file structure on a remote system. This is a handy feature for instances where the analysts know a specific file or files that they would like to collect in relation to an alert or incident. In the following example, the analyst has been alerted to a suspicious DLL file located on a remote system and has been tasked with collecting it for analysis:
- From the same window as the previous example, click on the VFS button:

Figure 7.10 – Accessing the VFS
- Depending on the connection, this may take a few minutes to load. When it finishes loading, click on the ntfs portion, as shown:

Figure 7.11 – The VFS
- When navigating the filesystem, if there is an error message saying No data available, click on the folder icon, which will refresh the directory:

Figure 7.12 – Refresh buttons
In addition to refreshing the directory, the additional icons from left to right will either recursively refresh the directory, recursively download the directory, or view the artifacts collected.
- Navigating to the C:Program FilesCommon FilesSystem directory shows a few DLL files. The one that stands out is the bghe21.dll file, which has a modified date and time of 2022-05-04 at 09:44:20 UTC. This stands out as the other DLL files appear to have been modified much earlier:

Figure 7.13 – Suspect DLL
- Clicking the Collect from the client button will download the suspect DLL from the system for analysis:

Figure 7.14 – Collecting files
The VFS is useful for those events and incidents where the analyst has some data pointing to a specific file or directory to search for evidence. This feature significantly decreases the time necessary to acquire specific files. There are some circumstances though where the analyst needs to acquire an evidence package from a remote system. In this case, Velociraptor can be leveraged to acquire a range of files and other data related to an incident investigation.
Velociraptor evidence collection
The last feature that this chapter will look at is gathering evidence from a remote system for analysis. This feature gives the analyst a significant advantage in gathering this data remotely without the need to use the sneaker-net approach. In this case, Velociraptor will be used to gather KAPE evidence collection from a remote system:
- Starting from the beginning, to collect evidence from a system, click on the corresponding Client ID for the suspect system – in this case, DESKTOP-9SK5KPF:

Figure 7.15 – Client list
- On the left pane, click on the bottom reverse clock icon:

Figure 7.16 – Collection icon

Figure 7.17 – Starting a new collection
- This will open the New Collection: Select Artifacts to collect window. There is a wide range of evidence items and sets that can be collected. In this instance, the analyst wants to collect the KAPE Targets artifacts. Navigate to Windows.KapeFiles.Targets, as shown:

Figure 7.18 – Selecting artifacts
- When clicking on the artifacts, the following dialog box opens in the right-hand pane. This information details what parameters can be set. This matches the collection types that were seen in the previous discussion on KAPE:

Figure 7.19 – KAPE Targets details

Figure 7.20 – Collection parameters
- In the New Collection: Configuration Parameters window, click on Windows.KapeFiles.Target. This will open the window in Figure 7.21. This window allows the analyst to select the specific KAPE targets that were discussed in the last chapter. In this case, a basic collection will be performed by clicking on the checkbox next to _BasicCollection:

Figure 7.21 – Collection parameters detail
- Review the Specify Resources window. In this case, the defaults can be left but this allows the analyst to configure how the agent will utilize resources. Click on the Review button to review the collection request:
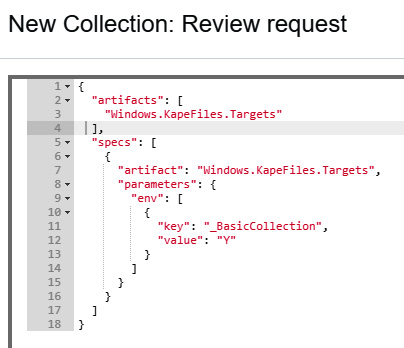
Figure 7.22 – Collection request review
- Click on the Launch button. While the collection is running, an hourglass icon will appear in the window with a unique Flow ID:
Figure 7.23 – Collection request progress
- Once the collection has been completed, the files can be downloaded by clicking on the file cabinet icon in the results pane. This will make the downloads available as shown:

Figure 7.24 – KAPE Targets ready for download
- The files can then be examined on an analyst’s workstation using KAPE or other tools that will be discussed later:

Figure 7.25 – Acquired evidence
With this, we have come to the end of this chapter.
A major challenge of digital forensic acquisition is scaling it to remote systems and being able to quickly analyze the data. Even with this challenge, incident response analysts can leverage tools such as Velociraptor both as a standalone solution and by integrating the tools that they already have. Through this combination, they are able to quickly focus their efforts on those systems that have the greatest evidentiary value. This provides decision-makers with an understanding of the nature of the adversary's actions and what measures they can take without having to wait for a full analysis that is severely limited due to the remote nature of IT operations today.
Summary
In this chapter, we looked at how endpoint detection and response tools can provide analysts with the ability to conduct investigations at scale. Building on this, we examined the open source tool Velociraptor, going through the setup and configuration, agent deployment, and several scenarios where Velociraptor can aid in the gathering of evidence and analysis related to an incident. Keep these scenarios in mind when we discuss ransomware investigations in Chapter 17.
In the next chapter, we will examine how to properly image a system’s storage for follow-on analysis.
Questions
Answer the following questions to test your knowledge of this chapter:
- In an incident investigation, it may not be necessary to obtain a full disk or memory image before an analysis can be conducted.
- True
- False
- Which of the following are not advantages of an EDR platform?
- Cost
- Scalability of investigation
- Event alerting
- Central management
- The one advantage to Velociraptor is that all of the processing is done on the Velociraptor server.
- True
- False