
9
Analyzing Network Evidence
Chapter 5 explored how incident responders and security analysts can acquire network-based evidence for later evaluation. That chapter focused on two primary sources of that evidence: network log files and network packet captures. This chapter will show you which tools and techniques are available to examine the evidence acquired. Incorporating these techniques into an incident response investigation can provide incident response analysts with insight into the network activity of possible threats.
In this chapter, the following main topics will be addressed:
- Network evidence overview
- Analyzing firewall and proxy logs
- Analyzing NetFlow
- Analyzing packet captures
Network evidence overview
Adversaries are bound to the same network protocols that govern normal network traffic. Here, adversarial techniques that can be identified by analyzing network data properly are addressed.
In Chapter 5 we focused on the various sources of evidence that network devices produce. Most of this evidence is contained within the variety of log files produced by switches, routers, and firewalls. Depending on the type of environment that responders find themselves in, this evidence source can be augmented with NetFlow data and full packet captures.
Once the various sources have been understood, it is important to focus on what logs, NetFlow, and packet captures can tell us about an incident. The following are several areas of focus where proper logging and evidence collection may provide additional context surrounding an incident, as well as potential data points when deriving root cause:
- Reconnaissance and scanning behavior: There are a plethora of tools available to adversaries to automate the process of scanning perimeter devices such as firewalls and routers. These scanners attempt to ascertain open ports, vulnerabilities, or authentication protocols such as Secure Shell (SSH) that can be exploited. These scans do leave a trace as they will often require connections to the devices. Depending on the level of logging and the retention period, responders may be able to identify the external infrastructure that is attempting to compromise the perimeter systems.
- Initial infection: Adversaries have become very sophisticated in compromising systems. They will often make use of multi-stage exploits and malware. The first stage will call out to an external infrastructure through a URL and download additional exploits. Web proxies and firewalls may have connection data contained within the log files that record this activity.
- Lateral movement: Once inside a network, adversaries will often attempt to conduct reconnaissance, exploit other systems, and move data around. NetFlow logs provide insight into this type of behavior.
- Command and control: Once a foothold has been established in the network, adversaries require the ability to maintain control over compromised systems. Logs, packet captures, and NetFlow data may be leveraged to identify this type of behavior.
- Data exfiltration: One of the goals of an adversary may be to compromise and exfiltrate data. Proxy logs may identify the destination of such data. NetFlow may show the flow of data from the internal systems to any external systems. Finally, packet captures may be leveraged to identify the exfiltrated files, the source of the data, and the destination.
In Chapter 5 we discussed the three main types of network evidence that can be leveraged in an incident. It is often hard for responders that do not know about network traffic to understand its various aspects. Think about network traffic as a letter that is sent from one individual to another. Log data records the sender’s and receiver’s addresses and mailbox numbers at a central location, such as the local post office. This is akin to the source and destination IP addresses and ports.
NetFlow records much of the same information about the letter but can also tell the individual the weight or relative size of the letter, along with the sender’s and receiver’s addresses and mailbox numbers. Finally, a packet capture tells us all the same information that’s obtained through logs and NetFlow but will also tell the individual the contents of the letter, including (so long as it is not encrypted) the actual data contained within.
Identifying a root cause with network evidence is largely dependent on the evidence itself. One major drawback to evidence such as packet captures and log files is the sheer volume of data that normal network operations create. Often, an incident is identified days or even weeks after it has occurred. During this intervening period, these log files and packet captures become unavailable. Therefore, it is incumbent on responders to fully understand what their organization’s capabilities are regarding network evidence.
Analyzing firewall and proxy logs
Adversaries need to make initial and continued connections to their infrastructure. Network devices such as firewalls and proxies may provide a source of evidence from log files.
Chapter 5 contained a good deal of information concerning the acquisition of network-based evidence and the types of log files that are of importance to an incident responder or security analyst. Aside from the previously covered packet capture, we focused on the acquisition of log files from a variety of sources. These log files can provide some insight into the potential indicators of compromise that can aid in an incident investigation. The main challenge for analysts, though, is sifting through all of the irrelevant logs to find those that have some evidential value.
Log file analysis can be performed in a variety of ways. The specific method that is used may often depend on the type of incident, the tools available, and the amount of log data that has to be analyzed. The following are some of the methods that can be utilized:
- Manual log review: In a manual log review, raw log files are dumped into a tool such as a text editor. From there, the analyst will review the logs line by line. This is a low-cost solution, but it is only useful with a limited amount of data. For example, an analyst would not be able to perform this type of analysis on a large enterprise firewall connection log. Rather, it may be useful to determine which users logged into a seldom-used web application on a particular day.
- Filtered log review: Log review tools allow analysts to filter out log files in terms of specific parameters. This can include showing a list of any known malicious activity. The one drawback is that logs may not immediately indicate known malicious activity, but rather are innocuous at the onset.
- Log file searching: Another key feature in most log analysis tools is the ability to search log files for specific expressions. Tools for searching can utilize both regex and Boolean expressions and allow the analyst to limit logs to a specific period, source IP address, or other specific condition. This allows analysts to quickly isolate specific log files. Depending on the search terms, this may return a good deal of information that has to then be reviewed manually.
- Log file correlation: Separate log activity can be correlated with other logs based on either preconfigured rules or algorithms. Log correlation is often made part of log management tools or Security Information and Event Management (SIEM) platforms with rulesets that have been created. This method is very powerful as it automates the process, but it does require a good deal of upfront labor to configure and tune the specific environment.
- Log file data mining: The next step up from correlation is the ability to mine log files and extract meaning from them. This gives greater context and insight into the specific activity. At the time of writing, there are several tools, such as Elasticsearch and Logstash, that can be integrated into a platform for more useful information.
The number of logs that are produced in a network over a month or so can be staggering. This quantity only increases with the addition of new sources. Sorting through these manually is nearly impossible. In terms of log review, it is better to have a solution that provides some measure of automation, even in small networks. These tools give analysts the ability to sort through the proverbial haystack for that critical needle.
SIEM tools
SIEM tools are critical to gaining situational awareness of activity across the network. These platforms not only serve as an aggregation point for log files from network devices, but they also allow analysts to perform queries on the logs that have been aggregated. For example, let’s say that IP addresses associated with potential malicious activity were discovered during the analysis of the packet capture file. This file was limited to a single host on the internal network. One question that analysts would like to answer is, how many other hosts could be infected? If the SIEM aggregates connection log files from devices such as the exterior facing firewall and web proxy, the analyst would be able to determine whether any other internal hosts are connected to those suspect IP addresses.
A wide variety of SIEM platforms are available, from freeware solutions to enterprise security management platforms. Most of these platforms allow analysts to conduct filtered searching and correlation log reviews. Many of the more robust commercial platforms provide rulesets for detecting specific types of attacks and updates to these rulesets as new attacks become known. Analysts could also query the SIEM tool for connection logs for the host IP address to any other systems. This would normally be the behavior seen in an incident where malware has infected a machine and an attacker is attempting to compromise other machines.
In organizations where incident response personnel are separate from those who are responsible for maintaining the SIEM tool, it is a good idea to review the communications structure so that incident response analysts have access to these platforms. The wealth of information and data that is available can be leveraged to determine what activity on the internal network is connected to a possible incident, as well as evidence that can be utilized to determine the root cause.
The Elastic Stack
Alongside the SIEM technology, incident response analysts can also leverage a bundle of applications for log analysis. This bundle, referred to as the Elastic Stack, combines three tools that allow large sets of data to be analyzed. The first of these is Elasticsearch. Elasticsearch is a log-searching tool that allows near real-time searching of log data. This is accomplished through full-text searching, powered by Lucene. This allows analysts to perform queries against log files for elements such as user IDs, IP addresses, or log entry numbers. Another key feature of Elasticsearch is the ability of the platform to expand the solution as the enterprise grows larger and gains more data sources. This is useful for organizations that may want to test this capability and then add data sources and log files incrementally.
The next component in the Elastic Stack is Logstash. Logstash is the mechanism that handles the intake of log files from the sources across the network, processes log entries, and, finally, allows them to be output through a visualization platform. Logstash can be configured and deployed easily. The integration of Logstash with Elasticsearch allows the incident response analyst to conduct fast queries against a large amount of log data.
The final component of the Elastic Stack is Kibana. Kibana serves as the visual interface or dashboard of the Elastic Stack. This platform allows analysts to gain insight into the data through the use of dashboards. Kibana also allows analysts to drill down into specific key data points for detailed analysis. Incident response analysts can customize these dashboards so that the most critical information, such as intrusion detection logs or connection logs, is immediately available for review.
For example, the Kibana dashboard utilizes several pie charts to display log activity. Utilizing these provides an overview of what information is available to an analyst.
A good tool to augment logs is NetFlow analysis, which we will cover next.
Analyzing NetFlow
NetFlow describes the data about connections between devices in the network. Used primarily to troubleshoot connectivity and bandwidth issues, NetFlow can be used by responders to gain insight into the movement of data precipitating an incident.
NetFlow is a feature that was first introduced by Cisco Systems in the 1990s. NetFlow collects specific data about packets as they enter or exit an interface of a router or switch. This data is then sent to a NetFlow Collector via a NetFlow Exporter, which is often made part of switches or routers. The NetFlow Collector then aggregates and stores the flow data for analysis. This data is often leveraged by network and systems administrators to troubleshoot bandwidth issues, identify network congestion, and observe the flow of data.
A sample NetFlow output can be seen in the following screenshot. What is included with flow data can vary between network device manufacturers as there are several versions in the commercial market. The following screenshot shows some of the basic information that is captured as part of a NetFlow dataset:

Figure 9.1 – Sample NetFlow data
The following components of a NetFlow record can be seen in the preceding screenshot:
- Src Addr: This is the source address that has initiated the connection or is sending traffic.
- Dst Addr: The destination addresses for the connection.
- Sport: This is the source port for the source address.
- Dport: This is the destination port. In terms of analyzing NetFlow as part of an incident investigation, this is one of the key data points to focus on as this often tells responders the service that the source address is connecting to.
- Proto: This is the protocol in use.
- Packets: The number of packets that are made as part of the flow.
- Bytes: The total number of bytes.
- Flows: This indicates how many flows have been recorded. Flows can be thought of as separate TCP connections. For example, a packet capture analyzed with a tool such as Wireshark will show individual packets. Flows indicate the TCP session that was established. In this circumstance, if an SSH session is interrupted and established, two flows would be recorded.
When examining the NetFlow data shown in the preceding example, two significant data points may be important. The first is the number of SSH connections between devices. Secure Shell is a common way for systems to communicate with each other, but if this is outside the bounds of normal network behavior, it warrants a follow-up. In addition, connections via SMB (port 445) are commonly abused by adversaries to access other systems, deliver ransomware, or access file shares. Even in this short example, it becomes very clear that responders gain a great deal of insight by just having visibility of the connections that occur on the internal network.
Analyzing packet captures
One of the best sources of evidence during an incident is packet captures. Dissecting them can uncover data exfiltration, exploits, and command and control.
A great deal of Chapter 5 covered the various methods to obtain packet captures from a range of sources and a variety of locations. Packet captures contain a great deal of information that is potentially valuable to incident response analysts. Some of this information includes source and destination IP addresses, domains and ports, and the content of communications between hosts. In some instances, incident response analysts can reconstruct actual files, such as text documents and images. The main drawback is the sheer amount of data that is involved.
Sample packet captures
This chapter refers to several preconfigured packet captures. These packet captures have been taken directly from http://malware-traffic-analysis.net/ by permission of the author. This site contains several packet capture exercises, where incident response analysts can practice locating indicators of compromise. It should be noted, though, that these captures may contain malware. You should only examine the live packet captures in a properly configured sandbox (see Chapter 16) or another system not connected to a production environment.
Command-line tools
Several command-line tools can be utilized when analyzing network packet captures. During more in-depth or lengthy incident response engagements, analysts may gather several packet capture files. It may be beneficial to combine these multiple packet captures into a single file to make analysis easier. The Mergecap application does just that by combining several packet capture files. Mergecap is offered as part of the SANS SIFT workstation and can be executed using the following command:
sansforensics@siftworkstation: ~$ mergecap packetcapture1.pcap packetcapture2.pcap
Another command-line tool that is useful in analyzing packet captures is Editcap. Editcap allows analysts to manipulate the packet capture files into smaller segments for easier review. For example, an analyst may only want to look at captures that are broken up into 50,000 packet segments. This would be helpful if an analyst has a large packet capture and dividing would make searching easier. To do this, the analyst would type the following into the command line:
sansforensics@siftworkstation: ~$ editcap -F pcap -c evidence.pcap split.pcap
In the preceding command, editcap took the evidence.pcap evidence file and divided it into 50,000 packet segments. Another technique that Editcap can be leveraged for is to divide a larger packet capture into time segments. For example, if analysts want to divide a packet capture into 10-minute segments, they can type the following:
sansforensics@siftworkstation: ~$ editcap -F pcap-t+600 evidence.pcap split.pcap
Analysts may also find that, in some circumstances, they may want to isolate domain name registration traffic. This is due in large part to a variety of adversarial actions such as C2 traffic, data exfiltration, and the possible redirection to compromised websites, often leveraging vulnerabilities in the DNS system. The dnstop application parses packet capture files and ascertains the sources and count of DNS queries from internal hosts. To install it on a Linux system, you can use the following command:
dfir@ubuntu:~$ sudo apt-get install dnstop
This command will download and install dnstop. In the following example, the packet capture was taken from the Malware Traffic Analysis site located at https://www.malware-traffic-analysis.net/2022/03/21/index2.html. If an incident response analyst wants to determine whether any IP addresses were sending outbound DNS queries for packet capture, they can simply execute the following command:
dfir@ubuntu:~/Documents/Packet Captures$ dnstop 2022-03-21-Hancitor-with-Cobalt-Strike-and-Mars-Stealer.pcap
The output of the preceding command is as follows:

Figure 9.2 – DNS query count
Real Intelligence Threat Analytics
One challenge with working with packet captures is the sheer amount of data that is involved. A 24-hour packet capture from even a modest-sized network presents problems. One technique is to use tools that focus on key data points. For example, beaconing traffic associated with Command and Control is a critical piece of data to find as it is the link the adversary has to the internal network.
One tool that can assist is Active Countermeasure’s Real Intelligence Threat Analytics (RITA). This command-line tool uses behavioral analytics to identify patterns that are indicative of beaconing behavior so that an analyst can focus on a specific IP address or domain name. A key feature of this tool is its ability to process large packet captures, such as one obtained over 24 hours. This allows analysts to locate even very low and slow Command and Control traffic.
Installing RITA is very straightforward. In this case, RITA has been installed on an Ubuntu desktop. First, make a directory for RITA. Second, download the installation script from the GitHub site at https://github.com/activecm/rita/releases/tag/v4.5.1. Next, make the file executable by running the following command:
dfir@ubuntu:~/rita$ sudo chmod +x ./install.sh
Next, execute the install script by running the following:
dfir@ubuntu:~/rita$ ./install.sh
The installation script will install the necessary dependencies, such as the Mongo database structure and the packet capture analysis tool Zeek.
Zeek
Zeek is a network monitoring and analysis tool that is used with RITA. For more information regarding Zeek, go to https://docs.zeek.org/en/lts/.
The next step is processing the packet capture. In this case, two packet captures were taken from the Malware Traffic Analysis post at https://malware-traffic-analysis.net/2022/01/27/index.html and were merged into a single file. This file was moved into the RITA directory. The following command points Zeek to the packet capture so that it can be processed into the various log files:
dfir@ubuntu:~/rita$ zeek -C -r IcedId.pcap
Checking the files in the directory shows the processed log files:

Figure 9.3 – Zeek log files
After processing the packet capture with Zeek, the log files need to be imported into a database, IcedID, that RITA can read with the following command:
dfir@ubuntu:~/rita$ rita import *.log IcedID
Once this command is run, the results should look as follows:

Figure 9.4 – RITA Zeek log import
To access the help menu for RITA, enter the following:
dfir@ubuntu:~/rita$ rita
This will produce the following commands and associated results:
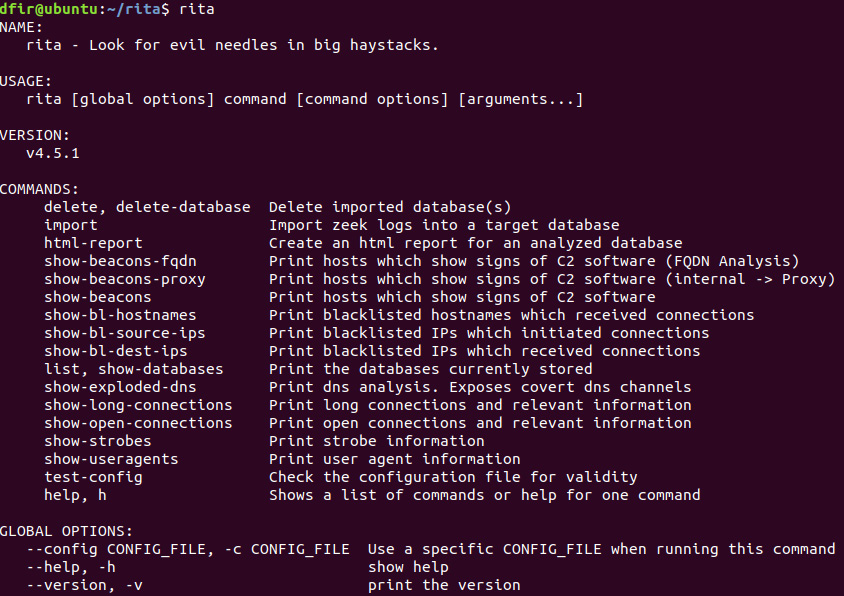
Figure 9.5 – RITA features
Let’s go ahead and see if there are any packets indicating beaconing behavior. Run the show-beacons command against the database that was previously created by running the IcedID database:
dfir@ubuntu:~/rita$ rita show-beacons IcedID
This produces the following:

Figure 9.6 – RITA Beacon analysis
In Figure 9.6, RITA is indicating that the internal IP address 10.1.28.101 has established 234 connections to the IP address 149.255.35.174. One result that is of note is the first number, 0.838, found at the beginning of the results line. This score indicates the confidence level RITA has in these results, from 0 to 1. In this case, there’s nearly 84% confidence that the traffic is beaconing behavior.
Another option is to run the show-beacons-fqdn command, which will show the domain names of systems:
dfir@ubuntu:~/rita$ rita show-beacons-fqdn IcedID
This produces much of the same results but indicates that the Command and Control server has a domain name of driverpackcdn.com, as shown here:

Figure 9.7 – RITA Beacon Fully Qualified Domain Name
As we can see, RITA allows analysts to focus on specific IP addresses and domain names as potentially malicious without having to dig through gigabytes of packet data. From here, they can pivot directly to the connections that are critical in GUI-based tools, which we will focus on next.
NetworkMiner
GUI-based tools that separate packet capture data are easier to navigate than command-line tools. One such tool is NetworkMiner, which is available at https://www.netresec.com/?page=NetworkMiner. This tool is available as a commercial or community tool, with the community tool having more limited functionality. Despite this, the community edition does have some key features that are useful in analyzing packet captures.
In this demonstration, we will examine the PCAP file associated with a Hancitor infection, which can be downloaded from https://malware-traffic-analysis.net/2022/03/21/index2.html. Load the PCAP data by going to File and selecting Open. Navigate to the packet capture and click Open. NetworkMiner will process the PCAP and display the hosts found in the packet capture:

Figure 9.8 – NetworkMiner GUI
The next tab, Files, shows the files that were contained within the packet capture:

Figure 9.9 – NetworkMiner’s Files tab
If you drill down further into the Files tab, you will see there are a few entries that stand out. The far-left column indicates the frame number. In this case, frame number 47 contains an entry for the b123.exe file that was downloaded from bor4omkin.ru with an IP address of 45.8.124.233:

Figure 9.10 – Suspect files
In addition to visualizing files that were contained within the packet capture, NetworkMiner also extracts them and places them in the AssembledFiles directory, broken down by IP address. This allows analysts to quickly identify suspect files and analyze them.
NetworkMiner is a useful tool for an initial review of packet captures. It provides details about the files, DNS queries, sessions, and other key data points. The main advantage that can be leveraged is its ability to quickly focus on key data points so that analysts can focus on specific areas, without having to dig through an entire packet capture to find the key evidence items.
Arkime
Arkime is an open source packet capture and search system that allows analysts and responders to examine large network packet captures. By default, Arkime organizes the packet captures into the various sessions contained within the capture. Arkime can be utilized as a network monitoring system that can be leveraged by importing packets into the Elasticsearch infrastructure. From here, responders can examine network activity in near-real time. Another method that Arkime can be leveraged for is loading offline packet captures for indexing.
Installation instructions for Arkime can be found on GitHub at https://raw.githubusercontent.com/arkime/arkime/master/release/README.txt. Arkime can be installed on a variety of Linux desktop or server platforms. The server option provides larger teams with the ability to share data concerning packet captures, as well as evaluate running captures. Desktop installations are an option for responders that will be handling offline data and who do not need to share the results.
In this section, we will use Arkime to analyze a packet capture from a system related to a phishing attack. This packet capture can be found at https://malware-traffic-analysis.net/2022/02/25/2022-02-25-Emotet-epoch4-with-spambot-activity.pcap.zip.
First, create a directory in Arkime for offline packet captures. This can be done in the home directory. Next, transfer the packet capture using SFTP to the offline packet capture directory. Finally, use the Arkime capture binary, which can be found in the /opt/arkime/bin directory, to process the packet capture using the following command:
arkime@arkime:/opt/arkime/bin$ sudo ./capture -r /home/offlinecaps/2022-02-25-Emotet-epoch4-with-spambot-activity.pcap
The preceding command takes the 2022-02-25-Emotet-epoch4-with-spambot-activity.pcap file and processes it so that it can be reviewed with the GUI. An important thing to note is the -r parameter, which only processes a single capture. If there are multiple captures, the binary can be run with the -R parameter set, which recursively processes all the packet captures in the directory. Figure 9.11 shows the packet capture being processed:

Figure 9.11 – Arkime PCAP import
Once completed, open a web browser and navigate to the IP address of the server or workstation with port 8005. This will open the Arkime interface. In the top left, set the time to All. Once the time has been set, the following view will appear:

Figure 9.12 – Arkime GUI dashboard
Arkime is a feature-rich platform. The following steps provide an overview of some of the features available in examining offline packet captures:
- An examination of the packet capture from the dashboard identifies several different sessions where the internal system at 10.2.25.101 is communicating with external IP addresses. To narrow down the search results to internet traffic over HTTP, the following search query should be entered into the search bar:

Figure 9.13 – HTTP port 80 query
- This shows that there were two TCP sessions with a destination port of 80. These sessions can be sorted by any of the fields present in the dashboard. One key piece of data that is useful is the bytes that are transferred as part of the session. Large deltas between bytes sent and received may indicate data exfiltration if the bytes sent are larger or, in the case of this capture, bytes received, which can indicate a file transfer, as seen in these entries:
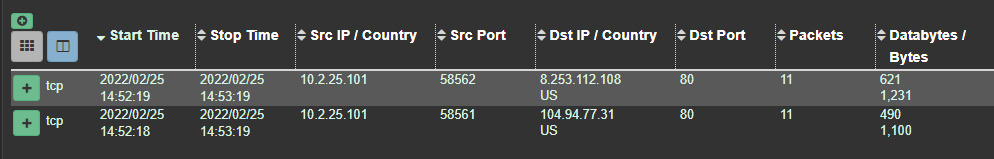
Figure 9.14 – HTTP session data
- The far right of the dashboard contains URIs and associated information concerning the sessions. For example, a check of the sessions over HTTP indicates that the local host navigated to what appears to be a Windows update site:
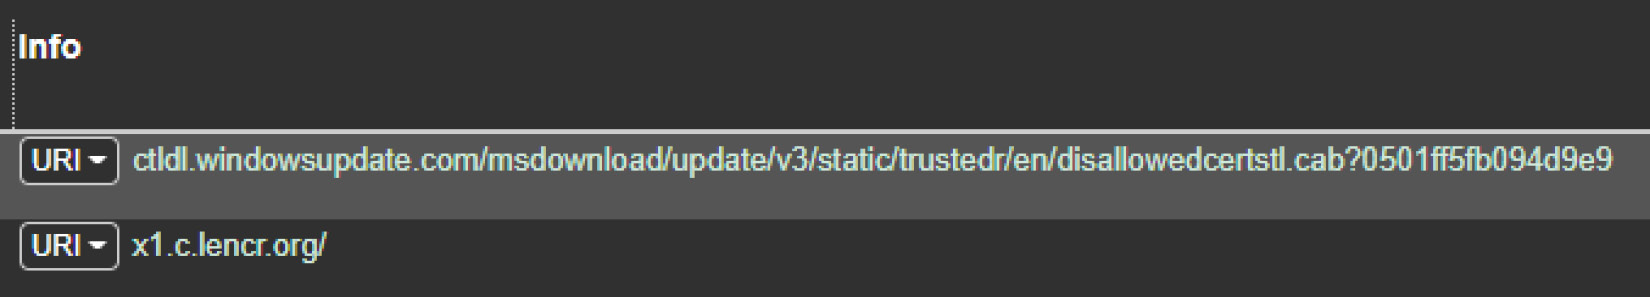
Figure 9.15 – Arkime URI data
- Arkime provides additional information for the session in the same session row as the information URI related to the Windows Update. Clicking on the green plus sign box opens the following page:
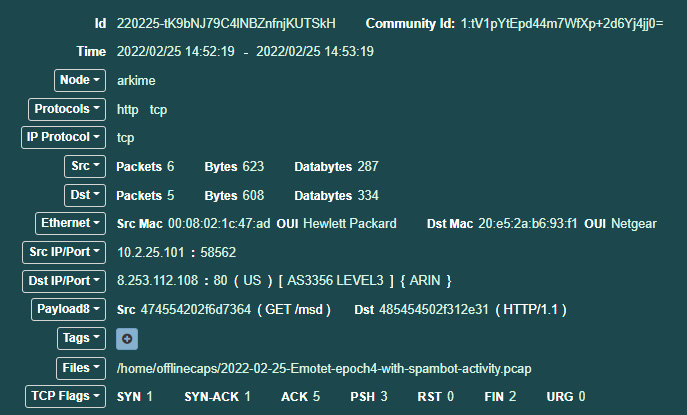
Figure 9.16 – Session data

Figure 9.17 – HTTP session data
- Another feature that is useful with Arkime is the ability to visualize connections. At the top of the Arkime web application is Connections. If you click on Connections, the following will appear:

Figure 9.18 – Arkime connections graph
Next, let’s have a look at how to reset Arkime.
How do I reset Arkime?
At the end of the analysis, there are two ways to clear the existing data in preparation for subsequent analysis. The first is to deploy Arkime on a virtualization platform such as VMware. Here, you can create a new installation and then capture a snapshot of the new installation. Once the analysis is complete, you can revert to the fresh installation snapshot.
Another method is to either rerun the init or wipe command. The steps are as follows:
- Leave Elasticsearch running.
- Shut down all running viewer or capture processes so that no new data is recorded.
- To delete all the SPI data stored in Elasticsearch, use the db.pl script with either the init or wipe command. The only difference between the two commands is that wipe leaves the added users so that they don’t need to be re-added:
/opt/arkime/db/db.pl http://ESHOST:9200 wipe
- Delete the PCAP files. The PCAP files are stored on the filesystem in raw format. You need to do this on all of the capture machines:
/bin/rm -f /opt/arkime/raw/*
The major advantage to Arkime is the ability to view the network traffic in a flow view. For a more detailed packet-by-packet view, the best tool to leverage is Wireshark, which we will cover next.
Wireshark
Wireshark is one of the most popular packet capture analysis tools available to incident response analysts. In addition to the ability to capture packets, a great many other features are available. As entire volumes and training courses are built around this platform, it is impossible to identify every feature. Therefore, this chapter will focus on some of the key features of Wireshark that are most applicable to an incident investigation.
Wireshark resources
Arguably, Wireshark is the packet analyzer of choice for IT and security professionals. Due to the ubiquity of the application, there are a wide variety of resources available for additional training on Wireshark and its capabilities. The Wireshark site at https://www.wireshark.org/ contains a great deal of information. Furthermore, the site at https://www.chappell-university.com/ contains exercises and training packet captures to hone skills regarding analysis.
Additionally, Lisa Bock, who authored Learn Wireshark, provided an in-depth treatment of Wireshark in her book, which is available at https://www.packtpub.com/product/learn-wireshark-fundamentals-of-wireshark/9781789134506.
Because Wireshark is a feature-rich tool, some settings lend themselves more to network traffic analysis that are outside incident response activities. As a result, some changes need to be made to better assist the incident response analyst with performing packet capture analysis concerning an incident investigation:
- Time: The time setting in Wireshark provides several options. These include the time of the packet since 1/1/1970 or since the start of the packet capture. One of these options, which can be useful in an incident investigation, is the date and time when the individual packets were captured. This allows analysts to correlate the date and time of other suspicious or malicious activity with the date and time of specific traffic within the packet capture. To enable this, navigate to View and then to Time Display Format. From there, choose one of the time options, such as Date and Time or Day or Time of Day. Another option to consider is utilizing the UTC options. This is very useful if the internal network utilizes UTC rather than local time. The time can also be set to nanoseconds.
- Name resolution: The name resolution setting allows analysts to toggle between seeing the IP addresses of the source and destination hosts and hostname resolution. This is useful if an analyst is examining a packet capture and wants to determine if any suspicious hostnames have been found. For example, if the packet capture is open, you will see various IP addresses:

Figure 9.19 – Wireshark IP address view
To determine the hostnames, navigate to View and then Name Resolution. Click on Resolve Network Addresses. Wireshark will then resolve the IP addresses to hostnames:

Figure 9.20 – Wireshark domain name view
- Colorize packet list: This feature allows analysts to toggle between a blank background of the packet list or to allow Wireshark to color-code the packets:

Figure 9.21 – Wireshark – Coloring Rules Classic
For this chapter, an exploration of Wireshark will be done while utilizing a packet capture that can be found on Malware Traffic Analysis at https://malware-traffic-analysis.net/2022/04/14/index.html. This packet capture includes downloading a copy of the Qakbot malware, along with Cobalt Strike. For this chapter, several key elements of the packet capture will be identified. Before examining the packet capture, Wireshark was configured so that the date and time are visible, and so that the hostnames were identified.
The following are some of the features in Wireshark that provide key pieces of information from the packet capture:
- Display filters: One of the most important features is the ability to filter packet captures on a wide range of services and ports. Filters can also be utilized on the source and destination IP addresses. For example, an incident response analyst would like to filter traffic on the system’s source domain name: DESKTOP-S9U1NBH.local. By right-clicking on the IP address in the packet capture window and navigating to Apply as Filter and then Selected, the analyst can select the IP address as a filter. This filter then appears in the filter bar with the ip.src==10.4.14.101 syntax, which displays the following:

Figure 9.22 – Source address filter
- Host identification: Another key aspect of analyzing packet captures is to identify the localhost, if applicable. Considering that this packet capture is from a single host, identifying the hostname, IP address, and MAC address is straightforward. By double-clicking on the individual packet, a great deal of information can be found:

Figure 9.23 – Packet data
- Physical connection identification: In this packet, the analyst can identify the source of the traffic from the Ethernet II and Internet Protocol Version 4 (IPV4) lines. Examination of the packet indicates both the source and destination MAC addresses as well. The preceding data also shows that this is an HTTP packet with the destination port set to the standard port 80.
- Protocol identification: In this case, there was a good deal of HTTP connections, due to the activity of the user. As a result, the primary transmission of the malware was quite possibly through an HTTP connection. Wireshark has several filters that allow analysts to limit the packet capture results with specific parameters. In the top green dialog box, enter http. Pay attention while entering this in the filter, as several different filters will be available. Once the filter has been typed in, click the right-facing arrow located at the far right of the dialog box. Wireshark will now limit the view of packets to those that are utilizing the HTTP protocol:

Figure 9.24 – HTTP packet view
- Hostname identification: After parsing through the packet capture source and destination hostnames, one hostname appears to be suspicious. This host, geobram.com, may be a suspect URL. Another feature of Wireshark is the ability to follow the TCP or HTTP stream of communication between the source and destination hosts. If you right-click on the rozhan-hse.com hostname, the following will appear:
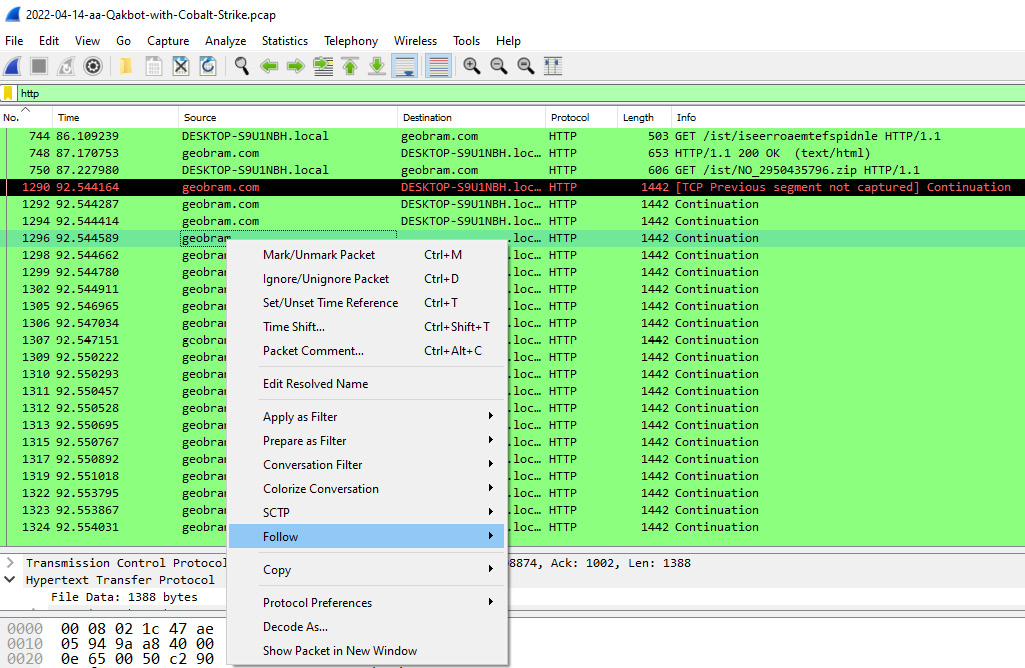
Figure 9.25 – Follow HTTP Stream
A second window will appear; click on HTTP Stream and a third window will appear. This window contains the HTTP packets in a format that can be read. The incident response analyst can review this output to determine what types of files may have been sent or received:

Figure 9.26 – HTTP packet data
- Packet stream examination: An examination of the Follow TCP Stream output indicates that an HTTP GET command is reaching out to the NO_2950435796.zip file. An analyst may want to extract this file for analysis. Click on File and then Export Objects, and then HTTP; a window will appear listing all of the files associated with the HTTP connections. This list can be sorted on any of the fields at the top of the window. In this case, select the hostname and scroll down until the suspected URL is located:
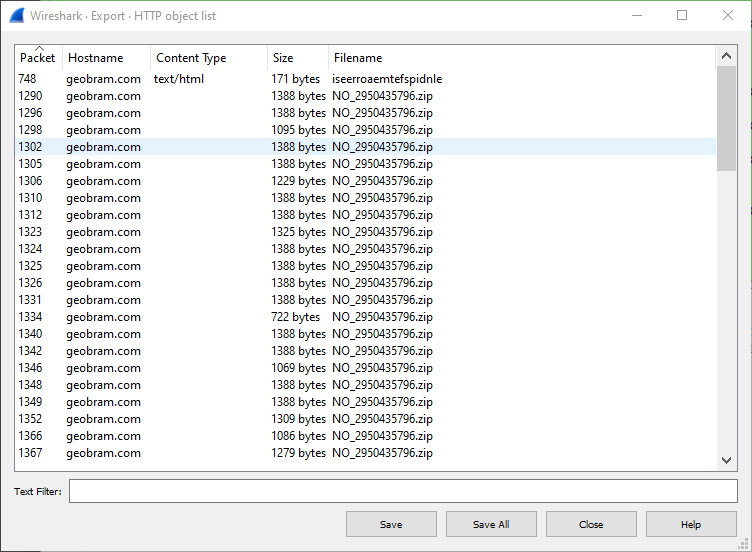
Figure 9.27 – Wireshark – Export – HTTP object list
From here, the analyst can click on the file and save it onto the local system for later analysis. Chapter 12 will take select files and evaluate them for malicious code.
Wireshark is a powerful tool for conducting a detailed analysis of packet captures. The ability to drill down to individual packets and dissect them allows analysts to gain a very detailed sense of what is contained within the traffic running to and from external hosts, as well as to and from internal hosts. This visibility can afford the analyst possible insight into how an infected host communicates with an external host, or even identify other hosts that may have become compromised.
Summary
Security incidents not only produce trace evidence on host systems but also leave traces throughout the devices and traffic flows within a network. The ability to analyze this trace evidence will allow incident response analysts to have a better understanding of what type of incident they are investigating, as well as potential actions that can be taken. This chapter addressed how to evaluate log files through the rapid process of blacklist comparison or DNS analysis to log analysis utilizing the Elastic Stack or other SIEM systems. To augment this primary method of network evidence evaluation, we covered NetFlow analysis, and examined packet captures with Arkime and Wireshark. Network evidence is a critical component of incident investigation. This trace evidence, taken in conjunction with evidence obtained from potentially compromised websites, goes a long way in allowing analysts to reconstruct the events of an incident.
The next chapter will move the focus from network traffic to the host, and memory analysis will be explored.
Questions
Answer the following questions to test your knowledge of this chapter:
- A filtered log review is one where the responder or analyst filters out specific logs based on a set parameter.
- True
- False
- What is not a component of the Elastic Stack?
- Elasticsearch
- Log forwarder
- Logstash
- Kibana
- Which packet analysis tool places the packet capture into sessions as the default view?
- Wireshark
- NetFlow
- Elastic Stack
- Arkime
- Wireshark does not allow for DNS name resolution.
- True
- False
Further reading
Refer to the following links for more information about the topics covered in this chapter:
- Elasticsearch 7.0 Cookbook - Fourth Edition: https://www.packtpub.com/big-data-and-business-intelligence/elasticsearch-70-cookbook-fourth-edition.
- Malware traffic analysis: https://www.malware-traffic-analysis.net.
- Arkime: https://arkime.com/.
- Chappell University: https://www.chappell-university.com/.
- Cisco IOS NetFlow: https://www.cisco.com/c/en/us/products/ios-nx-os-software/ios-netflow/index.html.