
10
Analyzing System Memory
For a long time, law enforcement and other organizations performing digital forensic tasks associated with incident investigations often relied on methodologies that focused on evidence contained within the hard drive of a machine. Procedures dictated that the system should be powered down and the hard drive removed for imaging. While this methodology and the associated procedures were effective at ensuring the integrity of the evidence, this overlooked the wealth of information that was contained within the Random Access Memory (RAM), or memory for short, of the targeted system. As a result, incident response analysts began to focus a great deal of attention on ensuring that appropriate methods were employed that maintained the integrity of this evidence, as well as giving them a platform from which to obtain information of evidentiary value.
This chapter will focus on the types of evidence that can be located within the memory of a system, the tools and techniques available to incident response analysts, and, finally, how to analyze this information to obtain a clear understanding of how the system was compromised. In addition, these techniques can also be integrated into the analysis of other evidence, such as network log files and files located on the targeted system.
In this chapter, the following main topic areas will be addressed:
- Memory analysis overview: This section addresses the critical data points that can be discovered through proper memory analysis
- Memory analysis methodology: A structured approach is important to ensure that responders can extract the necessary data
- Memory analysis with Volatility: Often thought of as the gold standard of memory analysis, this command-line tool has extensive features for data acquisition and analysis
- Memory analysis with Strings: A simple but effective tool that affords responders the ability to cull data from those areas of memory that other tools may miss
At the end of this chapter, you will have both an understanding of the methodology and the tools necessary for finding data points, analyzing them, and extracting other evidence for follow-up analysis.
Memory analysis overview
When discussing how to analyze the memory of a system, two terms are used interchangeably. The terms RAM and memory are used to describe the portion of the computer’s internal systems where the operating system places data utilized by applications and the system hardware while that application or hardware is in use. What makes RAM or memory different from storage is the volatile nature of the data. Often, if the system is shut down, the data will be lost.
One change in operating systems that has had a direct impact on memory analysis is the advent of the 64-bit OS. The use of a 64-bit register allows the OS to reference a total of 17,179,869,184 GB of memory. When compared to the 32-bit OS, this is several million times the amount of data previously available. As a result, there is a good deal of data contained within RAM at the time a system is running that is valuable in incident investigation. This includes the following:
- Running processes
- Loaded Dynamic Link Libraries (DLL)
- Loaded device drivers
- Open registry keys
- Network connections
- Command history
As the necessity for analyzing the memory of systems has increased, there are several tools that analysts have at their disposal. This chapter will focus on three such tools; all of them are either open source or freeware and can be deployed easily. These tools allow analysts to gain critical insight into the activity of exploits and malware that have impacted a system.
Throughout this chapter, two memory captures will be utilized. The first memory capture is from a Windows system that has been infected by the Cridex virus. The memory image can be downloaded from http://files.sempersecurus.org/dumps/cridex_memdump.zip.
The second is another Windows system that is part of a training exercise available at https://dfirmadness.com/case001/DC01-memory.zip.
While both of the malware infections are relatively old, they are useful for highlighting specific features of the toolsets we are going to examine.
Memory analysis methodology
When examining system memory, analysts should follow a methodology. This ensures that all potential evidence is uncovered and can be utilized in an incident investigation. We will examine two methodologies. The first of these is the SANS six-part methodology. This is geared toward identifying indicators of compromise associated with the execution of malware. Another methodology focuses on leveraging an IP address or other network artifact to identify the malicious code associated with that IP address.
One of the chief aims of memory analysis is to identify potentially malicious processes or executables that can be extracted and examined. Much of the material that is present in this chapter will carry over into Chapter 16, where the extracted data will be further analyzed.
SANS six-part methodology
The SANS institution makes use of a six-part methodology for analyzing memory images. This process is designed to start from an overall view of what is running to identifying and accessing the malicious software. The SANS methodology follows the following steps:
- Identify rogue processes: Malware often hides its behavior behind processes that, on the surface, may seem legitimate. Uncovering these involves identifying what processes are running, finding the location in the operating system they are running from, and verifying that only legitimate processes are in use. Sometimes, processes are hidden in plain sight, and adversaries change a single letter in a process name. Other times, they will attempt to execute a process from an illegitimate source.
- Analyze process DLLs and handles: Once a process or multiple processes have been identified as rogue, the next step is to examine the DLL files associated with the process, as well as other factors such as account information. DLL files are often leveraged by malware coders to hide their activity. Techniques for using DLL files to compromise a system include techniques where malware coders insert their own malicious DLL files as part of the malware. Other techniques include DLL injection, where a path to one of the malicious DLLs is written in the process.
- Review network artifacts: Malware, especially multi-stage malware, requires a connection to the internet. Even systems that are fully compromised often beacon out to C2 servers. Active and listening network connections are contained within the memory of these systems. Identifying external host IP addresses may give some insight into what type of compromise has taken place.
- Look for evidence of code injection: Techniques such as process hollowing, and unmapped sections of the memory are often used by advanced malware coders. Memory analysis tools help analysts find evidence of these techniques.
- Check for signs of a rootkit: Achieving persistence is a goal for many external threat actors. If they can compromise the system initially, they must maintain that. As a result, adversaries might use a rootkit or malware that embeds itself deep within the operating system. This malware allows the adversary to have continuous and often elevated access to the system while remaining undetected.
- Dump suspicious processes and drivers: After locating any suspicious processes or executables, analysts need to be able to acquire them for later analysis with additional tools.
Next, we will look at the network connections methodology.
Network connections methodology
In many incidents, the first indication that a system has been compromised is attempted or completed connections to external hosts. Detection mechanisms such as firewalls or web proxies may indicate that a system or systems are attempting to communicate with suspect external hosts. From this starting position, it may be possible to identify potential malware on a system:
- Suspicious network connections: Conducting a review of network connections on hosts that have been associated with external connections will often provide the process that is attempting to communicate.
- Process name: Examining the process from the network connections allows analysts to perform similar actions found within the SANS methodology. It is advisable for the analyst to also determine whether the identified process is one that often requires a network connection.
- Parent process ID: Further insight into the parent process is useful for determining whether the process is legitimate and has a legitimate need to communicate via a network connection.
- Associated entities: Finally, examining the associated DLLs and other artifacts brings us to the stage where they can be acquired and analyzed.
Now, let’s look at some memory analysis tools.
Memory analysis tools
Analysts can use several tools to review memory images. Some tools provide a GUI for ease of use, while others operate via the command line, making them useful for scripting. In this chapter, three tools will be examined. The first of these, Mandiant Redline, is a GUI-based memory analysis tool that examines memory images for signs of rogue processes and scores them based on several factors. The second of these tools is Volatility, a command-line tool that allows analysts to drill into the details of the memory image and identify potentially malicious code. The final tool that will be examined is the Strings utility available in Linux. Strings allows keyword searching through GREP, which allows the responder to identify IOCs that may not be readily visible with the other tools.
Memory analysis with Volatility
Volatility is an advanced open source memory forensics framework. The primary tool within the framework is the Volatility Python script, which utilizes a wide array of plugins to analyze memory images. As a result, Volatility can be run on any operating system that supports Python. In addition, Volatility can be utilized against memory image files from most of the commonly distributed operating systems, including Windows for Windows XP to Windows Server 2016, macOS, and, finally, common Linux distributions.
A range of plugins is available for Volatility, with more being developed. To examine system memory, we will examine several plugins to ensure that you have sufficient information to conduct a proper analysis. However, before using Volatility, it is recommended that you ensure that your software is up to date and that any new plugins have been explored to determine their applicability to the current incident investigation.
Volatility versions
Volatility is currently in version 3, but version 2 is still in use, especially for analysts that may still need to analyze memory images from Windows XP or Server 2003 systems. The main difference between the two is that version 3 no longer requires the analyst to set a system profile for Volatility to correctly parse the memory image. In addition, there have been changes to the syntax of the various plugins. Ashley Pearson’s Volatility cheat sheet blog, available at https://blog.onfvp.com/post/volatility-cheatsheet/, shows the differences.
Installing Volatility
Volatility is available for Linux, Windows, and macOS. Information on installing it on the various OSs is available at https://www.volatilityfoundation.org/releases. For this chapter, Volatility was installed on the Linux Ubuntu subsystem available on the Windows 10 OS. The following command will install Volatility on the Ubuntu subsystem, as well as other Linux OSs:
forensics@ubuntu:~$ git clone https://github.com/volatilityfoundation/volatility3.git
This will produce the following output:
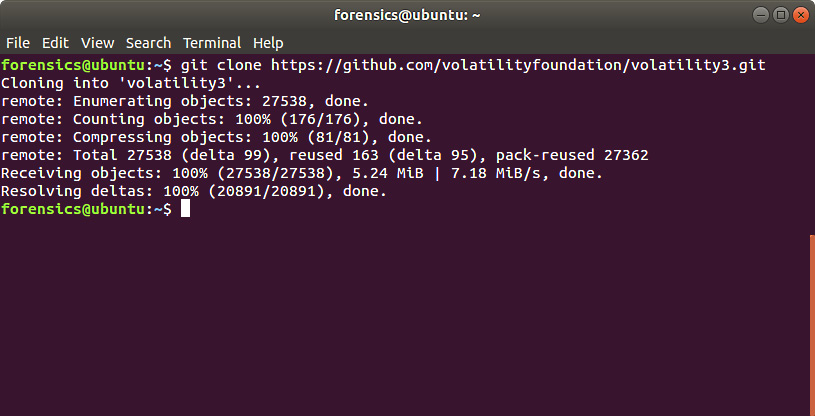
Figure 10.1 – Installing Volatility
Running the ls command shows the various scripts and files that are part of the Volatility framework:
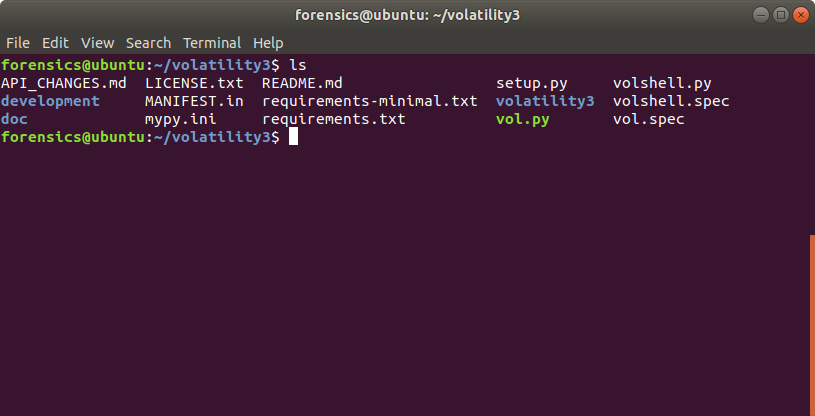
Figure 10.2 – Verifying the Volatility installation
You can access the help menu in Volatility by running the following command:
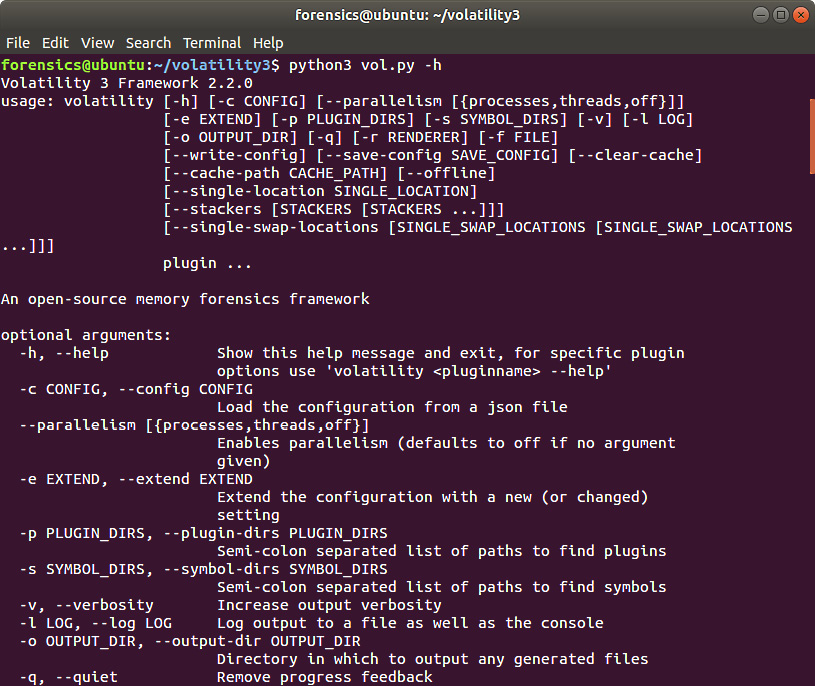
Figure 10.3 – Volatility help menu
Volatility commands
Volatility uses a straightforward command structure. When using the Python file, as we are here, use Python 3 and then the Volatility Python file. Next, indicate the path to the file and finally the plugin. Additional parameters are dependent on the plugin; you will see this in several of the plugins that we will discuss. This is how the command line should look:
forensics@ubuntu:~/volatility3$ python3 vol.py -f <Memory Image File> <operatingsystem.plugin>
Let’s go ahead and cover some of the plugins we can leverage with Volatility.
Volatility image information
First, we will start by getting some initial information about the memory image and the system that it was obtained from. Even if the analyst is certain of the OS, it is still a good practice to run the memory images against Volatility’s windows.info plugin. The output of this plugin identifies the potential profile of the memory image that becomes critical to utilizing the other plugins available. In general, the Volatility syntax is composed of the path to the memory image and the specific plugin. In this case, the following command is used:
forensics@ubuntu:~/volatility3$ python3 vol.py -f /home/forensics/EvidenceFiles/MemoryImages/cridex.vmem windows.info
This produces the following results:

Figure 10.4 – The windows.info plugin
In this case, the NTBuildLab field indicates that the memory image is from a Windows XP machine. Next, let’s start analyzing the Windows process information.
Volatility process analysis
In keeping with the SANS six-part methodology, the first of the plugins that will be discussed are those that provide data about the processes running on the system at the time of the memory capture. The aim here is to identify those processes that appear suspicious and to identify any related data associated with them.
Process list
The first of these will be the windows.pslist plugin. This plugin lists the current processes running in memory. This plugin outputs the offset, process name, PID, the number of threads and handles, and the date and time the process started and exited. Because the pslist plugin walks the doubly-linked list indicated by PsActiveProcessHead, it cannot detect hidden or unlinked processes. To execute this plugin, enter the following into the Command Prompt:
forensics@ubuntu:~/volatility3$ python3 vol.py -f /home/forensics/EvidenceFiles/MemoryImages/cridex.vmem windows.pslist
This will produce the following output:
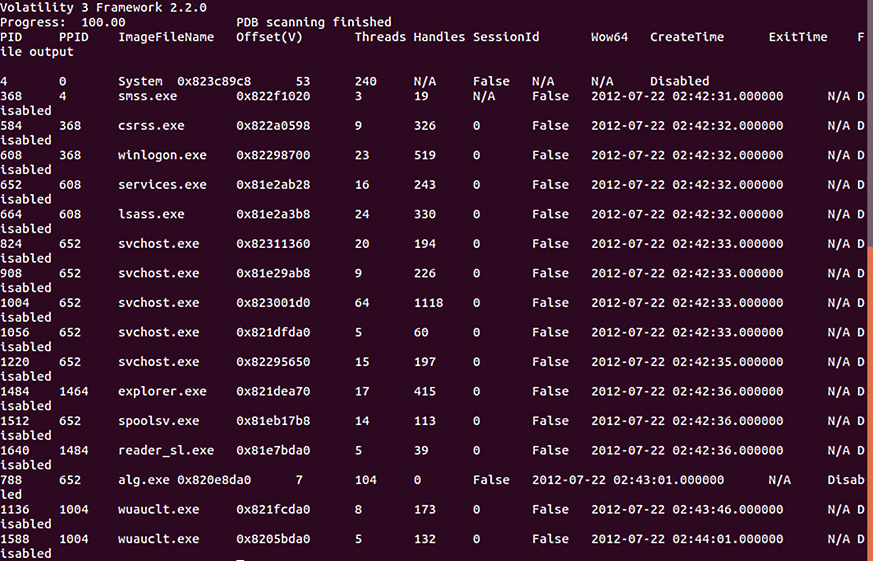
Figure 10.5 – Process list
An initial analysis of the output does show a suspicious entry. Based on a cursory examination, a file called reader_sl.exe was executed. This suspicion is largely based on the non-standard file name but as we get further into the process, we will get some more context and insight about this file.
Process scan
The windows.psscan plugin allows an analyst to examine processes that have been terminated. As we discussed previously, pslist only shows active processes. psscan can provide data about the possibility of a rootkit upon examining those processes that have been unlinked or hidden. The following command will execute the plugin:
forensics@ubuntu:~/volatility3$ python3 vol.py -f /home/forensics/EvidenceFiles/MemoryImages/cridex.vmem windows.psscan
This command produces the following output:
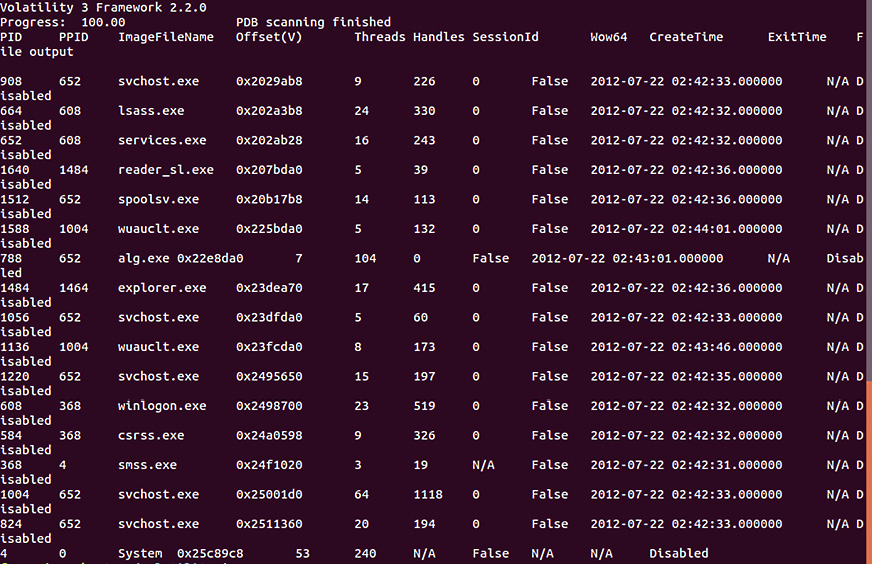
Figure 10.6 – Process scan
From the output of this plugin, it does not appear that any additional processes have exited. The responder can then start to look at the existing processes for any that may appear to be malicious.
Process tree
It is often necessary for responders to see what parent processes that child processes are executed under. One indicator of a system being compromised is the identification of a process executed outside the normal parent process. The windows.pstree plugin provides examiners with a tree-like structure that identifies the parent process that is executing a potential suspect process. The Cridex image is run with this plugin, utilizing the following command:
forensics@ubuntu:~/volatility3$ python3 vol.py -f /home/forensics/EvidenceFiles/MemoryImages/cridex.vmem windows.pstree
This command produces the following output:
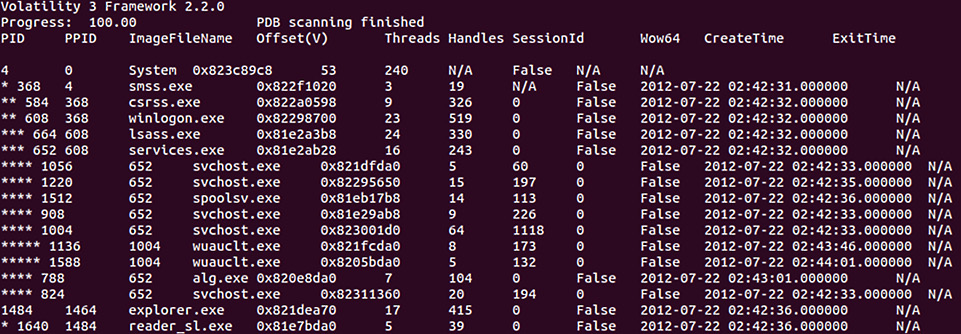
Figure 10.7 – Process tree
An analysis of the results from the three plugins shows an interesting entry. PID 1640 is associated with the reader_sl.exe executable. The responder may focus on this since it may not look like an application that should run. Further, the parent PID indicates that it was run via Windows Explorer:
Figure 10.8 – Suspicious processes
From here, the responder can supplement the existing process data with additional data, such as which DLLs are loaded and other ancillary data.
DLL list
Responders can also check the loaded DLL files associated with a process. This allows the analyst to determine whether a suspect process accessed these files when it was executed. For example, if a responder would like to examine the DLL files that are loaded as part of the suspect processes, PID 1640, the following command can be run:
forensics@ubuntu:~/volatility3$ python3 vol.py -f /home/forensics/EvidenceFiles/MemoryImages/cridex.vmem windows.dlllist --pid 1640
This command produces the following output:
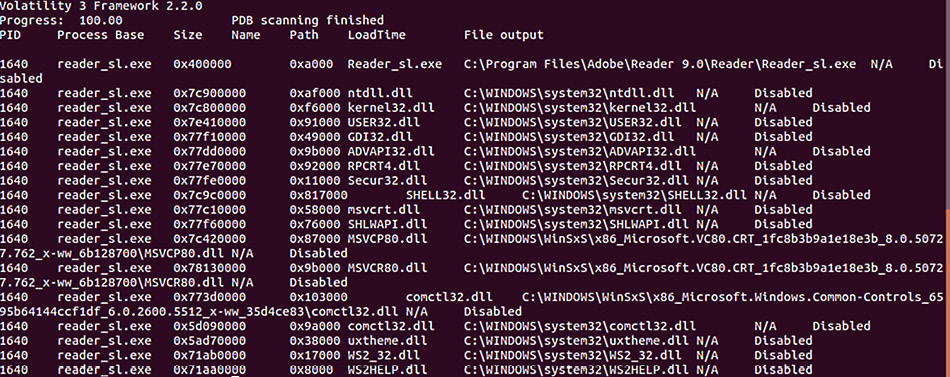
Figure 10.9 – Associated DLL files
From here, analysts may be able to determine some of the functionality of the process by analyzing the various DLL files that are loaded. Later in this chapter, these DLL files will be acquired for further examination.
The windows.handles plugin
The windows.handles plugin allows analysts to view what types of handles are open in an existing process. These handles are references to resources that are managed by the operating system. This data provides the responder with an understanding of the specific blocks of memory an application or process is using. This includes a wide variety of information, including registry keys and files associated with that process. To identify the open handles for PID 1640 that were previously identified, the following command can be used:
forensics@ubuntu:~/volatility3$ python3 vol.py -f /home/forensics/EvidenceFiles/MemoryImages/cridex.vmem windows.handles --pid 1640
This command produces the following output:
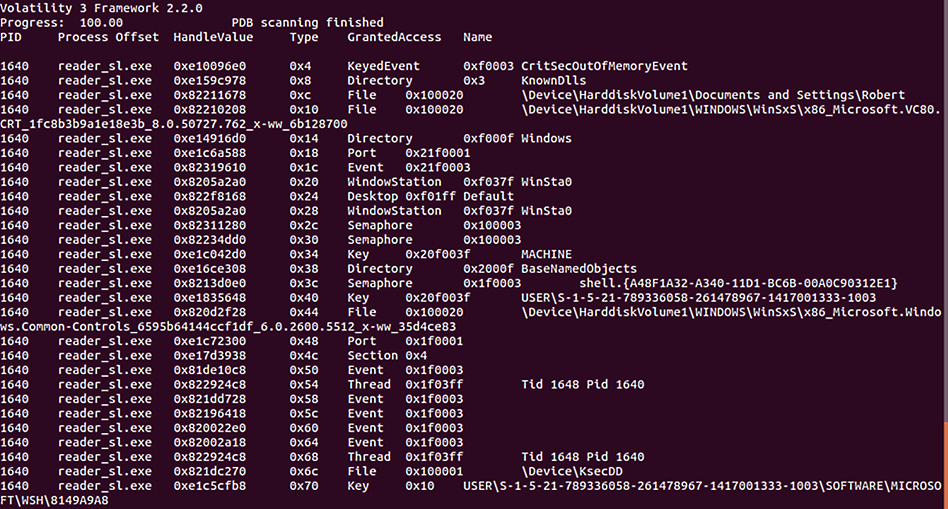
Figure 10.10 – Handles output
As the output indicates, the suspect process has several open handle processes, threads, and registry keys. These may become important data points moving forward and give some indication of the behavior of the reader_sl.exe executable.
LDR modules
A common practice with malware coders is attempting to hide the activities of the malware. One technique is to attempt to hide the DLL files associated with the malicious code. This can be accomplished by unlinking the suspect DLL from the Process Environment Block (PEB). While this may provide some obfuscation on the surface, there is still trace evidence of the DLL’s existence contained within the Virtual Address Descriptor (VAD). The VAD is a mechanism that identifies a DLL file’s base address and full path. The windows.ldrmodules plugin compares the list of processes and determines if they are in the PEB. The following command runs windows.ldrmodules against the Cridex image file:
forensics@ubuntu:~/volatility3$ python3 vol.py -f /home/forensics/EvidenceFiles/MemoryImages/cridex.vmem windows.ldrmodules –pid 1640
This produces the following output:
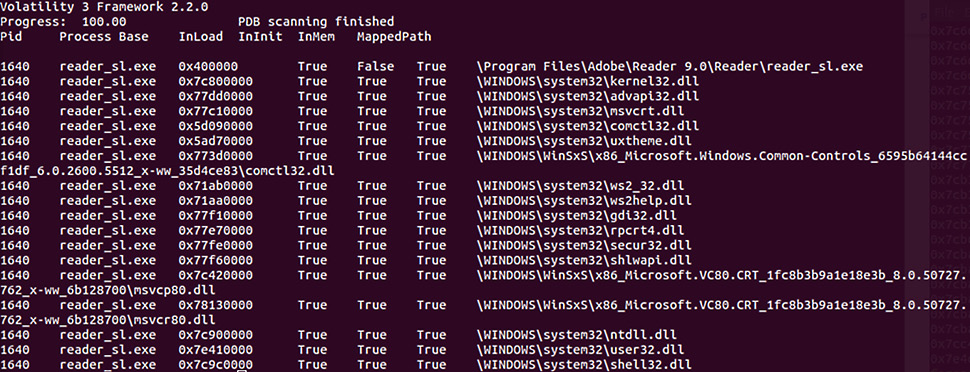
Figure 10.11 – LDR modules output
A review of the output reveals an interesting entry on the top line. From this output, the reader_sl.exe process does appear to have an issue associated with the DLL file. The indicator that this process is suspect is the False indicator in the InInit column for the first entry. This indicates that the executable has de-linked the DLL files and that the reader_sl.exe file warrants further investigation.
Malfind
Adversaries use a variety of code injection techniques to run malware. The Volatility windows.malfind plugin displays ranges within memory that may contain injected code. Run the following command:
forensics@ubuntu:~/volatility3$ python3 vol.py -f /home/forensics/EvidenceFiles/MemoryImages/cridex.vmem windows.malfind
This produces the following abridged output:
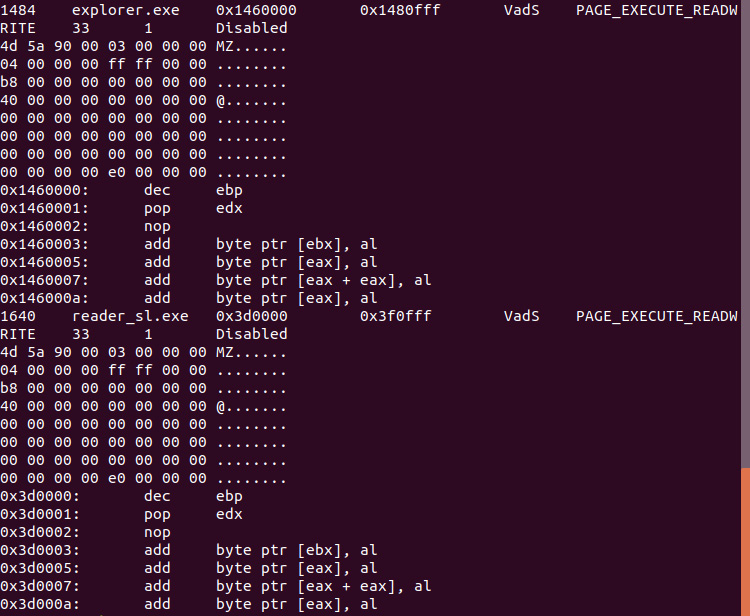
Figure 10.12 – Malfind output
In this screen capture, the two processes, explorer.exe and reader_sl.exe, are indicated as executable due to the MZ header for both files. The malfind plugin does not automatically indicate that the processes in question are malware but indicates further analysis should be conducted. In this case, we will look at extracting code associated with reader_sl.exe from memory, along with extracting the associated DLL files.
Dumpfiles
Now that we have identified the suspected file, reader_sl.exe, let’s use the windows.dumpfiles plugin. In this case, the plugin requires an output file. In this case, we will output the /home/forensics/EvidenceFiles/PID1640Dump directory. Finally, Process ID 1640 is used instead of a filename. The overall command looks like this:
forensics@ubuntu:~/volatility3$ python3 vol.py -f /home/forensics/EvidenceFiles/MemoryImages/cridex.vmem -o /home/forensics/EvidenceFiles/PID1640Dump/ windows.dumpfiles --pid 1640
This command outputs the following:
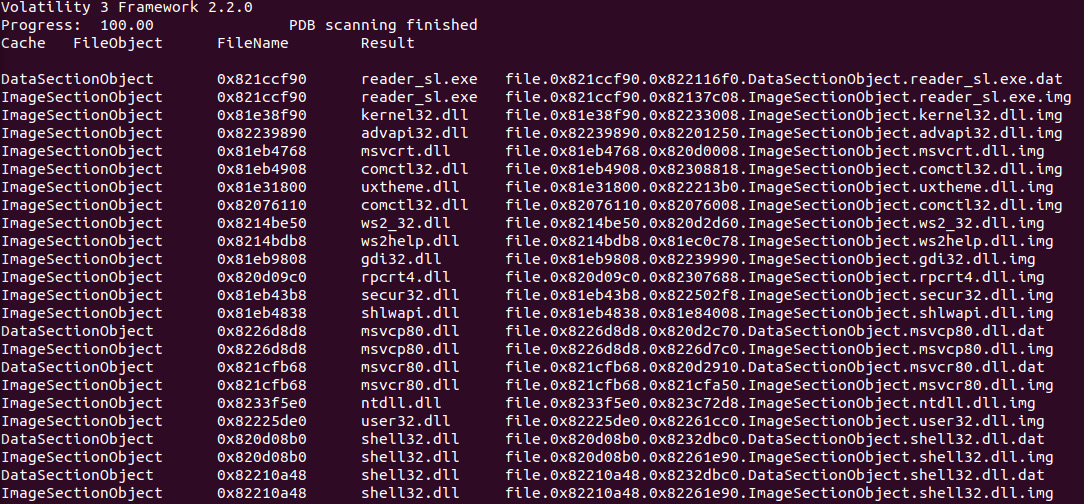
Figure 10.13 – Dumpfiles output
In this case, there are .dat and .img files for the reader_sl.exe executable, along with the corresponding DLL files. By examining the reader_sl.exe image file with a hex editor, we can see the header information:
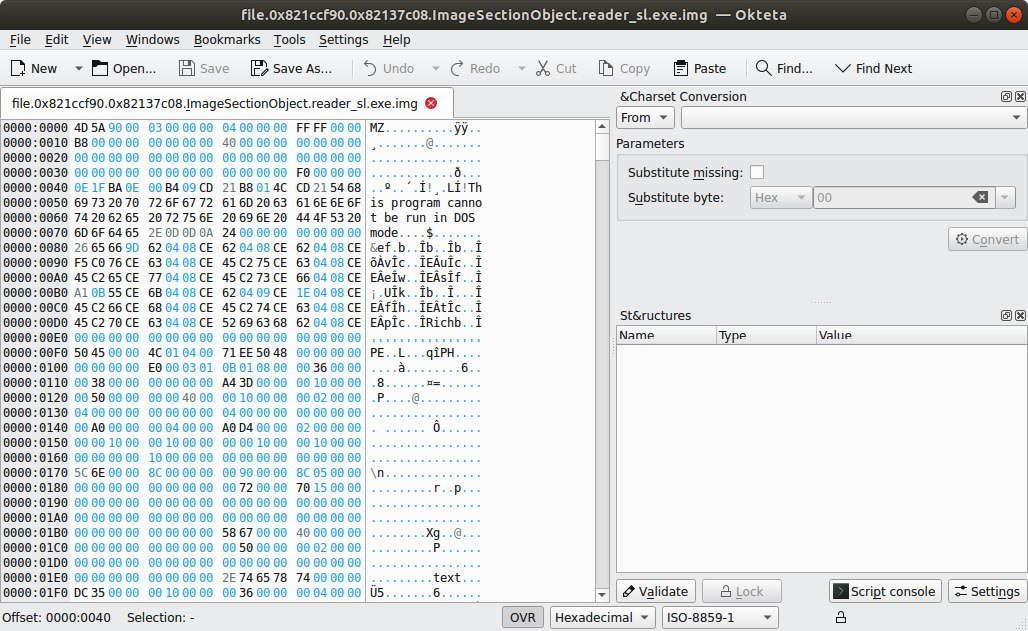
Figure 10.14 – Hex view of reader_sl.exe
Next, obtaining an MD5 hash of the file output allows us to search VirusTotal for any information about the file. The hash can be obtained by running the following command:
forensics@ubuntu:~/EvidenceFiles/PID1640Dump$ md5sum file.0x821ccf90.0x82137c08.ImageSectionObject.reader_sl.exe.img
This outputs the 2a63509ad62eeeed0564dcb0981d90e1 hash. A check of VirusTotal produces the following output:
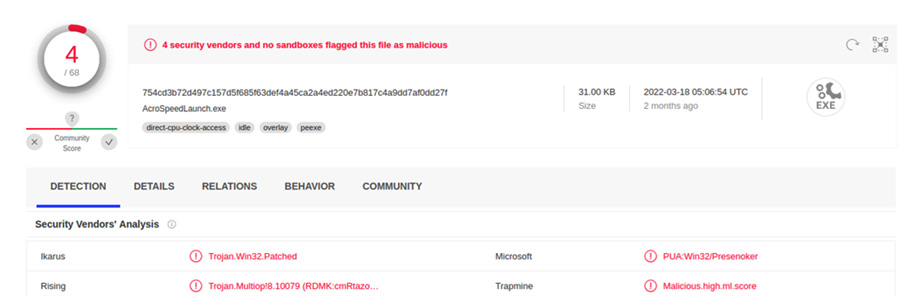
Figure 10.15 – VirusTotal results
While it might seem strange for there to only be anti-virus companies indicating that the file hash is malicious, this does bring up a point: Volatility will only output the code that is contained in memory and not the entire file. This is critical to keep in mind when extracting code. Even if the antivirus providers indicate it is not malicious, the file associated with the code may still be. Depending on the investigation, the data that’s extracted will have to go through a much more detailed malware analysis.
Volatility Workbench
One aspect of working with Volatility is using the command line. The main advantage of using Volatility in the command line is the ability to create scripts that automate the commands and output to text files. The drawback for analysts that are not used to working with Volatility and the command line is that they may need to continually reference commands or struggle with the correct syntax.
An option for analysts that may want a GUI-based version of Volatility is PassMark Software’s Volatility Workbench. This tool can be downloaded at https://www.osforensics.com/tools/volatility-workbench.html and installed on a Windows platform. Once installed, the GUI allows the analyst to navigate to the image file and set the Platform and the Command processes. Once those are set, the Volatility command can be run. For example, the windows.pslist plugin was run against a Windows memory capture:
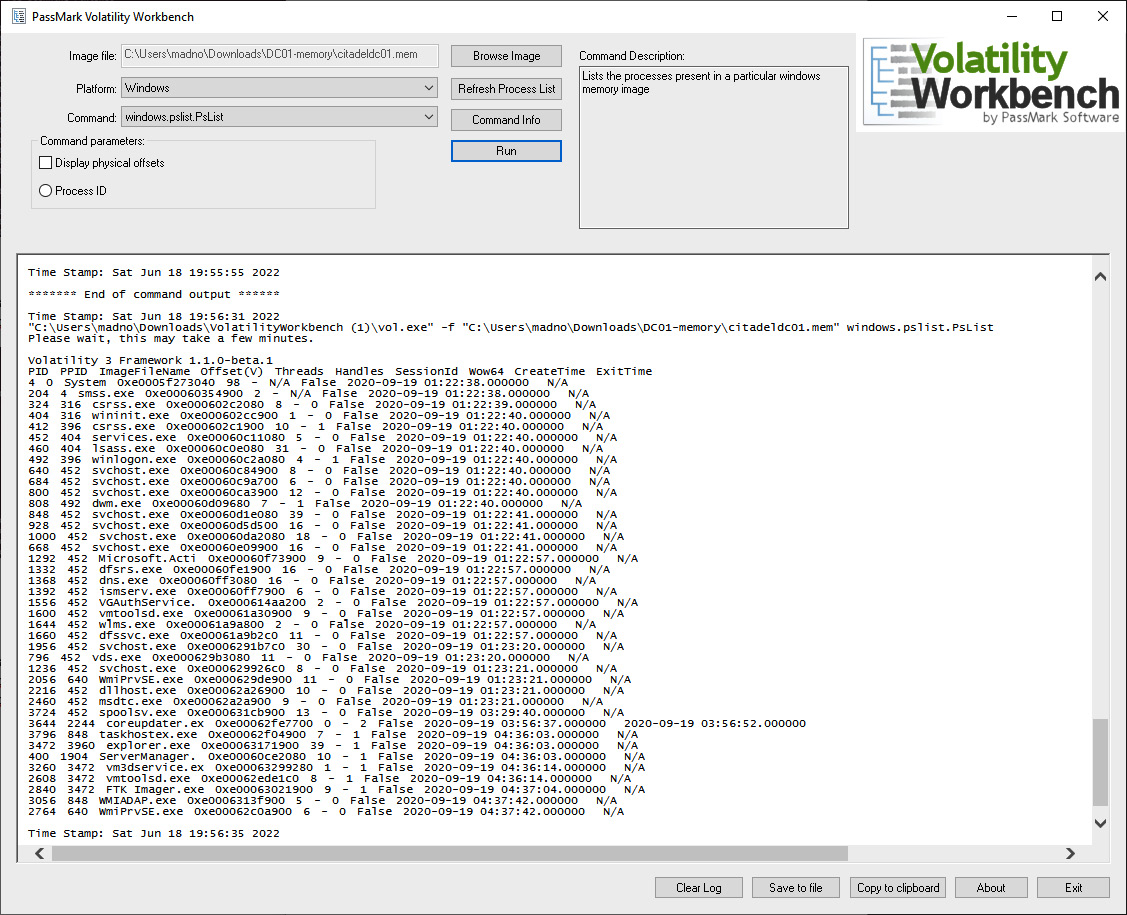
Figure 10.16 – Volatility Workbench
The tool also has additional functionality, such as logging all the commands and outputs, along with the ability to copy them to a clipboard so that the output can be included in the incident reporting. As stated previously, this is a solid option for analysts that do not need the additional functionality and flexibility of the command line.
Next, we will look at how to augment memory analysis using the simple Strings tool and GREP.
Memory analysis with Strings
In the previous section, the Volatility tools we looked at focused on those areas of the memory image that are mapped. If data is not mapped properly, these tools would be unable to extract the data and present it properly. This is one of the drawbacks of these tools for memory analysis. There is a good deal of data that will become unstructured and invisible to these tools. This could be the case when network connections are shut down or processes are exited. Even though they may not show up when the RAM is examined via Volatility, trace evidence will often still be present. Other evidence such as the pagefile also contains evidence that is unmapped and searchable.
One tool that is useful for extracting these traces is the Strings command, which is present in many Linux and Windows OSs. Strings allows a responder to search for human-readable strings of characters. Given a set of keywords or Global Regular Expression Print (GREP) commands, the responder may be able to extract additional relative data, even from RAM captures that may have been corrupted via malware or improper acquisitions.
Installing Strings
Strings will often come preinstalled in many Linux distributions. Windows has a standalone executable for string searches available at https://docs.microsoft.com/en-us/sysinternals/downloads/strings. If Strings is not installed on the Linux platform of choice for the responder, the following command will install it:
forensics@ubuntu:~$ sudo apt install binutils
For a rather simple tool, Strings is a powerful way to search through bulk data for specific keyword-based strings. In this book, the focus will be on extracting specific data points with the following Strings syntax:
forensics@ubuntu:~$ strings <file name> | grep <Regular Expression>
Common Strings searches
Network artifacts such as IP addresses and domains can often be found within the pagefile or memory. To find IP addresses, use the strings command with the following parameters:
forensics@ubuntu:~$ strings pagefile.sys | grep -oE "([0-9]{1,3}.){3}[0-9]{1,3}"To find URIs and URLs, use http or https, respectively:
forensics@ubuntu:~$ strings pagefile.sys | grep "^https?://" | sort | uniq | less
There are also remnants of email addresses that may be discoverable. This is very useful in investigating possible phishing attempts. To find email addresses, use the following command:
forensics@ubuntu:~$ strings pagefile.sys | egrep '([[:alnum:]_.-]{1,64}+@[[:alnum:]_.-]{2,255}+?.[[:alpha:].]{2,4})'There is a wide range of search terms and parameters, and it is impossible to cover all of them in this chapter. The main takeaway from this is that the analyst can leverage string searches across the memory image and pagefile as part of the overall memory analysis.
Summary
This chapter discussed two major topic areas of memory analysis. First, we covered the available data points and the methodology that can be followed. In addition, several tools, such as Volatility, Volatility Workbench, and Strings, have been explored. In addition to an overview of these tools, several of their features have been explored. This only scratches the surface of the number of features each of these tools has to offer the incident response analyst. These tools, taken in conjunction with a methodology for analyzing system RAM, can give the analyst a powerful tool for determining if a system has been compromised. With malware becoming more advanced, including malware that executes entirely in RAM, analysts must incorporate memory analysis into their capabilities. Marrying these techniques with network evidence collection can provide analysts and their organizations with a powerful tool to identify and remediate an incident.
In the next chapter, we will delve into examining a system’s permanent storage.
Questions
Answer the following questions to test your knowledge of this chapter:
- What are some of the data points that can be found via memory analysis?
- Running processes
- Network connection
- Command history
- All of the above
- What is not part of the network connections methodology?
- Process name
- Parent process ID
- Check for signs of a rootkit
- Associated entities
- Dumping files associated with a process will never introduce malware into a responder’s system.
- True
- False
- One of the primary goals of memory analysis is to acquire malicious processes or executables for further analysis.
- True
- False
Further reading
For more information about the topics covered in this chapter, refer to the following:
- SANS Memory Forensics Cheat Sheet: https://digital-forensics.sans.org/blog/2017/12/11/updated-memory-forensics-cheat-sheet
- The Art of Memory Forensics: https://www.memoryanalysis.net/amf