14. More Data Analysis
In This Chapter
• Creating an amortization schedule
• Auditing spreadsheet formulas
• Creating a frequency distribution
Quattro Pro contains a wide variety of analysis tools; in the last chapter, I introduced you to some of the tools you can use in a spreadsheet database, and you also saw a few tools you can use in a regular spreadsheet. In this chapter, we’ll explore some additional tools you might find useful in a regular spreadsheet.
We’ll start by walking through one of the tools available through the Analysis Expert. The Analysis Expert is a wizard that asks you to provide answers to questions needed to solve a mathematical formula. Using the Analysis Expert is a little like having a helper who figures out the story problem for you and then asks you for the numbers needed to solve the problem. Although there are 19 problems that the Analysis Expert can solve for you, we’ll examine one so that you can get a feel for how the Analysis Expert works.
Then we’ll look at some of the other commonly used analysis tools available in Quattro Pro. I’ll show you how to trace spreadsheet formulas to identify cells they affect and cells they are affected by. Then, I’ll show you how to start with the solution and figure out the variable of an equation. Last, we’ll create a frequency distribution—that tool used by teachers to help them figure out the grading curve.
Preparing an Amortization Schedule
Although the amount of your mortgage payment remains the same during the life of the mortgage, the amount of interest and the amount of principal vary with each payment. An amortization schedule like the one that appears in Figure 14.1 shows you the breakdown of each mortgage payment, identifying the portion of the payment that represents interest and the portion that represents principal.
Figure 14.1. The amortization schedule Quattro Pro can produce.
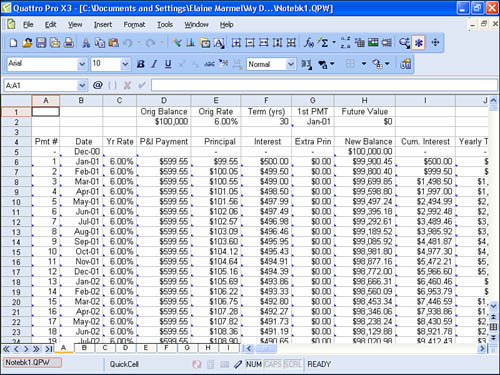
Why would you need an amortization schedule? Well, you could use an amortization schedule to double-check the statement your lender sends you at year-end that identifies the amount of interest you paid. Because mortgage interest is one of the few remaining deductions available to you, you do need to know how much interest you pay each year on your mortgage.
You can also use an amortization schedule to make extra principal payments on your mortgage, assuming that your loan has no prepayment penalty. Suppose, for example, that you pay the current month’s loan payment—principal and interest—and the next month’s principal only throughout the life of your mortgage. Making payments in this fashion will cut the term on your loan in half and you’ll end up paying half the total interest due; effectively, a 30-year mortgage will become a 15-year mortgage. Suppose that you decide to pay $100 each month in extra principal on a $100,000, 6%, 30-year loan with a regular payment amount of $599.55. You’ll end up making only 251 (of 360) payments of $699.55 with a final payment of $350.99. The total interest you pay over the life of the loan is $75,938.04, whereas you would have paid $115,838.45 if you made no extra principal payments.
Quattro Pro’s amortization schedule enables you to keep track of the effect extra principal payments have on your mortgage balance. You can type the amount of each extra principal payment you make in column G, and Quattro Pro will recalculate your loan term and payments.
To create an amortization schedule, start in a blank spreadsheet. Open the Tools menu, point to Numeric Tools, and click Analysis Tools. The Analysis Experts Step 1 of 3 screen appears (see Figure 14.2).
Figure 14.2. Use this screen to select the analysis tool you want to use.
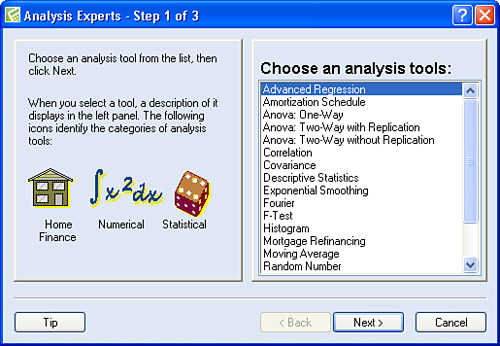
Click Amortization Schedule in the list on the right. The title of the screen changes to indicate that there are only two steps when you use the Amortization Schedule tool. Click Next. The Analysis Experts Step 2 of 2 screen appears (see Figure 14.3).
Figure 14.3. Use this screen to set the parameters of your loan.
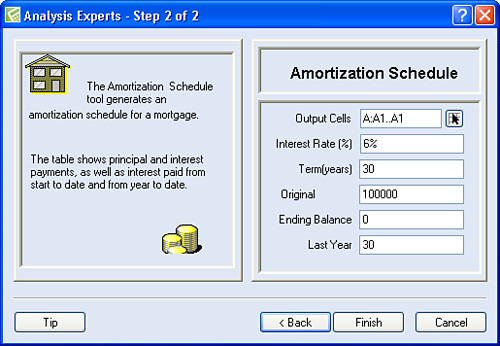
You can leave the Output Cells location set to cell A1; Quattro Pro will fill in the amortization schedule information starting at the location and using as much space as needed. If any data exists in the range Quattro Pro needs to use, Quattro Pro will ask if it can overwrite the data in those cells. To avoid the question and problem of losing data, I suggested earlier that you start in a blank spreadsheet.
- Type the interest rate for your loan in the Interest Rate (%) box, and be sure to include the percent sign when you type the rate.
- Type the length of the loan in years in the Term (years) box.
- Type the amount of the loan in the Original box.
- Leave zero (0) in the Ending Balance box.
- In the Last Year box, type the same number you typed in the Term (years) box.
- When you click Finish, Quattro Pro creates an amortization schedule like the one you saw in Figure 14.1.
Auditing Spreadsheet Formulas
Okay, now here’s one I know you’ll appreciate. Suppose that you’ve got a complex spreadsheet that contains lots of formulas. When you look at the numbers, you see results because that’s what Quattro Pro displays. And, while you could format the cells to view the formulas, in fact, you really want to know, at a glance, what cells on the spreadsheet are included in a particular formula. You also want to know what formula uses a particular cell. By auditing your spreadsheet, you can find out.
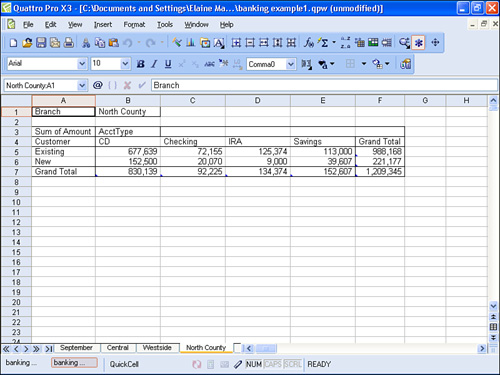
To make this easy for you to see, I’ll use a simple spreadsheet like the one shown in Figure 14.4 instead of a complex spreadsheet. In the figure, the grand totals in column F are the sums of the values in rows 5, 6, and 7 respectively. Similarly, the grand totals in row 7 are the sums of the values in Columns B, C, D, E and F respectively.
Figure 14.4. A typical spreadsheet in which you can identify the cells used in each formula.
To identify the cells used by a formula, you trace the formula’s precedents in Quattro Pro. Select a cell containing a formula; in Figure 14.5, I selected B7. Then, open the Tools menu, point to Auditing, and click Trace Precedents.
Figure 14.5. Tracing precedents for a formula.
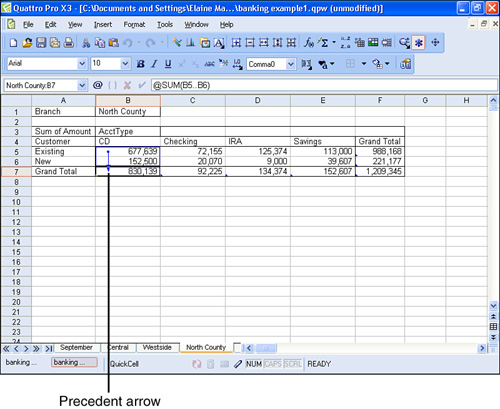
Quattro Pro draws a blue arrow; the head of the arrow points to the selected cell and the other end of the arrow starts at the first cell included in the formula; the line of the arrow runs through the other cells included in the formula. The arrow tells you that the formula in cell B7 uses the values stored in B5 and B6.
Now suppose that you want to know the formulas that use a particular value. To test for dependents, as you do in this test, you can select any cell on the spreadsheet; you don’t need to select a cell that contains a formula. In Figure 14.6, I’ve selected C6. Open the Tools menu, point to Auditing, and click Trace Dependents.
Figure 14.6. Tracing cells that depend on the selected cell.
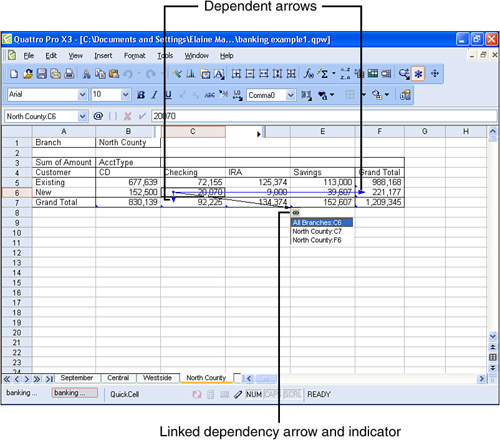
Quattro Pro draws blue arrows; the heads of the arrows point at cells that contain formulas that include the selected cell. You may also see a black arrow with a small gray box containing a chain link attached at the head of the arrow. This black arrow and the icon displaying the chain link indicate that a formula on another spreadsheet in the notebook or in another notebook uses the selected cell.
Tip

If you click the icon containing the link, Quattro Pro displays the addresses of the cells involved in the link. You can click any cell address to switch to that cell.
To remove auditing arrows, open the Tools menu, point to Auditing, and click Remove All Arrows.
Solving for a Variable
I like this one; this is the one where you already have the answer and you just need to know what number to plug into the formula to get the answer.
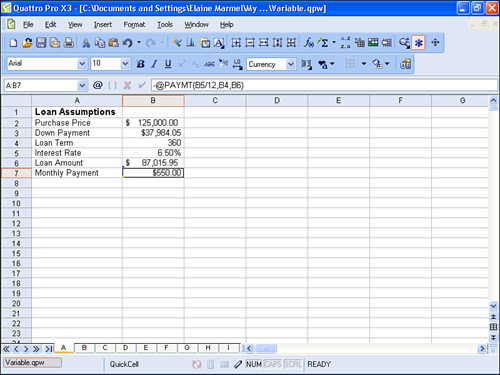
Suppose, for example, that you’re buying a new home. The purchase price on the home is $125,000 and the interest rate the mortgage company is offering is 6.5%. If you assume that you’ll put nothing down, your monthly mortgage payment would be $790.09 on a 30-year, fixed-rate mortgage.
But suppose that you have some extra cash and you don’t want to be house-poor with a monthly payment that is larger than you really want to pay. In fact, suppose that you want to pay only $550 per month. How much would you need to put down to have a monthly payment of $550?
In Figure 14.7, I set up the purchase price of the loan in B2. I left B3 empty. The term of the loan—12 months/year times 30 years equals 360 months—appears in B4, and the interest rate appears in B5. In B6, I entered a formula that subtracts the contents of B3 from B2. And, in B7, I used the PAYMT function, which uses the monthly interest rate (B5/12), the loan term (B4), and the loan amount (B6) as variables. Now, I want to know how to make the result of B7 equal $550. I’ll also find out how much I need to put down and what my loan amount will be when I make this calculation.
Figure 14.7. How much should I put down—and subsequently borrow—to end up with a monthly payment of $550?

Open the Tools menu, point to Numeric Tools, and click Solve For. The Solve For dialog box appears (see Figure 14.8).
Figure 14.8. Use this dialog box to identify the value of a variable when you already know the solution.
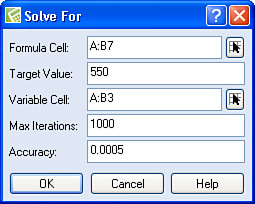
In the Formula Cell box, use the Range Picker to select the cell that contains the formula you’re solving; I selected B7.
In the Target Value box, type the value you want the formula to result in; for this example, I typed 550.

In the Max Iterations box, you can specify the number of passes Quattro Pro can make to solve the formula. In the Accuracy box, you can specify how close you want Quattro Pro to be to the target number.
In the Variable Cell box, use the Range Picker to select the cell that Quattro Pro can change to arrive at the result you specified in the Target Value box; I selected B3, the down payment amount.
Click OK. Quattro Pro sets the Monthly Payment amount at the value you specified in the Solve For dialog box. Quattro Pro also fills in the value needed for the down payment. And, because my formula for the Loan Amount subtracted the down payment from the Purchase Price, Quattro Pro updates my loan amount also (see Figure 14.9).
Figure 14.9. Quattro Pro sets the result of the formula to the value you specified and then calculates the variable(s) needed to achieve the result.
Creating a Frequency Distribution
Teachers aren’t the only ones who use frequency distributions, but their purpose is certainly the most well known. A frequency distribution helps you identify the number of values in a list that fall between two numbers you specify.
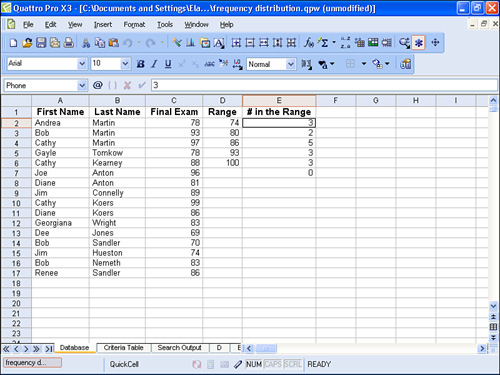
Suppose, for example, that you gave a final exam and the scores resemble those in column C of the spreadsheet shown in Figure 14.10.
Figure 14.10. A spreadsheet set up to create a frequency distribution.
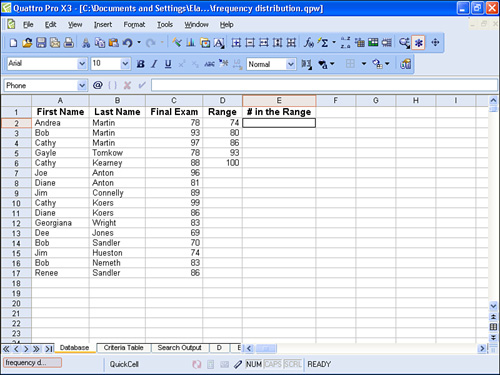
To create a frequency distribution, you need to establish ranges of values called bin values that represent groupings. When Quattro Pro calculates the frequency distribution, it displays numbers beside each bin value that tell you how many of the original values were less than or equal to the corresponding bin value. In my final exam example, the bin values will tell me how many test scores were below 74, how many were between 75 and 80, how many were between 81 and 86, how many were between 87 and 93, and how many were between 93 and 100.
Be sure to set up your bin value column so that
• The bin values run from lowest to highest.
• The column beside the bin values is blank.
Open the Tools menu, point to Numeric Tools, and click Frequency. Quattro Pro displays the Frequency Tables dialog box (see Figure 14.11).
Figure 14.11. Use this dialog box to set up a frequency distribution.
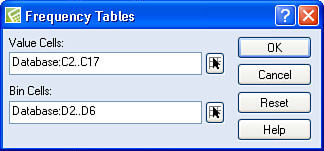
In the Value Cells box, click the Range Picker and select the values you want to count; in this example, I selected the final exam scores that appear in C2.C17.
In the Bin Cells box, click the Range Picker and select the cells containing the bin values; in this example, I selected D2.D6.
Tip
Quattro Pro always adds one extra value at the end of the bin range that represents the number of values in the list you evaluated that were greater than the highest number in the bin value list.
Click OK. For this example, Quattro Pro displays the number of values in the Final Exam column that fell into each grouping represented by the bin values; based on the grouping in Figure 14.12, I’ve got a very nice bell curve going, with most test scores falling between 81 and 86.
Figure 14.12. The frequency distribution tells me how many test scores fell within each range.