Chapter 6. Fires and Explosions
Chemicals present a substantial hazard in the form of fires and explosions. The combustion of one gallon of toluene can destroy an ordinary chemistry laboratory in minutes; persons present may be killed. The potential consequences of fires and explosions in pilot plants and plant environments are even greater.
The three most common chemical plant accidents are fires, explosions, and toxic releases, in that order (see Chapter 1). Organic solvents are the most common source of fires and explosions in the chemical industry.
Chemical and hydrocarbon plant losses resulting from fires and explosions are substantial, with yearly property losses in the United States estimated at almost $300 million (1997 dollars).1 Additional losses in life and business interruptions are also substantial. To prevent accidents resulting from fires and explosions, engineers must be familiar with
• The fire and explosion properties of materials,
• The nature of the fire and explosion process, and
• Procedures to reduce fire and explosion hazards.
In this chapter we cover the first two topics, emphasizing definitions and calculation methods for estimating the magnitude and consequences of fires and explosions. We discuss procedures to reduce fire and explosion hazards in Chapter 7.
6-1. The Fire Triangle
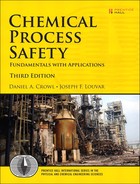
The essential elements for combustion are fuel, an oxidizer, and an ignition source. These elements are illustrated by the fire triangle, shown in Figure 6-1.
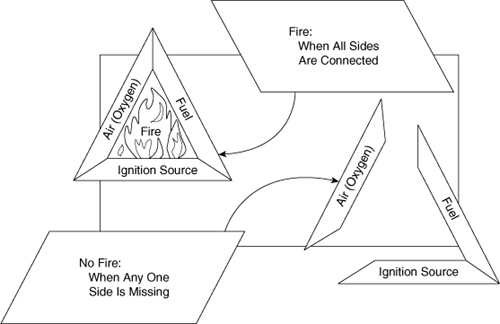
Figure 6-1. The fire triangle.
Fire, or burning, is the rapid exothermic oxidation of an ignited fuel. The fuel can be in solid, liquid, or vapor form, but vapor and liquid fuels are generally easier to ignite. The combustion always occurs in the vapor phase; liquids are volatized and solids are decomposed into vapor before combustion.
When fuel, oxidizer, and an ignition source are present at the necessary levels, burning will occur. This means a fire will not occur if (1) fuel is not present or is not present in sufficient quantities, (2) an oxidizer is not present or is not present in sufficient quantities, and (3) the ignition source is not energetic enough to initiate the fire.
Two common examples of the three components of the fire triangle are wood, air, and a match; and gasoline, air, and a spark. However, other, less obvious combinations of chemicals can lead to fires and explosions. Various fuels, oxidizers, and ignition sources common in the chemical industry are
Fuels
Liquids: gasoline, acetone, ether, pentane
Solids: plastics, wood dust, fibers, metal particles
Gases: acetylene, propane, carbon monoxide, hydrogen
Oxidizers
Gases: oxygen, fluorine, chlorine
Liquids: hydrogen peroxide, nitric acid, perchloric acid
Solids: metal peroxides, ammonium nitrite
Ignition sources
Sparks, flames, static electricity, heat
In the past the sole method for controlling fires and explosions was elimination of or reduction in ignition sources. Practical experience has shown that this is not robust enough—the ignition energies for most flammable materials are too low and ignition sources too plentiful. As a result, current practice is to prevent fires and explosions by continuing to eliminate ignition sources while focusing efforts strongly on preventing flammable mixtures.
6-2. Distinction between Fires and Explosions
The major distinction between fires and explosions is the rate of energy release. Fires release energy slowly, whereas explosions release energy rapidly, typically on the order of microseconds. Fires can also result from explosions, and explosions can result from fires.
A good example of how the energy release rate affects the consequences of an accident is a standard automobile tire. The compressed air within the tire contains energy. If the energy is released slowly through the nozzle, the tire is harmlessly deflated. If the tire ruptures suddenly and all the energy within the compressed tire releases rapidly, the result is a dangerous explosion.
6-3. Definitions
Some of the commonly used definitions related to fires and explosions are given in what follows. These definitions are discussed in greater detail in later sections.
Combustion or fire: Combustion or fire is a chemical reaction in which a substance combines with an oxidant and releases energy. Part of the energy released is used to sustain the reaction.
Ignition: Ignition of a flammable mixture may be caused by a flammable mixture coming in contact with a source of ignition with sufficient energy or the gas reaching a temperature high enough to cause the gas to autoignite.
Autoignition temperature (AIT): A fixed temperature above which adequate energy is available in the environment to provide an ignition source.
Flash point (FP): The flash point of a liquid is the lowest temperature at which it gives off enough vapor to form an ignitable mixture with air. At the flash point the vapor will burn but only briefly; inadequate vapor is produced to maintain combustion. The flash point generally increases with increasing pressure.
There are several different experimental methods used to determine flash points. Each method produces a somewhat different value. The two most commonly used methods are open cup and closed cup, depending on the physical configuration of the experimental equipment. The open-cup flash point is a few degrees higher than the closed-cup flash point.
Fire point: The fire point is the lowest temperature at which a vapor above a liquid will continue to burn once ignited; the fire point temperature is higher than the flash point.
Flammability limits: Vapor-air mixtures will ignite and burn only over a well-specified range of compositions. The mixture will not burn when the composition is lower than the lower flammable limit (LFL); the mixture is too lean for combustion. The mixture is also not combustible when the composition is too rich, that is, when it is above the upper flammable limit (UFL). A mixture is flammable only when the composition is between the LFL and the UFL. Commonly used units are volume percent fuel (percentage of fuel plus air).
Lower explosion limit (LEL) and upper explosion limit (UEL) are used interchangeably with LFL and UFL.
Explosion: An explosion is a rapid expansion of gases resulting in a rapidly moving pressure or shock wave. The expansion can be mechanical (by means of a sudden rupture of a pressurized vessel), or it can be the result of a rapid chemical reaction. Explosion damage is caused by the pressure or shock wave.
Mechanical explosion: An explosion resulting from the sudden failure of a vessel containing high-pressure nonreactive gas.
Deflagration: An explosion in which the reaction front moves at a speed less than the speed of sound in the unreacted medium.
Detonation: An explosion in which the reaction front moves at a speed greater than the speed of sound in the unreacted medium.
Confined explosion: An explosion occurring within a vessel or a building. These are most common and usually result in injury to the building inhabitants and extensive damage.
Unconfined explosion: Unconfined explosions occur in the open. This type of explosion is usually the result of a flammable gas release. The gas is dispersed and mixed with air until it comes in contact with an ignition source. Unconfined explosions are rarer than confined explosions because the explosive material is frequently diluted below the LFL by wind dispersion. These explosions are destructive because large quantities of gas and large areas are frequently involved.
Boiling-liquid expanding-vapor explosion (BLEVE): A BLEVE occurs if a vessel that contains a liquid at a temperature above its atmospheric pressure boiling point ruptures. The subsequent BLEVE is the explosive vaporization of a large fraction of the vessel contents, possibly followed by combustion or explosion of the vaporized cloud if it is combustible. This type of explosion occurs when an external fire heats the contents of a tank of volatile material. As the tank contents heat, the vapor pressure of the liquid within the tank increases and the tank’s structural integrity is reduced because of the heating. If the tank ruptures, the hot liquid volatilizes explosively.
Dust explosion: This explosion results from the rapid combustion of fine solid particles. Many solid materials (including common metals such as iron and aluminum) become flammable when reduced to a fine powder.
Shock wave: An abrupt pressure wave moving through a gas. A shock wave in open air is followed by a strong wind; the combination of shock wave and wind is called a blast wave. The pressure increase in the shock wave is so rapid that the process is mostly adiabatic.
Overpressure: The pressure on an object as a result of an impacting shock wave.
Figure 6-2 is a plot of concentration versus temperature and shows how several of these definitions are related. The exponential curve in Figure 6-2 represents the saturation vapor pressure curve for the liquid material. Typically, the UFL increases and the LFL decreases with temperature. The LFL theoretically intersects the saturation vapor pressure curve at the flash point, although experimental data do not always agree with this. The autoignition temperature is actually the lowest temperature of an autoignition region. The behavior of the autoignition region and the flammability limits at higher temperatures are not known.
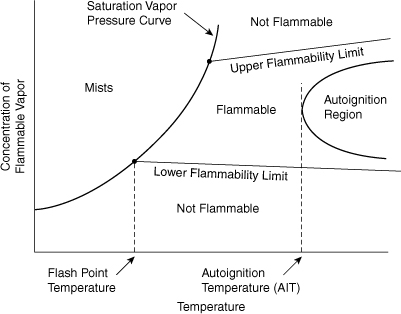
Figure 6-2. Relationships between various flammability properties.
The flash point and flammability limits are not fundamental properties but are defined only by the specific experimental apparatus and procedure used.
6-4. Flammability Characteristics of Liquids and Vapors
Flammability characteristics of some important organic chemicals (liquids and gases) are provided in Appendix B.
Liquids
The flash point temperature is one of the major quantities used to characterize the fire and explosion hazard of liquids.
Flash point temperatures are determined using an open-cup apparatus, shown in Figure 6-3. The liquid to be tested is placed in the open cup. The liquid temperature is measured with a thermometer while a Bunsen burner is used to heat the liquid. A small flame is established on the end of a movable wand. During heating, the wand is slowly moved back and forth over the open liquid pool. Eventually a temperature is reached at which the liquid is volatile enough to produce a flammable vapor, and a momentary flashing flame occurs. The temperature at which this first occurs is called the flash point temperature. Note that at the flash point temperature only a momentary flame occurs; a higher temperature, called the fire point temperature, is required to produce a continuous flame.
Figure 6-3. Cleveland open-cup flash point determination. The test flame applicator is moved back and forth horizontally over the liquid sample.
The problem with open-cup flash point procedures is that air movements over the open cup may change the vapor concentrations and increase the experimentally determined flash point. To prevent this, most modern flash point methods employ a closed-cup procedure. For this apparatus a small, manually opened shutter is provided at the top of the cup. The liquid is placed in a preheated cup and allowed to sit for a fixed time period. The shutter is then opened and the liquid is exposed to the flame. Closed-cup methods typically result in lower flash points.
Satyanarayana and Rao2 showed that the flash point temperatures for pure materials correlate well with the boiling point of the liquid. They were able to fit the flash point for over 1200 compounds with an error of less than 1% using the equation
where
Tf is the flash point temperature (K),
a, b, and c are constants provided in Table 6-1 (K), and
Table 6-1. Constants Used in Equation 6-1 for Predicting the Flash Pointa
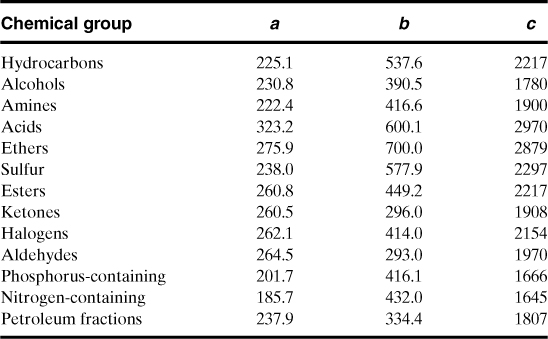
a K. Satyanarayana and P. G. Rao, “Improved Equation to Estimate Flash Points of Organic Compounds,” Journal of Hazardous Materials (1992), 32: 81–85.
Tb is the boiling point temperature of the material (K).
Flash points can be estimated for multicomponent mixtures if only one component is flammable and if the flash point of the flammable component is known. In this case the flash point temperature is estimated by determining the temperature at which the vapor pressure of the flammable component in the mixture is equal to the pure component vapor pressure at its flash point. Experimentally determined flash points are recommended for multicomponent mixtures with more than one flammable component.
Methanol has a flash point of 54°F, and its vapor pressure at this temperature is 62 mm Hg. What is the flash point of a solution containing 75% methanol and 25% water by weight?
The mole fractions of each component are needed to apply Raoult’s law. Assuming a basis of 100 lb of solution, we can construct the following:
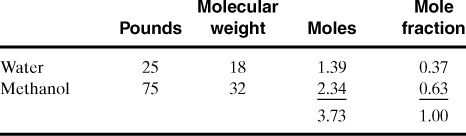
Raoult’s law is used to compute the vapor pressure (Psat) of pure methanol, based on the partial pressure required to flash:
p = xPsat
Psat = p/x = 62/0.63 = 98.4 mm Hg.
Using a graph of the vapor pressure versus temperature, shown in Figure 6-4, the flash point of the solution is 20.5°C, or 68.9°F.
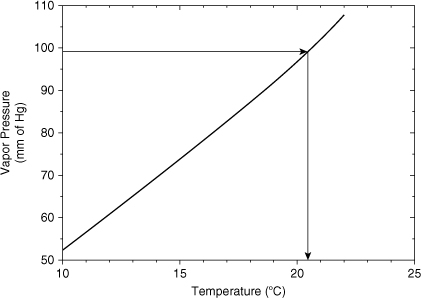
Figure 6-4. Saturation vapor pressure for methanol.
Gases and Vapors
Flammability limits for vapors are determined experimentally in a specially designed closed vessel apparatus (see Figure 6-15 on page 278). Vapor-air mixtures of known concentration are added and then ignited. The maximum explosion pressure is measured. This test is repeated with different concentrations to establish the range of flammability for the specific gas. Figure 6-5 shows the results for methane.
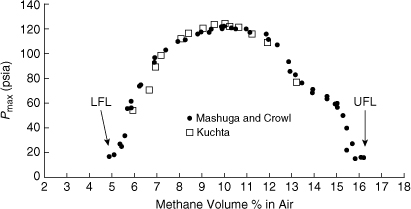
Figure 6-5. Maximum pressure for methane combustion in a 20-L sphere. The flammability limits are defined at 1 psig maximum pressure. Data from C. V. Mashuga and D. A. Crowl, “Application of the Flammability Diagram for Evaluation of Fire and Explosion Hazards of Flammable Vapors,” Process Safety Progress (1998), 17(3): 176–183; and J. M. Kuchta, Investigation of Fire and Explosion Accidents in the Chemical, Mining, and Fuel-Related Industries: A Manual, US Bureau of Mines Report 680 (Washington, DC: US Bureau of Mines, 1985).
Vapor Mixtures
Frequently LFLs and UFLs for mixtures are needed. These mixture limits are computed using the Le Chatelier equation:3

where
LFLi is the lower flammable limit for component i (in volume %) of component i in fuel and air,
yi is the mole fraction of component i on a combustible basis, and
n is the number of combustible species.
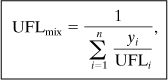
where UFLi is the upper flammable limit for component i (in volume %) of component i in fuel and air.
Le Chatelier’s equation is empirically derived and is not universally applicable. Mashuga and Crowl4 derived Le Chatelier’s equation using thermodynamics. The derivation shows that the following assumptions are inherent in this equation:
• The product heat capacities are constant.
• The number of moles of gas is constant.
• The combustion kinetics of the pure species is independent and unchanged by the presence of other combustible species.
• The adiabatic temperature rise at the flammability limit is the same for all species.
These assumptions were found to be reasonably valid at the LFL and less so at the UFL.
Proper usage of Le Chatelier’s rule requires flammability limit data at the same temperature and pressure. Also, flammability data reported in the literature may be from disparate sources, with wide variability in the data. Combining data from these disparate sources may cause unsatisfactory results, which may not be obvious to the user.
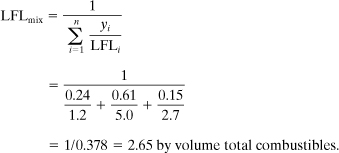
What are the LFL and UFL of a gas mixture composed of 0.8% hexane, 2.0% methane, and 0.5% ethylene by volume?
The mole fractions on a fuel-only basis are calculated in the following table. The LFL and UFL data are obtained from Appendix B.
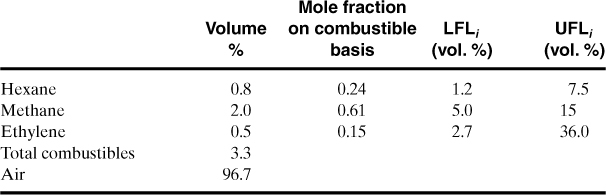
Equation 6-2 is used to determine the LFL of the mixture:
Equation 6-3 is used to determine the UFL of the mixture:
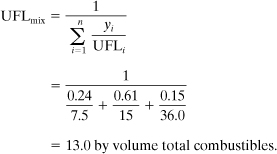
Because the mixture contains 3.3% total combustibles, it is flammable.
Flammability Limit Dependence on Temperature
In general, the flammability range increases with temperature.5 The following empirically derived equations are available for vapors:
where
ΔHc is the net heat of combustion (kcal/mole) and
T is the temperature (°C).
Equations (6-4) and (6-5) are very approximate and only work for a very limited number of hydrocarbons over a limited temperature range. The 0.75 is actually 100 Cp.
Flammability Limit Dependence on Pressure
Pressure has little effect on the LFL except at very low pressures (<50 mm Hg absolute), where flames do not propagate.
The UFL increases significantly as the pressure is increased, broadening the flammability range. An empirical expression for the UFL for vapors as a function of pressure is available:6
where
P is the pressure (megapascals absolute) and
UFL is the upper flammable limit (volume % of fuel plus air at 1 atm).
If the UFL for a substance is 11.0% by volume at 0.0 MPa gauge, what is the UFL at 6.2 MPa gauge?
The absolute pressure is P = 6.2 + 0.101 = 6.301 MPa. The UFL is determined using Equation 6-6:
UFLP = UFL + 20.6(log P + 1)
= 11.0 + 20.6(log 6.301 + 1)
= 48 vol. % fuel in air.
Estimating Flammability Limits
For some situations it may be necessary to estimate the flammability limits without experimental data. Flammability limits are easily measured; experimental determination is always recommended.
Jones7 found that for many hydrocarbon vapors the LFL and the UFL are a function of the stoichiometric concentration (Cst) of fuel:
where Cst is volume % fuel in fuel plus air.
The stoichiometric concentration for most organic compounds is determined using the general combustion reaction
It follows from the stoichiometry that
where z has units of moles O2/mole fuel.
Additional stoichiometric and unit changes are required to determine Cst as a function of z:
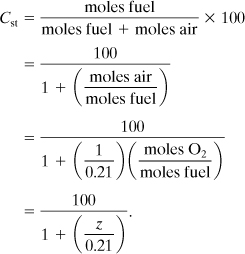
Substituting z and applying Equations 6-7 and 6-8 yields
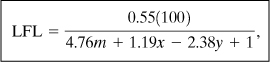
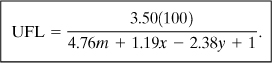
Another method8,9 correlates the flammability limits as a function of the heat of combustion of the fuel. A good fit was obtained for 123 organic materials containing carbon, hydrogen, oxygen, nitrogen, and sulfur. The resulting correlations are
LFL and UFL are the lower and upper flammable limits (volume % fuel in air), respectively, and
ΔHc is the heat of combustion for the fuel (in 103 kJ/mol).
Equation 6-13 is applicable only over the UFL range of 4.9–23%. If the heat of combustion is provided in kcal/mol, it can be converted to kJ/mol by multiplying by 4.184.
The prediction capability of Equations 6-6 through 6-13 is only modest at best. For hydrogen the predictions are poor. For methane and the higher hydrocarbons the results are improved. Thus these methods should be used only for a quick initial estimate and should not replace actual experimental data.
Estimate the LFL and the UFL for hexane, and compare the calculated limits to the actual values determined experimentally.
The stoichiometry is
and z, m, x, and y are found by balancing this chemical reaction using the definitions in Equation 6-9:
m = 6,
x = 14,
y = 0.
The LFL and the UFL are determined by using Equations 6-10 and 6-11:
LFL = 0.55(100)/[4.76(6) + 1.19(14) + 1]
= 1.19 vol. % versus 1.2 vol. % actual,
UFL = 3.5(100)/[4.76(6) + 1.19(14) + 1]
= 7.57 vol. % versus 7.5 vol. % actual.
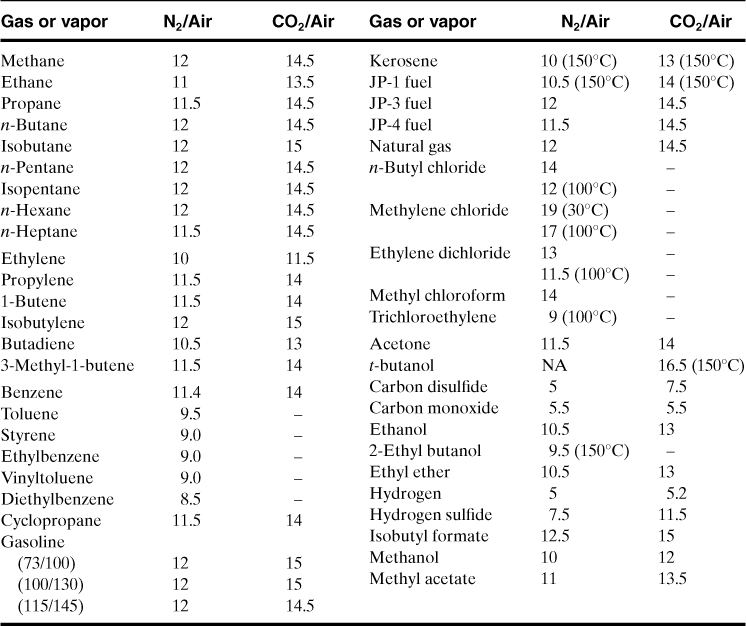
Flammability limits, in general, are defined in air. As you will see later, flammable limits in pure oxygen are frequently useful for designing systems to prevent fires and explosions. Combustion in pure oxygen also exhibits a lower oxygen limit (LOL) and an upper oxygen limit (UOL), just like the LFL and UFL in air. These flammable limits have units of percent fuel in oxygen. Table 6-2 presents flammability data for a variety of fuels in pure oxygen.
Table 6-2. Flammability Limits in Pure Oxygena
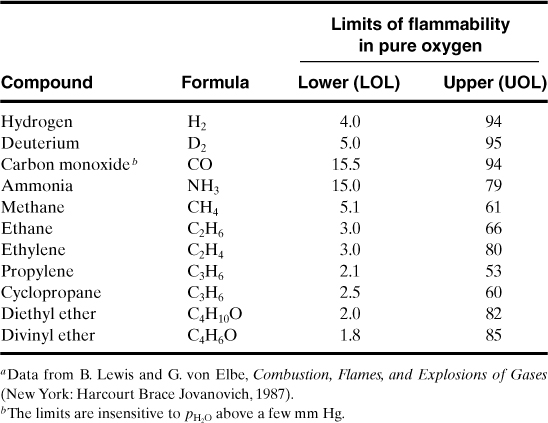
In general, for most common hydrocarbons the LOL is close to the LFL.
Hansen and Crowl10 derived an empirical equation for the UOL based on drawing lines along the flammable boundaries. They found that a good estimate of the UOL can be found from
where
UOL is the upper oxygen limit (vol. % fuel in oxygen),
UFL is the upper flammable limit (vol. % fuel in air),
UFLO is the oxygen concentration at the upper flammable limit (vol. % oxygen in air), and
CUOL is a fitting constant.
This equation only requires UFL data. Hansen and Crowl found a good fit of Equation 6-14 for a number of fuels using CUOL = –1.87.
Estimate the UOL for methane using Equation 6-14.
From Appendix B, the UFL for methane is 15.0 vol. % fuel in air, so UFL = 15%. If we select a basis of 100 moles of gas mixture, then 15 moles are methane and the remaining 85 moles are air. Of the 85 moles of air, (0.21)(85) = 17.85 moles of oxygen. Thus, UFLO = 17.85%. Substituting into Equation 6-14:
This compares to the experimental value of 61% shown in Table 6-3.
Table 6-3. Limiting Oxygen Concentrations (LOCs) (volume percent oxygen concentration above which combustion can occur)a
aData from NFPA 68, Venting of Deflagrations (Quincy, MA: National Fire Protection Association, 1994).
6-5. Limiting Oxygen Concentration and Inerting
The LFL is based on fuel in air. However, oxygen is the key ingredient and there is a minimum oxygen concentration required to propagate a flame. This is an especially useful result, because explosions and fires can be prevented by reducing the oxygen concentration regardless of the concentration of the fuel. This concept is the basis for a common procedure called inerting (see Chapter 7).
Below the limiting oxygen concentration (LOC) the reaction cannot generate enough energy to heat the entire mixture of gases (including the inert gases) to the extent required for the self-propagation of the flame.
The LOC has also been called the minimum oxygen concentration (MOC), the maximum safe oxygen concentration (MSOC), and other names.
Table 6-3 contains LOC values for a number of materials. The LOC depends on the inert gas species.
The LOC has units of percentage of moles of oxygen in total moles. If experimental data are not available, the LOC is estimated using the stoichiometry of the combustion reaction and the LFL. This procedure works for many hydrocarbons.
Estimate the LOC for butane (C4H10).
The stoichiometry for this reaction is
C4H10 + 6.5O2 → 4CO2 + 5H2O.
The LFL for butane (from Appendix B) is 1.8% by volume. From the stoichiometry
The combustion of butane is preventable by adding nitrogen, carbon dioxide, or even water vapor until the oxygen concentration is below 11.7%. The addition of water, however, is not recommended because any condition that condenses water would move the oxygen concentration back into the flammable region.
Example 6-6 shows that the LOC can be estimated using the equation
Equation 6-15 does not produce very good results.
Hansen and Crowl11 found that a better estimate of the LOC is given by
where
LOC is the limiting oxygen concentration (percent oxygen),
LFL is the lower flammable limit (percent fuel in air),
UFL is the upper flammable limit (percent fuel in air),
UFLO is the oxygen concentration at the upper flammable limit (vol% oxygen in air), and
CLOC is a fitting constant.
Data analysis of numerous experimental values found that CLOC = –1.11 gave a good fit for many hydrocarbons.
Estimate the LOC for butane using Equation 6-16. Compare to the results of Example 6-6.
From Appendix B for butane, LFL = 1.8%, UFL = 8.5%. The oxygen concentration at the upper flammable limit is
UFLo = (0.21)(100 – 8.5) = 19.21% oxygen.
Substituting into Equation 6-16,
This compares to the experimental value of 12% shown in Table 6-3. Equation 6-15 produces a value of 11.7%, which is lower than the experimental value.
6-6. Flammability Diagram
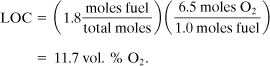
A general way to represent the flammability of a gas or vapor is by the triangle diagram shown in Figure 6-6. Concentrations of fuel, oxygen, and inert material (in volume or mole %) are plotted on the three axes. Each apex of the triangle represents either 100% fuel, oxygen, or nitrogen. The tick marks on the scales show the direction in which the scale moves across the figure. Thus point A represents a mixture composed of 60% methane, 20% oxygen, and 20% nitrogen. The zone enclosed by the dashed line represents all mixtures that are flammable. Because point A lies outside the flammable zone, a mixture of this composition is not flammable.
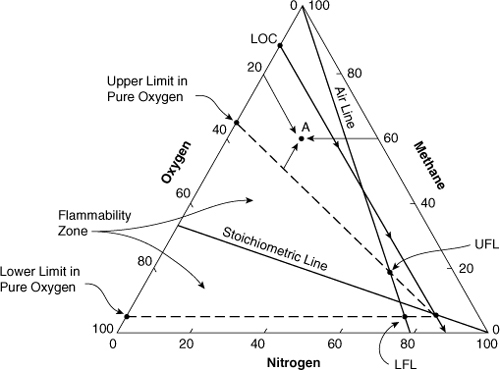
Figure 6-6. Flammability diagram for methane at an initial temperature and pressure of 25°C and 1 atm. Source: C. V. Mashuga and D. A. Crowl, “Application of the Flammability Diagram,” 176–183.
The air line represents all possible combinations of fuel plus air. The air line extends from the point where fuel is 0%, oxygen is 21%, and nitrogen is 79% to the point where fuel is 100%, oxygen is 0%, and nitrogen is 0%. The equation for this line is
The stoichiometric line represents all stoichiometric combinations of fuel plus oxygen. The combustion reaction can be written in the form
where z is the stoichiometric coefficient for oxygen. The intersection of the stoichiometric line with the oxygen axis (in volume % oxygen) is given by
Equation 6-19 is derived by realizing that on the oxygen axis no nitrogen is present. Thus the moles present are fuel (1 mole) plus oxygen (z moles). The total moles are thus 1 + z, and the mole or volume percent of oxygen is given by Equation 6-15.
The stoichiometric line extends from a point where the fuel is 100/(1 + z), oxygen is 100z/(1 + z), and nitrogen is 0% to a point where fuel is 0%, oxygen is 0%, and nitrogen is 100%. The equation for the stoichiometric line is
The LOC is also shown in Figure 6-6. Clearly, any gas mixture containing oxygen below the LOC is not flammable.
The shape and size of the flammability zone on a flammability diagram change with a number of parameters, including fuel type, temperature, pressure, and inert species. Thus the flammability limits and the LOC also change with these parameters.
Appendix C derives several equations that are useful for working with flammability diagrams. These results show that:
1. If two gas mixtures R and S are combined, the resulting mixture composition lies on a line connecting the points R and S on the flammability diagram. The location of the final mixture on the straight line depends on the relative moles in the mixtures combined: If mixture S has more moles, the final mixture point will lie closer to point S. This is identical to the lever rule used for phase diagrams.
2. If a mixture R is continuously diluted with mixture S, the mixture composition follows along the straight line between points R and S on the flammability diagram. As the dilution continues, the mixture composition moves closer and closer to point S. Eventually, at infinite dilution the mixture composition is at point S.
3. For systems having composition points that fall on a straight line passing through an apex corresponding to one pure component, the other two components are present in a fixed ratio along the entire line length.
4. The LOC can be estimated by reading the oxygen concentration at the intersection of the stoichiometric line and a horizontal line drawn through the LFL (see Appendix C). This is equivalent to the equation
These results are useful for tracking the gas composition during a process operation to determine whether a flammable mixture exists during the procedure. For example, consider a storage vessel containing pure methane whose inside walls must be inspected as part of its periodic maintenance procedure. For this operation the methane must be removed from the vessel and replaced by air for the inspection workers to breathe. The first step in the procedure is to depressurize the vessel to atmospheric pressure. At this point the vessel contains 100% methane, represented by point A in Figure 6-7. If the vessel is opened and air is allowed to enter, the composition of gas within the vessel will follow the air line in Figure 6-7 until the vessel gas composition eventually reaches point B, pure air. Note that at some point in this operation the gas composition passes through the flammability zone. If an ignition source of sufficient strength were present, then a fire or explosion would result.
Figure 6-7. The gas concentration during an operation to remove a vessel from service.
The procedure is reversed for placing the vessel back into service. In this case the procedure begins at point B in Figure 6-7, with the vessel containing air. If the vessel is closed and methane is pumped in, then the gas composition inside the vessel will follow the air line and finish at point A. Again, the mixture is flammable as the gas composition moves through the flammability zone.
An inerting procedure can be used to avoid the flammability zone for both cases. This is discussed in more detail in Chapter 7.
The determination of a complete flammability diagram requires several hundred tests using a specific testing apparatus (see Figure 6-15 on page 278). Diagrams with experimental data for methane, ethylene, and hydrogen are shown in Figures 6-8 to 6-10, respectively. Data in the center region of the flammability zone are not available because the maximum pressure exceeds the pressure rating of the vessel or because unstable combustion or a transition to detonation is observed there. For these data a mixture is considered flammable if the pressure increase after ignition is greater than 7% of the original ambient pressure, in accordance with ASTM E918.12 Note that many more data points are shown than are required to define the flammability limits. This was done to obtain a more complete understanding of the pressure versus time behavior of the combustion over a wide range of mixtures. This information is important for mitigation of the explosion.
Figure 6-8. Experimental flammability diagram for methane. Source: C. V. Mashuga, Ph.D. dissertation, Michigan Technological University, 1999.
Figure 6-9. Experimental flammability diagram for ethylene. Source: C. V. Mashuga, Ph.D. dissertation, Michigan Technological University, 1999.
Figure 6-10. Experimental flammability diagram for hydrogen. This is a different geometry but still conveys the same information. (Source: Y. D. Jo and D. A. Crowl, Michigan Technological University, 2006.)
Figure 6-10 is a different geometry from Figures 6-8 and 6-9 but still conveys the same information. Note that the oxygen axis is diagonal, while the nitrogen and hydrogen axes are rectangular. The LFL (about 4% fuel) is still shown as the lower intersection of the flammability zone with the air line, and the UFL (about 75% fuel) is the upper intersection of the flammaility zone with the air line. The LOC is the oxygen diagonal that just touches the flammability zone—in this case about 5% oxygen. Some people prefer this form of the triangle diagram since it is easier to plot—the nitrogen and fuel are the x and y axes, respectively.
A number of important features are shown in Figures 6-8 to 6-10. First, the size of the flammability zone increases from methane to ethylene to hydrogen—the UFL is correspondingly higher. Second, the combustion of the methane and ethylene produces copious amounts of soot in the upper fuel-rich parts of the flammability zone. There is no soot with hydrogen because there is no carbon. Finally, the lower boundary of the flammability zone is mostly horizontal and can be approximated by the LFL.
For most flammable materials, detailed experimental data of the type shown in Figures 6-8 to 6-10 are unavailable. Several methods have been developed to approximate the flammability zone:
Method 1 (Figure 6-11): Given the flammability limits in air, the LOC, and flammability limits in pure oxygen, the procedure is as follows:
1. Draw flammability limits in air as points on the air line.
2. Draw flammability limits in pure oxygen as points on the oxygen scale.
3. Use Equation 6-19 to locate the stoichiometric point on the oxygen axis, and draw the stoichiometric line from this point to the 100% nitrogen apex.
4. Locate the LOC on the oxygen axis, and draw a line parallel to the fuel axis until it intersects with the stoichiometric line. Draw a point at this intersection.
5. Connect all the points shown.
Figure 6-11. Method 1 for the approximation of the flammability zone.
The flammability zone derived from this approach is only an approximation of the actual zone. Note that the lines defining the zone limits in Figures 6-8 to 6-10 are not exactly straight. This method also requires flammability limits in pure oxygen—data that are not readily available. Flammability limits in pure oxygen for a number of common hydrocarbons are provided in Table 6-2.
Method 2 (Figure 6-12): Given the flammability limits in air and the LOC, the procedure is as follows: Use steps 1, 3, and 4 from method 1. In this case only the points at the nose of the flammability zone can be connected. The flammability zone from the air line to the oxygen axis cannot be detailed without additional data, although it extends all the way to the oxygen axis and typically expands in size. The lower boundary can also be approximated by the LFL.
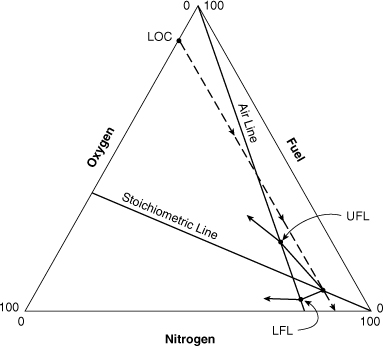
Figure 6-12. Method 2 for the approximation of the flammability zone. Only the area to the right of the air line can be determined.
Method 3 (Figure 6-13): Given the flammability limits in air, the procedure is as follows: Use steps 1 and 3 from method 1. Estimate the LOC using Equation 6-15 or 6-16. This is only an estimate, and usually (but not always) provides a conservative LOC.
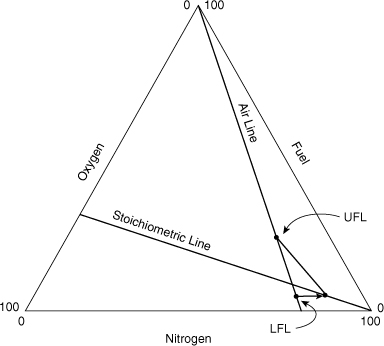
Figure 6-13. Method 3 for the approximation of the flammability zone. Only the area to the right of the air line can be determined.
6-7. Ignition Energy
The minimum ignition energy (MIE) is the minimum energy input required to initiate combustion. All flammable materials (including dusts) have MIEs. The MIE depends on the specific chemical or mixture, the concentration, pressure, and temperature. A few MIEs are given in Table 6-4.
Table 6-4. Minimum Ignition Energy for Selected Gasesa
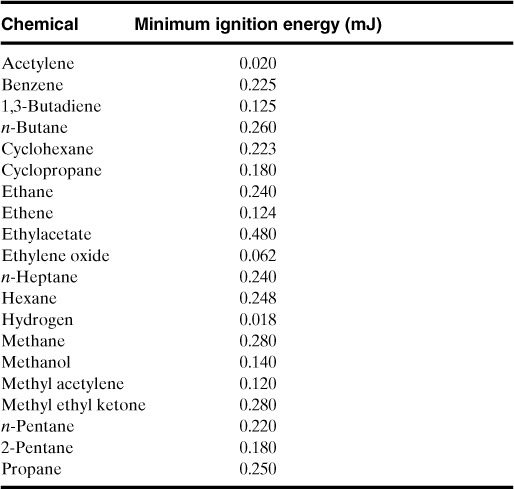
a Data from I. Glassman, Combustion, 3rd ed. (New York: Academic Press, 1996).
Experimental data indicate that
• The MIE decreases with an increase in pressure
• The MIE of dusts is, in general, at energy levels somewhat higher than combustible gases
• An increase in the nitrogen concentration increases the MIE
Many hydrocarbons have MIEs of about 0.25 mJ. This is low compared with sources of ignition. For example, a static discharge of 22 mJ is initiated by walking across a rug, and an ordinary spark plug has a discharge energy of 25 mJ. Electrostatic discharges, as a result of fluid flow, also have energy levels exceeding the MIEs of flammable materials and can provide an ignition source, contributing to plant explosions (see Chapter 7).
6-8. Autoignition
The autoignition temperature (AIT) of a vapor, sometimes called the spontaneous ignition temperature (SIT), is the temperature at which the vapor ignites spontaneously from the energy of the environment. The autoignition temperature is a function of the concentration of vapor, volume of vapor, pressure of the system, presence of catalytic material, and flow conditions. It is essential to experimentally determine AITs at conditions as close as possible to process conditions.
Composition affects the AIT; rich or lean mixtures have higher AITs. Larger system volumes decrease AITs; an increase in pressure decreases AITs; and increases in oxygen concentration decrease AITs. This strong dependence on conditions illustrates the importance of exercising caution when using AIT data.
AIT data are provided in Appendix B.
6-9. Auto-Oxidation
Auto-oxidation is the process of slow oxidation with accompanying evolution of heat, sometimes leading to autoignition if the energy is not removed from the system. Liquids with relatively low volatility are particularly susceptible to this problem. Liquids with high volatility are less susceptible to autoignition because they self-cool as a result of evaporation.
Many fires are initiated as a result of auto-oxidation, referred to as spontaneous combustion. Some examples of auto-oxidation with a potential for spontaneous combustion include oils on a rag in a warm storage area, insulation on a steam pipe saturated with certain polymers, and filter aid saturated with certain polymers (cases have been recorded where 10-year-old filter aid residues were ignited when the land-filled material was bulldozed, allowing auto-oxidation and eventual autoignition).
These examples illustrate why special precautions must be taken to prevent fires that can result from auto-oxidation and autoignition.
6-10. Adiabatic Compression
An additional means of ignition is adiabatic compression. For example, gasoline and air in an automobile cylinder will ignite if the vapors are compressed to an adiabatic temperature that exceeds the autoignition temperature. This is the cause of preignition knock in engines that are running too hot and too lean.
Several large accidents have been caused by flammable vapors being sucked into the intake of air compressors; subsequent compression resulted in autoignition. A compressor is particularly susceptible to autoignition if it has a fouled after-cooler. Safeguards must be included in the process design to prevent undesirable fires that can result from adiabatic compression.
The adiabatic temperature increase for an ideal gas is computed from the thermodynamic adiabatic compression equation:
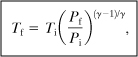
where
Tf is the final absolute temperature,
Ti is the initial absolute temperature,
Pf is the final absolute pressure,
Pi is the initial absolute pressure, and
γ = Cp/Cv.
The potential consequences of adiabatic temperature increases within a chemical plant are illustrated in the following two examples.
What is the final temperature after compressing air over liquid hexane from 14.7 psia to 500 psia if the initial temperature is 100°F? The AIT of hexane is 487°C (Appendix B), and γ for air is 1.4.
From Equation 6-21 we have
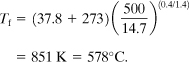
This temperature exceeds the AIT for hexane, resulting in an explosion.
The lubricating oil in piston-type compressors is always found in minute amounts in the cylinder bore; compressor operations must always be maintained well below the AIT of the oil to prevent explosion.
A particular lubricating oil has an AIT of 400°C. Compute the compression ratio required to raise the temperature of air to the AIT of this oil. Assume an initial air temperature of 25°C and 1 atm.
Equation 6-21 applies. Solving for the compression ratio, we obtain
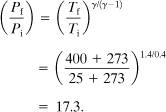
This ratio represents an output pressure of only (17.3)(14.7 psia) = 254 psia. The actual compression ratio or pressure should be kept well below this.
These examples illustrate the importance of careful design, careful monitoring of conditions, and the need for periodic preventive maintenance programs when working with flammable gases and compressors. This is especially important today, because high-pressure process conditions are becoming more common in modern chemical plants.
6-11. Ignition Sources13
As illustrated by the fire triangle, fires and explosions can be prevented by eliminating ignition sources. Various ignition sources were tabulated for over 25,000 fires by the Factory Mutual Engineering Corporation and are summarized in Table 6-5. The sources of ignition are numerous; consequently it is impossible to identify and eliminate them all. The main reason for rendering a flammable liquid inert, for example, is to prevent a fire or explosion by ignition from an unidentified source. Although all sources of ignition are not likely to be identified, engineers must still continue to identify and eliminate them.
Table 6-5. Ignition Sources of Major Firesa
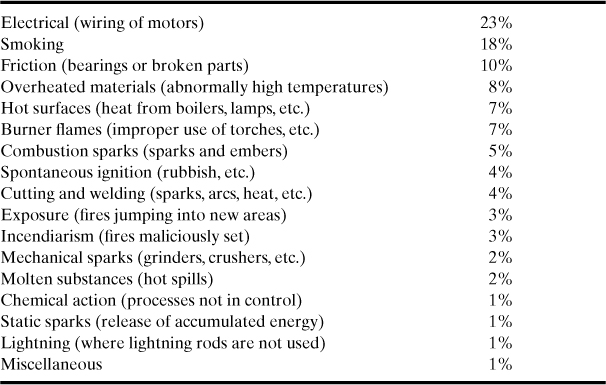
a Accident Prevention Manual for Industrial Operations.
Some special situations might occur in a process facility where it is impossible to avoid flammable mixtures. In these cases a thorough safety analysis is required to eliminate all possible ignition sources in each of the units where flammable gases are present.
The elimination of the ignition sources with the greatest probability of occurrence (see Table 6-5) should be given the greatest attention. Combinations of sources must also be investigated. The goal is to eliminate or minimize ignition sources because the probability of a fire or explosion increases rapidly as the number of ignition sources increases. The effort required increases significantly as the size of the plant increases; potential ignition sources may be in the thousands.
6-12. Sprays and Mists14
Static electricity is generated when mists or sprays pass through orifices. A charge may accumulate and discharge in a spark. If flammable vapors are present, a fire or explosion will occur.
Mists and sprays also affect flammability limits.15 For suspensions with drop diameters less than 0.01 mm, the LFL is virtually the same as the substance in vapor form. This is true even at low temperatures where the liquid is nonvolatile and no vapor is present. Mists of this type are formed by condensation.
For mechanically formed mists with drop diameters between 0.01 mm and 0.2 mm the LFL decreases as the drop diameter increases. In experiments with larger drop diameters the LFL was less than one-tenth of the normal LFL. This is important when inerting in the presence of mists.
When sprays have drop diameters between 0.6 mm and 1.5 mm, flame propagation is impossible. In this situation, however, the presence of small drops and/or disturbances that shatter the larger drops may create a hazardous condition.
6-13. Explosions
Explosion behavior depends on a large number of parameters. A summary of the more important parameters is shown in Table 6-6.
Table 6-6. Parameters Significantly Affecting the Behavior of Explosions
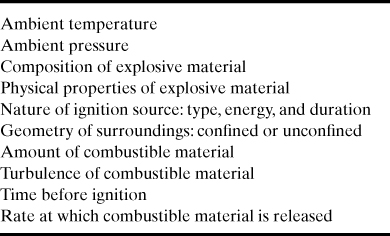
Explosion behavior is difficult to characterize. Many approaches to the problem have been undertaken, including theoretical, semiempirical, and empirical studies. Despite these efforts, explosion behavior is still not completely understood. Practicing engineers, therefore, should use extrapolated results cautiously and provide a suitable margin of safety in all designs.
An explosion results from the rapid release of energy. The energy release must be sudden enough to cause a local accumulation of energy at the site of the explosion. This energy is then dissipated by a variety of mechanisms, including formation of a pressure wave, projectiles, thermal radiation, and acoustic energy. The damage from an explosion is caused by the dissipating energy.
If the explosion occurs in a gas, the energy causes the gas to expand rapidly, forcing back the surrounding gas and initiating a pressure wave that moves rapidly outward from the blast source. The pressure wave contains energy, which results in damage to the surroundings. For chemical plants much of the damage from explosions is due to this pressure wave. Thus, in order to understand explosion impacts, we must understand the dynamics of the pressure wave.
A pressure wave propagating in air is called a blast wave because the pressure wave is followed by a strong wind. A shock wave or shock front results if the pressure front has an abrupt pressure change. A shock wave is expected from highly explosive materials, such as TNT, but it can also occur from the sudden rupture of a pressure vessel. The maximum pressure over ambient pressure is called the peak overpressure.
Detonation and Deflagration
The damage effects from an explosion depend highly on whether the explosion results from a detonation or a deflagration. The difference depends on whether the reaction front propagates above or below the speed of sound in the unreacted gases. For ideal gases the speed of sound or sonic velocity is a function of temperature only and has a value of 344 m/s (1129 ft/s) at 20°C. Fundamentally, the sonic velocity is the speed at which information is transmitted through a gas.
In some combustion reactions the reaction front is propagated by a strong pressure wave, which compresses the unreacted mixture in front of the reaction front above its autoignition temperature. This compression occurs rapidly, resulting in an abrupt pressure change or shock in front of the reaction front. This is classified as a detonation, resulting in a reaction front and leading shock wave that propagates into the unreacted mixture at or above the sonic velocity.
For a deflagration the energy from the reaction is transferred to the unreacted mixture by heat conduction and molecular diffusion. These processes are relatively slow, causing the reaction front to propagate at a speed less than the sonic velocity.
Figure 6-14 shows the physical differences between a detonation and a deflagration for a combustion reaction that occurs in the gas phase in the open. For a detonation the reaction front moves at a speed greater than the speed of sound. A shock front is found a short distance in front of the reaction front. The reaction front provides the energy for the shock front and continues to drive it at sonic or greater speeds.
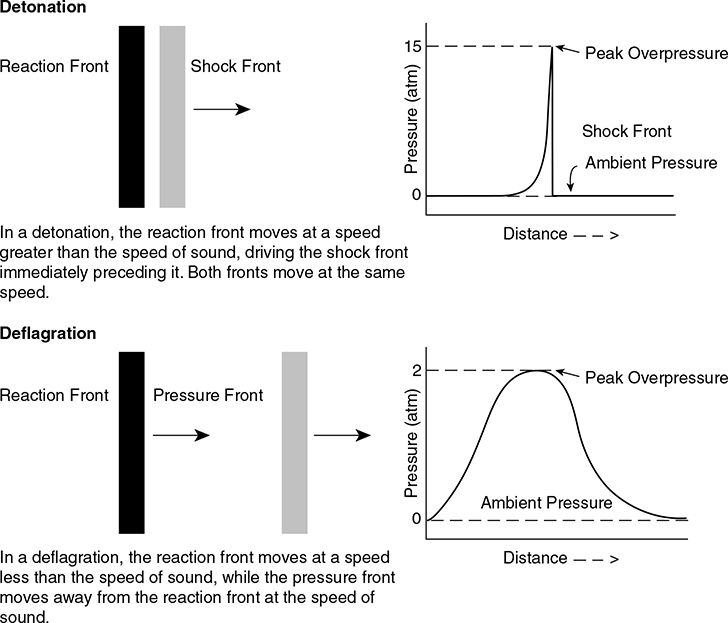
Figure 6-14. Comparison of detonation and deflagration gas dynamics. The explosion is initiated to the far left.
For a deflagration the reaction front propagates at a speed less than the speed of sound. The pressure front moves at the speed of sound in the unreacted gas and moves away from the reaction front. One way to conceptualize the resulting pressure front is to consider the reaction front as producing a series of individual pressure fronts. These pressure fronts move away from the reaction front at the speed of sound and accumulate together in a main pressure front. The main pressure front will continue to grow in size as additional energy and pressure fronts are produced by the reaction front.
The pressure fronts produced by detonations and deflagrations are markedly different. A detonation produces a shock front, with an abrupt pressure rise, a maximum pressure of greater than 10 atm, and total duration of typically less than 1 ms. The pressure front resulting from a deflagration is characteristically wide (many milliseconds in duration), flat (without an abrupt shock front), and with a maximum pressure much lower than the maximum pressure for a detonation (typically 1 or 2 atm).
The behaviors of the reaction and pressure fronts differ from those shown in Figure 6-14 depending on the local geometry constraining the fronts. Different behavior occurs if the fronts propagate in a closed vessel, a pipeline, or through a congested process unit. The gas dynamic behavior for complex geometries is beyond the scope of this text.
A deflagration can also evolve into a detonation. This is called a deflagration to detonation transition (DDT). The transition is particularly common in pipes but unlikely in vessels or open spaces. In a piping system energy from a deflagration can feed forward to the pressure wave, resulting in an increase in the adiabatic pressure rise. The pressure builds and results in a full detonation.
Confined Explosions
A confined explosion occurs in a confined space, such as a vessel or a building. The two most common confined explosion scenarios involve explosive vapors and explosive dusts. Empirical studies have shown that the nature of the explosion is a function of several experimentally determined characteristics. These characteristics depend on the explosive material used and include flammability or explosive limits, the rate of pressure rise after the flammable mixture is ignited, and the maximum pressure after ignition. These characteristics are determined using two similar laboratory devices, shown in Figures 6-15 and 6-18.
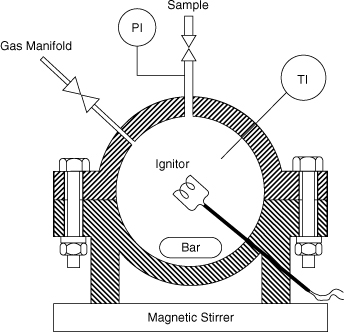
Figure 6-15. Test apparatus for acquiring vapor explosion data.

Figure 6-16. Typical pressure versus time data obtained from gas explosion apparatus shown in Figure 6-15.
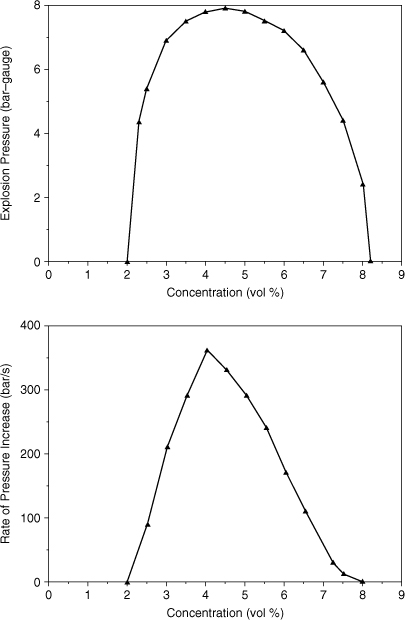
Figure 6-17. Pressure rate and maximum explosion pressure as a function of vapor concentration. The maximum pressure rate does not necessarily occur at the maximum pressure.
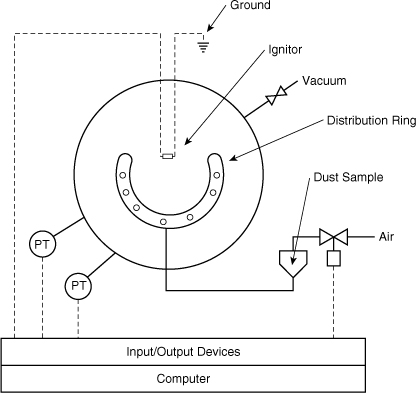
Figure 6-18. Test apparatus for acquiring dust explosion data.
Explosion Apparatus for Vapors
The apparatus used to determine the explosive nature of vapors is shown in Figure 6-15. The test procedure includes (1) evacuating the vessel, (2) adjusting the temperature, (3) metering in the gases to obtain the proper mixture, (4) igniting the gas by a spark or fuse wire, and (5) measuring the pressure as a function of time.
After ignition the pressure wave moves outward within the vessel until it collides with the wall; the reaction is terminated at the wall. The pressure within the vessel is measured by a transducer located on the external wall. A typical pressure versus time plot is shown in Figure 6-16. Experiments of this type usually result in a deflagration with a few atmospheres of pressure rise.
The rate of pressure rise is indicative of the flame front propagation rate and thus of the magnitude of the explosion. The pressure rate or slope is computed at the inflection point of the pressure curve, as shown in Figure 6-16. The experiment is repeated at different concentrations. The pressure rate and maximum pressure for each run are plotted versus concentration, as shown in Figure 6-17. The maximum pressure and maximum rate of pressure rise are determined. Typically, the maximum pressure and pressure rates occur somewhere within the range of flammability (but not necessarily at the same concentration). By using this relatively simple set of experiments, the explosive characteristics can be completely established; in this example the flammability limits are between 2% and 8%, the maximum pressure is 7.4 bar, and the maximum rate of pressure rise is 360 bar/s.
Explosion Apparatus for Dusts
The experimental apparatus used to characterize the explosive nature of dusts is shown in Figure 6-18. The device is similar to the vapor explosion apparatus, with the exception of a larger volume and the addition of a sample container and a dust distribution ring. The distribution ring ensures proper mixing of the dust before ignition.
The experimental procedure is as follows. The dust sample is placed in the sample container. The computer system opens the solenoid valve, and the dust is driven by air pressure from the sample container through the distribution ring and into the dust sphere. After a delay of several milliseconds to ensure proper mixing and distribution of the dust, the ignitor is discharged. The computer measures the pressure as a function of time using high- and low-speed pressure transducers. The air used to drive the dust into the sphere is carefully metered to ensure a pressure of 1 atm (0.987 bar) within the sphere at ignition time. A typical pressure versus time plot from the dust explosion apparatus is shown in Figure 6-19.
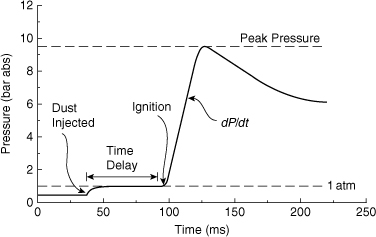
Figure 6-19. Pressure data from dust explosion device.
The data are collected and analyzed in the same fashion as for the vapor explosion apparatus. The maximum pressure and the maximum rate of pressure increase are determined, as well as the flammability limits.
Explosion Characteristics
The explosion characteristics determined using the vapor and dust explosion apparatus are used in the following way:
1. The limits of flammability or explosivity are used to determine the safe concentrations for operation or the quantity of inert material required to control the concentration within safe regions.
2. The maximum rate of pressure increase indicates the robustness of an explosion. Thus, the explosive behavior of different materials can be compared on a relative basis. The maximum rate is also used to design a vent for relieving a vessel during an explosion before the pressure ruptures the vessel or to establish the time interval for adding an explosion suppressant (water, carbon dioxide, or other) to stop the combustion process.
A plot of the logarithm of the maximum pressure slope versus the logarithm of the vessel volume frequently produces a straight line of slope –1/3, as shown in Figure 6-20. This relationship is called the cubic law:
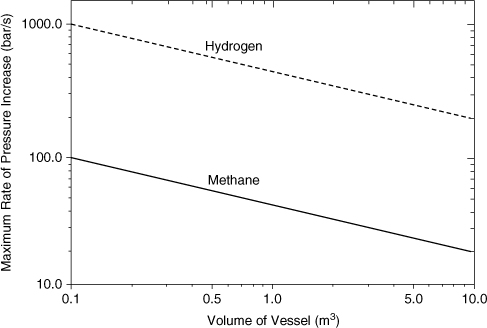
Figure 6-20. Typical explosion data exhibiting the cubic law.
where KG and KSt are the deflagration indexes for gas and dust, respectively. As the robustness of an explosion increases, the deflagration indexes KG and KSt increase. The cubic law states that the pressure front takes longer to propagate through a larger vessel. Pmax and KG and KSt data for vapors and dusts are shown in Tables 6-7 and 6-8, respectively. Table 6-7 shows that good agreement is found between different investigations for the maximum pressure but that only limited agreement is found for the KG values. It is postulated that the KG values are sensitive to experimental configuration and conditions. Dusts are further classified into four classes, depending on the value of the deflagration index. These St classes are shown in Table 6-8.
Table 6-7. Maximum Pressures and Deflagration Indexes for a Number of Gases and Vaporsa

a Data selected from:
NFPA 68, Venting of Deflagrations (Quincy, MA: National Fire Protection Association, 1997).
W. Bartknecht, Explosions-Schutz: Grundlagen und Anwendung (New York: Springer-Verlag, 1993).
J. A. Senecal and P. A. Beaulieu, “KG: Data and Analysis,” in 31st Loss Prevention Symposium (New York: American Institute of Chemical Engineers, 1997).
Table 6-8. St Classes for Dusts and Combustion Data for Dust Cloudsa
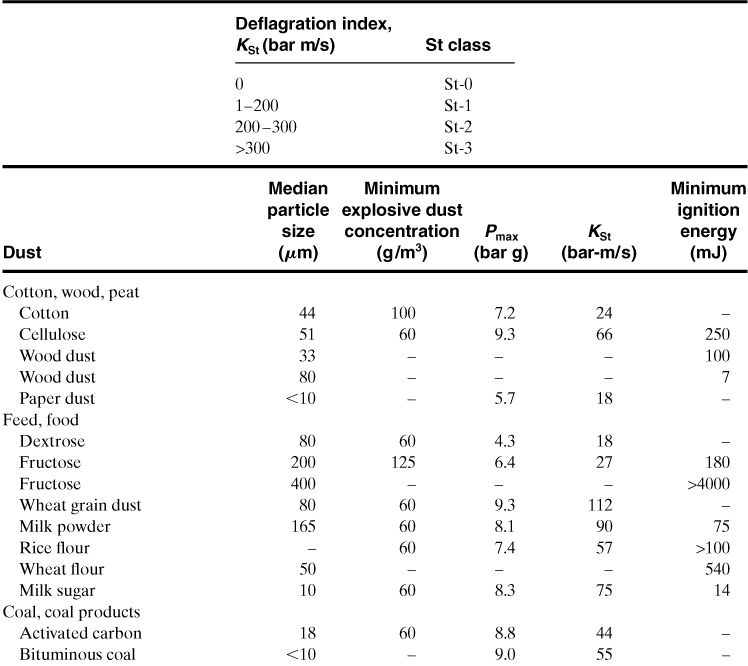
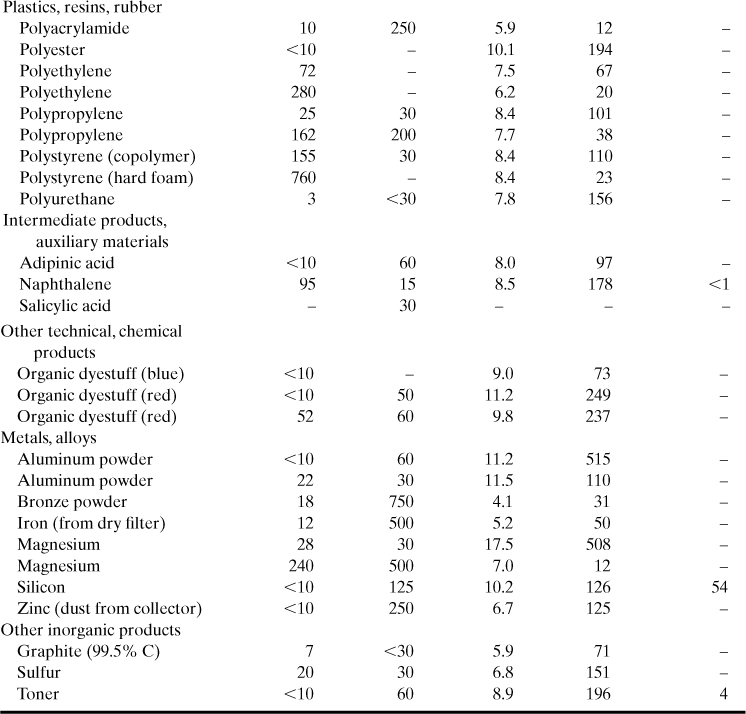
a Data selected from R. K. Eckoff, Dust Explosions in the Process Industries (Oxford: Butterworth-Heinemann, 1997).
Equations 6-22 and 6-23 are used to estimate the consequences of an explosion in a confined space, such as a building or a vessel, as follows:
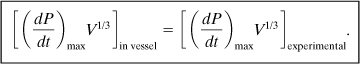
The subscript “in vessel” is for the reactor or building. The subscript “experimental” applies to data determined in the laboratory using either the vapor or dust explosion apparatus. Equation 6-24 allows the experimental results from the dust and vapor explosion apparatus to be applied to determining the explosive behavior of materials in buildings and process vessels. This is discussed in more detail in Chapter 10. The constants KG and KSt are not physical properties of the material because they are dependent on (1) the composition of the mixture, (2) the mixing within the vessel, (3) the shape of the reaction vessel, and (4) the energy of the ignition source. It is therefore necessary to run the experiments as close as possible to the actual conditions under consideration.
Experimental studies indicate that the maximum explosion pressure is usually not affected by changes in volume, and the maximum pressure and the maximum pressure rate are linearly dependent on the initial pressure. This is shown in Figure 6-21. As the initial pressure is increased, a point is reached where the deflagration turns into a detonation.
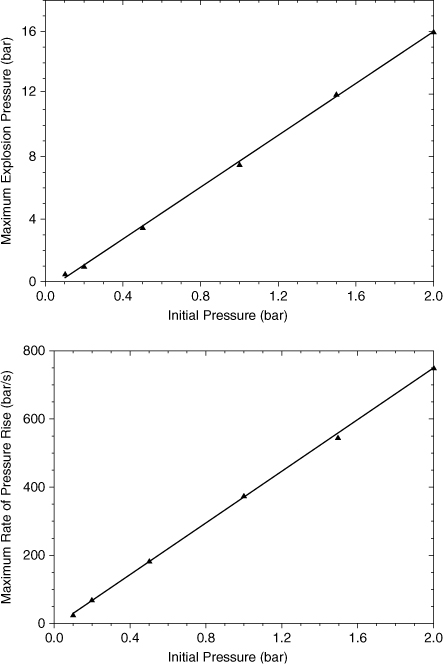
Figure 6-21. Effect of initial pressure on maximum explosion pressure and rate. Data from W. Bartknecht, Explosions (New York: Springer-Verlag, 1981).
Dust explosions demonstrate unique behavior. These explosions occur if finely divided particles of solid material are dispersed in air and ignited. The dust particles can be either an unwanted by-product or the product itself.
Explosions involving dusts are most common in the flour milling, grain storage, and coal mining industries. Accidents involving dust explosions can be quite substantial; a series of grain silo explosions in Westwego near New Orleans in 1977 killed 35 people.16
An initial dust explosion can cause secondary explosions. The primary explosion sends a shock wave through the plant, stirring up additional dust, possibly resulting in a secondary explosion. In this fashion the explosion leapfrogs its way through a plant. Many times the secondary explosions are more damaging than the primary explosion.
Dust explosions are even more difficult to characterize than gaseous explosions. For a gas the molecules are small and of well-defined size. For dust particles the particles are of varying size and many orders of magnitude larger than molecules. Gravity also affects dust particle behavior.
For dusts, deflagrations appear to be much more common than detonations.17 The pressure waves from dust deflagrations, however, are powerful enough to destroy structures and kill or injure people.
To be explosive, a dust mixture must have the following characteristics:
• The particles must be below a certain minimum size, typically less than 400 microns.
• The particle loading must be between certain limits.
• The dust loading must be reasonably uniform.
For most dusts18 the lower explosion limit is between 20 g/m3 and 60 g/m3 and the upper explosion limit is between 2 kg/m3 and 6 kg/m3.
Blast Damage Resulting from Overpressure
The explosion of a dust or gas (either as a deflagration or a detonation) results in a reaction front moving outward from the ignition source preceded by a shock wave or pressure front. After the combustible material is consumed, the reaction front terminates, but the pressure wave continues its outward movement. A blast wave is composed of the pressure wave and subsequent wind. It is the blast wave that causes most of the damage.
Figure 6-22 shows the variation in pressure with time for a typical shock wave at a fixed location some distance from the explosion site. The explosion occurs at time t0. There exists a small but finite time t1 before the shock front travels from its explosive origin to the affected location. This time, t1, is called the arrival time. At t1 the shock front has arrived and a peak overpressure is observed, immediately followed by a strong transient wind. The pressure quickly decreases to ambient pressure at time t2, but the wind continues in the same direction for a short time. The time period t1 to t2 is called the shock duration. The shock duration is the period of greatest destruction to free-standing structures, so its value is important for estimating damage. The decreasing pressure continues to drop below ambient pressure to a maximum underpressure at time t3. For most of the underpressure period from t2 to t4 the blast wind reverses direction and flows toward the explosive origin. There is some damage associated with the underpressure period, but because the maximum underpressure is only a few psi for typical explosions, the damage is much less than that of the overpressure period. The underpressure for large explosions and nuclear explosions, however, can be quite large, resulting in considerable damage. After attaining the maximum underpressure t3, the pressure will approach ambient pressure at t4. At this time the blast wind and the direct destruction have terminated.
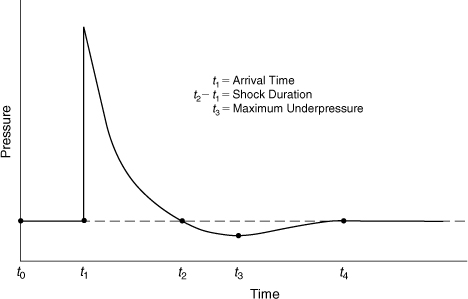
Figure 6-22. Blast wave pressure at a fixed location.
An important consideration is how the pressure is measured as the blast wave passes. If the pressure transducer is at right angles to the blast wave, the overpressure measured is called the side-on overpressure (sometimes called the free-field overpressure). At a fixed location, shown in Figure 6-22, the side-on overpressure increases abruptly to its maximum value (peak side-on overpressure) and then drops off as the blast wave passes. If the pressure transducer is placed facing toward the oncoming shock wave, then the measured pressure is the reflected overpressure. The reflected overpressure includes the side-on overpressure and the stagnation pressure. The stagnation pressure is due to deceleration of the moving gas as it impacts the pressure transducer. The reflected pressure for low side-on overpressures is about twice the side-on overpressure and can reach as high as eight or more times the side-on overpressure for strong shocks. The reflected overpressure is a maximum when the blast wave arrives normal to the wall or object of concern and decreases as the angle changes from normal. Many references report overpressure data without clearly stating how the overpressure is measured. In general, overpressure implies the side-on overpressure and frequently the peak side-on overpressure.
Blast damage is based on the determination of the peak side-on overpressure resulting from the pressure wave impacting on a structure. In general, the damage is also a function of the rate of pressure increase and the duration of the blast wave. Good estimates of blast damage, however, are obtained using just the peak side-on overpressure.
Damage estimates based on overpressures are given in Table 6-9. As illustrated, significant damage is expected for even small overpressures.
Table 6-9. Damage Estimates for Common Structures Based on Overpressure (these values are approximations)a
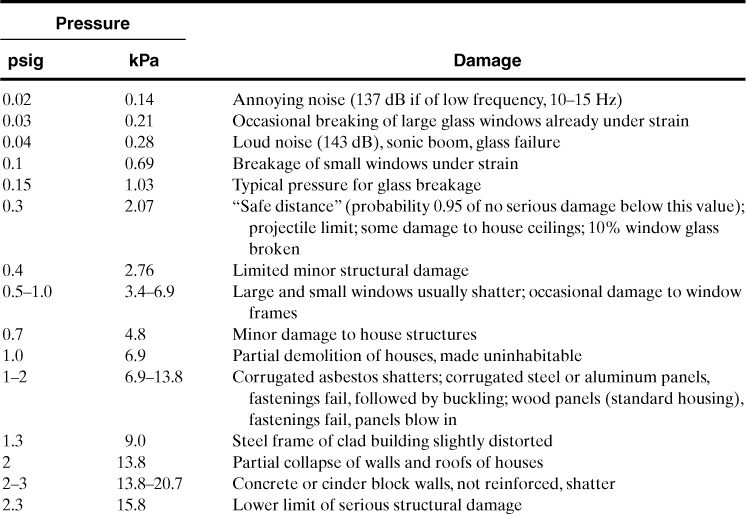
a V. J. Clancey, “Diagnostic Features of Explosion Damage,” paper presented at the Sixth International Meeting of Forensic Sciences (Edinburgh, 1972).
Experiments with explosives have demonstrated19 that the overpressure can be estimated using an equivalent mass of TNT, denoted mTNT, and the distance from the ground-zero point of the explosion, denoted r. The empirically derived scaling law is

The equivalent energy of TNT is 1120 cal/g.
Figure 6-23 provides a correlation for the scaled overpressure ps versus scaled distance ze with units of m/kg1/3. To convert ft/lb1/3 to m/kg1/3, multiply by 0.3967. The scaled overpressure ps is given by
Figure 6-23. Correlation between scaled distance and explosion peak side-on overpressure for a TNT explosion occurring on a flat surface. Source: G. F. Kinney and K. J. Graham, Explosive Shocks in Air (Berlin: Springer-Verlag, 1985).
ps is the scaled overpressure (unitless),
po is the peak side-on overpressure, and
pa is the ambient pressure.
The data in Figure 6-23 are valid only for TNT explosions occurring on a flat surface. For explosions occurring in the open air, well above the ground, the resulting overpressures from Figure 6-23 are multiplied by 0.5. Most explosions occurring in chemical plants are considered to originate on the ground.
The data in Figure 6-23 are also represented by the empirical equation
The procedure for estimating the overpressure at any distance r resulting from the explosion of a mass of material is as follows: (1) Compute the energy of the explosion using established thermodynamic procedures, (2) convert the energy to an equivalent amount of TNT, (3) use the scaling law and the correlations of Figure 6-23 to estimate the overpressure, and (4) use Table 6-9 to estimate the damage.
One kilogram of TNT is exploded. Compute the overpressure at a distance of 30 m from the explosion.
The value of the scaling parameter is determined using Equation 6-25:
From Figure 6-23 the scaled overpressure is 0.055. Thus, if the ambient pressure is 1 atm, then the resulting side-on overpressure is estimated at (0.055)(101.3 kPa) = 5.6 kPa (0.81 psi). From Table 6-9 this overpressure will cause minor damage to house structures.
TNT Equivalency
TNT equivalency is a simple method for equating a known energy of a combustible fuel to an equivalent mass of TNT. The approach is based on the assumption that an exploding fuel mass behaves like exploding TNT on an equivalent energy basis. The equivalent mass of TNT is estimated using the following equation:
where
mTNT is the equivalent mass of TNT (mass),
η is the empirical explosion efficiency (unitless),
m is the mass of hydrocarbon (mass),
ΔHc is the energy of explosion of the flammable gas (energy/mass), and
ETNT is the energy of explosion of TNT.
A typical value for the energy of explosion of TNT is 1120 cal/g = 4686 kJ/kg = 2016 Btu/lb. The heat of combustion for the flammable gas can be used in place of the energy of explosion for the combustible gas.
The explosion efficiency is one of the major problems in the equivalency method. The explosion efficiency is used to adjust the estimate for a number of factors, including incomplete mixing with air of the combustible material and incomplete conversion of the thermal energy to mechanical energy. The explosion efficiency is empirical, with most flammable cloud estimates varying between 1% and 10%, as reported by a number of sources. Explosion efficiencies can also be defined for solid materials, such as ammonium nitrate.
The TNT equivalency method also uses an overpressure curve that applies to point source detonations of TNT. Vapor cloud explosions (VCEs) are explosions that occur because of the release of flammable vapor over a large volume and are most commonly deflagrations. In addition, the method is unable to consider the effects of flame speed acceleration resulting from confinement. As a result, the overpressure curve for TNT tends to overpredict the overpressure near the VCE and to underpredict at distances away from the VCE.
The advantage to the TNT equivalency method is that it is easy to apply because the calculations are simple.
The procedure to estimate the damage associated with an explosion using the TNT equivalency method is as follows:
1. Determine the total quantity of flammable material involved in the explosion.
2. Estimate the explosion efficiency, and calculate the equivalent mass of TNT using Equation 6-28.
3. Use the scaling law given by Equation 6-25 and Figure 6-23 (or Equation 6-27) to estimate the peak side-on overpressure.
4. Use Table 6-9 to estimate the damage for common structures and process equipment.
The procedure can be applied in reverse to estimate the quantity of material involved based on damage estimates.
TNO Multi-Energy Method
The TNO method identifies the confined volumes in a process, assigns a relative degree of confinement, and then determines the contribution to the overpressure from this confined volume (TNO is the Netherlands Organization for Applied Scientific Research). Semi-empirical curves are used to determine the overpressure.
The basis for this model is that the energy of explosion depends highly on the level of congestion and depends less on the fuel in the cloud.
The procedure for using the multi-energy model for a VCE is as follows:20
1. Perform a dispersion model to determine the extent of the cloud. In general, this is done by assuming that equipment and buildings are not present, because of the limitations of dispersion modeling in congested areas.
2. Conduct a field inspection to identify the congested areas. Normally, heavy vapors tend to move downhill.
3. Identify potential sources of strong blast within the area covered by the flammable cloud. Potential sources of strong blast include congested areas and buildings, such as process equipment in chemical plants or refineries, stacks of crates or pallets, and pipe racks; spaces between extended parallel planes (for example, those beneath closely parked cars in parking lots; and open buildings, for instance, multistory parking garages); spaces within tubelike structures (for example, tunnels, bridges, corridors, sewage systems, culverts); and an intensely turbulent fuel-air mixture in a jet resulting from release at high pressure. The remaining fuel-air mixture in the flammable cloud is assumed to produce a blast of minor strength.
4. Estimate the energy of equivalent fuel-air charges by (a) considering each blast source separately, (b) assuming that the full quantities of fuel-air mixture present within the partially confined/obstructed areas and jets, identified as blast sources in the cloud, contribute to the blasts, (c) estimating the volumes of fuel-air mixture present in the individual areas identified as blast sources (this estimate can be based on the overall dimensions of the areas and jets; note that the flammable mixture may not fill an entire blast source volume and that the volume of equipment should be considered where it represents an appreciable proportion of the whole volume); and (d) calculating the combustion energy E (J) for each blast by multiplying the individual volumes of the mixture by 3.5 × 10⁶ J/m3 (this value is typical for the heat of combustion of an average stoichiometric hydrocarbon-air mixture).
5. Assign a number representative of the blast strength for each individual blast. Some companies have defined procedures for this; however, many risk analysts use their own judgment.
A safe and most conservative estimate of the strength of the sources of a strong blast can be made if a maximum strength of 10—representative of a detonation—is assumed. However, a source strength of 7 seems to more accurately represent actual experience. Furthermore, for side-on overpressures below about 0.5 bar, no differences appear for source strengths ranging from 7 to 10.
The blast resulting from the remaining unconfined and unobstructed parts of a cloud can be modeled by assuming a low initial strength. For extended and quiescent parts, assume a minimum strength of 1. For more nonquiescent parts, which are in low-intensity turbulent motion (for instance, because of the momentum of a fuel release), assume a strength of 3.
6. Once the energy quantities E and the initial blast strengths of the individual equivalent fuel-air charges are estimated, the Sachs-scaled blast side-on overpressure and positive-phase duration at some distance R from a blast source is read from the blast charts in Figure 6-24 after calculation of the Sachs-scaled distance:
Figure 6-24. Sachs-scaled overpressure and Sachs-scaled positive-phase duration for the TNO multi-energy blast model. Source: Guidelines for Evaluating the Characteristics of Vapor Cloud Explosions, Flash Fires, and BLEVEs (New York: American Institute of Chemical Engineers, 1994); used with permission.
where
![]() is the Sachs-scaled distance from the charge (dimensionless),
is the Sachs-scaled distance from the charge (dimensionless),
R is the distance from the charge (m),
E is the charge combustion energy (J), and
Po is the ambient pressure (Pa).
The blast peak side-on overpressure and positive-phase duration are calculated from the Sachs-scaled overpressure and the Sachs-scaled positive-phase duration. The overpressure is given by
and the positive phase duration is given by
where
PS is the side-on blast overpressure (Pa),
Δ![]() is the Sachs-scaled side-on blast overpressure (dimensionless),
is the Sachs-scaled side-on blast overpressure (dimensionless),
pa is the ambient pressure (Pa),
td is the positive-phase duration (s),
![]() is the Sachs-scaled positive-phase duration (dimensionless),
is the Sachs-scaled positive-phase duration (dimensionless),
E is the charge combustion energy (J), and
co is the ambient speed of sound (m/s).
If separate blast sources are located close to one another, they may be initiated almost simultaneously, and the respective blasts should be added. The most conservative approach to this issue is to assume a maximum initial blast strength of 10 and to sum the combustion energy from each source in question. Further definition of this important issue (for instance, the determination of a minimum distance between potential blast sources so that their individual blasts can be considered separately) is a factor in present research.
The major problem with the application of the TNO multi-energy method is that the user must decide on the selection of a severity factor, based on the degree of confinement. Little guidance is provided for partial confinement geometries. Furthermore, it is not clear how the results from each blast strength should be combined.
Another popular method to estimate overpressures is the Baker-Strehlow method. This method is based on a flame speed, which is selected based on three factors: (1) the reactivity of the released material, (2) the flame expansion characteristics of the process unit (which relates to confinement and spatial configuration), and (3) the obstacle density within the process unit. A set of semi-empirical curves is used to determine the overpressure. A complete description of the procedure is provided by Baker et al.21 The TNO multi-energy and Baker-Strehlow methods are essentially equivalent, although the TNO method tends to predict a higher pressure in the near field and the Baker-Strehlow method tends to predict a higher pressure in the far field. Both methods require more information and detailed calculations than the TNT equivalency method.
Energy of Chemical Explosions
The blast wave resulting from a chemical explosion is generated by the rapid expansion of gases at the explosion site. This expansion can be caused by two mechanisms: (1) thermal heating of the reaction products and (2) the change in the total number of moles by reaction.
For most hydrocarbon combustion explosions in air the change in the number of moles is small. For example, consider the combustion of propane in air. The stoichiometric equation is
C3H8 + 5O2 + 18.8N2 → 3CO2 + 4H2O + 18.8N2.
The initial number of moles on the left-hand side is 24.8, and the number of moles on the right-hand side is 25.8. In this case only a small pressure increase is expected as a result of the change in the number of moles, and almost all the blast energy must be due to thermal energy release.
The energy released during an explosion is computed using standard thermodynamics. Typically, the heat of combustion is used, but the reaction energy can be easily computed using standard heats of formation. Heat of combustion data are provided in Appendix B. Usually the lower heat of combustion is used where the water product is in the vapor phase, not liquid. Since an explosion occurs within a few milliseconds, the explosive energy is released long before the water vapor can condense into liquid.
The released explosion energy is equal to the work required to expand the gases. Crowl22 reasoned that this expansion work is a form of mechanical energy. The thermodynamic availability is a state function used to determine the maximum mechanical energy extractable from a material as it moves into equilibrium with its surroundings. Sussman23 showed that the thermodynamic availability for a reacting system can be computed using the standard Gibbs energy of formation. Crowl then concluded that the energy of explosion for a material exploding at room temperature and pressure is equal to the standard Gibbs energy of formation. Crowl also showed how the energy of explosion could be determined for materials exploding at different gas compositions and nonambient temperatures and pressures. However, these adjustments are normally small.
One thousand kilograms of methane escapes from a storage vessel, mixes with air, and explodes. Determine (a) the equivalent amount of TNT and (b) the side-on peak overpressure at a distance of 50 m from the blast. Assume an explosion efficiency of 2%.
a. Equation 6-28 applies. The heat of combustion for methane is found in Appendix B. Substituting into Equation 6-28, we obtain
b. Equation 6-25 is used to determine the scaled distance:
From Figure 6-23 (or Equation 6-27), the scaled overpressure is 0.25. Thus the overpressure is
po = pspa = (0.25)(101.3 kPa) = 25 kPa.
This overpressure will demolish steel panel buildings.
Consider the explosion of a propane-air vapor cloud confined beneath a storage tank. The tank is supported 1 m off the ground by concrete piles. The concentration of vapor in the cloud is assumed to be at stoichiometric concentrations. Assume a cloud volume of 2094 m3, confined below the tank, representing the volume underneath the tank. Determine the overpressure from this vapor cloud explosion at a distance of 100 m from the blast using the TNO multi-energy method.
The heat of combustion of a stoichiometric hydrocarbon-air mixture is approximately 3.5 MJ/m3, and by multiplying by the confined volume, the resulting total energy is (2094 m3)(3.5 MJ/m3) = 7329 MJ. To apply the TNO multi-energy method, a blast strength of 7 is chosen. The Sachs-scaled energy is determined using Equation 6-25. The result is
The curve labeled 7 in Figure 6-24 is used to determine the scaled overpressure value of about 0.13. The resulting side-on overpressure is determined from Equation 6-26:
This is adequate to shatter concrete or cinder block walls.
Energy of Mechanical Explosions
For mechanical explosions a reaction does not occur and the energy is obtained from the energy content of the contained substance. If this energy is released rapidly, an explosion may result. Examples of this type of explosion are the sudden failure of a tire full of compressed air and the sudden catastrophic rupture of a compressed gas tank.
Four methods are used to estimate the energy of explosion for a pressurized gas: Brode’s equation, isentropic expansion, isothermal expansion, and thermodynamic availability. Brode’s method24 is perhaps the simplest approach. It determines the energy required to raise the pressure of the gas at constant volume from atmospheric pressure to the final gas pressure in the vessel. The resulting expression is
where
E is the energy of explosion (energy),
P1 is the ambient pressure (force/area),
P2 is the burst pressure of the vessel (force/area),
V is the volume of expanding gas in the vessel (volume), and
γ is the heat capacity ratio for the gas (unitless).
Because P2 > P1, the energy calculated from Equation 6-32 is positive, indicating that the energy is released to the surroundings during the vessel rupture.
The isentropic expansion method assumes that the gas expands isentropically from its initial to final state. The following equation represents this case:
The isothermal expansion case assumes that the gas expands isothermally. This is represented by the following equation:
where
Rg is the ideal gas constant and
T1 is the ambient temperature (degrees).
The final method uses thermodynamic availability to estimate the energy of explosion. Thermodynamic availability represents the maximum mechanical energy extractable from a material as it comes into equilibrium with the environment. The resulting overpressure from an explosion is a form of mechanical energy. Thus thermodynamic availability predicts a maximum upper bound to the mechanical energy available to produce an overpressure.
An analysis by Crowl25 using batch thermodynamic availability resulted in the following expression to predict the maximum explosion energy of a gas contained within a vessel:
Note that Equation 6-35 is nearly the same as Equation 6-34 for an isothermal expansion, with the addition of a correction term. This correction term accounts for the energy lost as a result of the second law of thermodynamics.
The question arises as to which method to use. Figure 6-25 presents the energy of explosion using all four methods as a function of initial gas pressure in the vessel. The calculation assumes an inert gas initially at 298 K with γ = 1.4. The gas expands into ambient air at 1 atm pressure. The isentropic method produces a low value for the energy of explosion. The isentropic expansion results in a gas at a very low temperature; the expansion of an ideal gas from 200 psia to 14.7 psia results in a final temperature of 254°R, or –205°F. This is thermodynamically inconsistent because the final temperature is ambient. The isothermal expansion method predicts a large value for the energy of explosion because it assumes that all the energy of compression is available to perform work. In reality, some of the energy must be expelled as waste heat, according to the second law of thermodynamics. The thermodynamic availability method accounts for this loss through the correction term in Equation 6-35. All four methods continue to be used to estimate the energy of explosion for compressed gases.
Figure 6-25. The energy of explosion for a compressed inert gas, computed using four different methods. Source: D. A. Crowl, Understanding Explosions (New York: American Institute of Chemical Engineers, 2003); used with permission.
It is thought that the Brode equation more closely predicts the potential explosion energy close to the explosion source, or near field, and that the isentropic expansion method predicts better the effects at a greater distance, or far field. However, it is unclear where this transition occurs. Also, a portion of the potential explosion energy of vessel burst is converted into kinetic energy of the vessel pieces and other inefficiencies (such as strain energy in the form of heat in the vessel fragments). For estimation purposes it is not uncommon to subtract 50% of the total potential energy to calculate the blast pressure effects from vessel burst.
Missile Damage
An explosion occurring in a confined vessel or structure can rupture the vessel or structure, resulting in the projection of debris over a wide area. This debris, or missiles, can cause appreciable injury to people and damage to structures and process equipment. Unconfined explosions also create missiles by blast wave impact and subsequent translation of structures.
Missiles are frequently a means by which an accident propagates throughout a plant facility. A localized explosion in one part of the plant projects debris throughout the plant. This debris strikes storage tanks, process equipment, and pipelines, resulting in secondary fires or explosions.
Clancey26 developed an empirical relationship between the mass of explosive and the maximum horizontal range of the fragments, as illustrated in Figure 6-26. This relationship is useful during accident investigations for calculating the energy level required to project fragments an observed distance.
Figure 6-26. Maximum horizontal range of blast fragments. Data from Clancey, “Diagnostic Features of Explosive Damage.”
Blast Damage to People
People can be injured by explosions from direct blast effects (including overpressure and thermal radiation) or indirect blast effects (mostly missile damage).
Blast damage effects are estimated using probit analysis, discussed in Section 2-6.
A reactor contains the equivalent of 10,000 lb of TNT. If it explodes, estimate the injury to people and the damage to structures 500 ft away.
The overpressure is determined using Equation 6-25 and Figure 6-23. The scaled distance is
From Figure 6-23 the scaled overpressure is 0.21 and the overpressure is (0.21)(14.7 psia) = 3.1 psig. Table 6-9 indicates that steel panel buildings will be demolished at this location.
Injury to personnel is determined using probit equations from Table 2-5. The probit equation for deaths resulting from lung hemorrhage is
Y = –77.1 + 6.91 ln P,
and the probit equation for eardrum rupture is
Y = –15.6 + 1.93 ln P,
where P is the overpressure in N/m2. Thus
Substituting this value into the probit equations yields
Ydeaths = –77.1 + 6.91 ln(21,400) = –8.20,
Yeardrums = –15.6 + 1.93 ln(21,400) = 3.64.
Table 2-4 converts the probit to percentages. The result shows that there are no deaths and that less than 10% of the exposed people suffer eardrum ruptures. This assumes complete conversion of explosion energy.
Based on Figure 6-26, this explosion could project blast fragments a maximum distance of 6000 ft, resulting in probable injuries and damage as a result of blast fragments.
Vapor Cloud Explosions
The most dangerous and destructive explosions in the chemical process industries are vapor cloud explosions (VCEs). These explosions occur in a sequence of steps:
1. Sudden release of a large quantity of flammable vapor (typically this occurs when a vessel, containing a superheated and pressurized liquid, ruptures),
2. Dispersion of the vapor throughout the plant site while mixing with air, and
3. Ignition of the resulting vapor cloud.
The accident at Flixborough, England, is a classic example of a VCE. A sudden failure of a 20-inch cyclohexane line between reactors led to vaporization of an estimated 30 tons of cyclohexane. The vapor cloud dispersed throughout the plant site and was ignited by an unknown source 45 seconds after the release. The entire plant site was leveled and 28 people were killed.
A summary of 29 VCEs27 over the period 1974–1986 shows property losses for each event of between $5,000,000 and $100,000,000 and 140 fatalities (an average of almost 13 per year).
VCEs have increased in number because of an increase in inventories of flammable materials in process plants and because of operations under more severe conditions. Any process containing quantities of liquefied gases, volatile superheated liquid, or high-pressure gases is considered a good candidate for a VCE.
VCEs are difficult to characterize, primarily because of the large number of parameters needed to describe an event. Accidents occur under uncontrolled circumstances. Data collected from real events are mostly unreliable and difficult to compare.
Some of the parameters that affect VCE behavior28 are quantity of material released, fraction of material vaporized, probability of ignition of the cloud, distance traveled by the cloud before ignition, time delay before ignition of cloud, probability of explosion rather than fire, existence of a threshold quantity of material, efficiency of explosion, and location of ignition source with respect to release.
Qualitative studies29 have shown that (1) the ignition probability increases as the size of the vapor cloud increases, (2) vapor cloud fires are more common than explosions, (3) the explosion efficiency is usually small (approximately 2% of the combustion energy is converted into a blast wave), and (4) turbulent mixing of vapor and air and ignition of the cloud at a point remote from the release increases the impact of the explosion.30
From a safety standpoint the best approach is to prevent the release of material. A large cloud of combustible material is dangerous and almost impossible to control, despite any safety systems installed to prevent ignition.
Methods that are used to prevent VCEs include keeping low inventories of volatile, flammable materials, using process conditions that minimize flashing if a vessel or pipeline is ruptured, using analyzers to detect leaks at low concentrations, and installing automated block valves to shut systems down while the spill is in the incipient stage of development.
Boiling-Liquid Expanding-Vapor Explosions31
A boiling-liquid expanding-vapor explosion (BLEVE, pronounced ble′-vee) is a special type of accident that can release large quantities of materials. If the materials are flammable, a VCE might result; if they are toxic, a large area might be subjected to toxic materials. For either situation the energy released by the BLEVE process itself can result in considerable damage.
A BLEVE occurs when a tank containing a liquid held above its atmospheric pressure boiling point ruptures, resulting in the explosive vaporization of a large fraction of the tank contents.
BLEVEs are caused by the sudden failure of the container as a result of any cause. The most common type of BLEVE is caused by fire. The steps are as follows:
1. A fire develops adjacent to a tank containing a liquid.
2. The fire heats the walls of the tank.
3. The tank walls below liquid level are cooled by the liquid, increasing the liquid temperature and the pressure in the tank.
4. If the flames reach the tank walls or roof where there is only vapor and no liquid to remove the heat, the tank metal temperature rises until the tank loses it structural strength.
5. The tank ruptures, explosively vaporizing its contents.
If the liquid is flammable and a fire is the cause of the BLEVE, the liquid may ignite as the tank ruptures. Often, the boiling and burning liquid behaves as a rocket fuel, propelling vessel parts for great distances. If the BLEVE is not caused by a fire, a vapor cloud might form, resulting in a VCE. The vapors might also be hazardous to personnel by means of skin burns or toxic effects.
When a BLEVE occurs in a vessel, only a fraction of the liquid vaporizes; the amount depends on the physical and thermodynamic conditions of the vessel contents. The fraction vaporized is estimated using the methods discussed in Section 4-7.
Suggested Reading
Center for Chemical Process Safety (CCPS), Guidelines for Evaluating Process Buildings for External Explosions and Fires (New York: John Wiley, 1996).
Center for Chemical Process Safety (CCPS), Guidelines for Vapor Cloud Explosion, Pressure Vessel Burst, BLEVE and Flash Fire Hazards, 2nd ed. (New York: John Wiley, 2010).
D. A. Crowl, Understanding Explosions (New York: John Wiley, 2003).
Rolf Eckhoff, Dust Explosions in the Process Industries, 3rd ed. (Amsterdam: Elsevier, 2003).
Irvin Glassman and Richard A. Yetter, Combustion, 4th ed. (Burlington, MA: Academic Press, 2008).
Don W. Green and Robert H. Perry, Perry’s Chemical Engineers’ Handbook, 8th ed. (New York: McGraw-Hill, 2008), pp. 23–6 to 23–21.
Gilbert F. Kinney and Kenneth J. Graham, Explosive Shocks in Air, 2nd ed. (Berlin: Springer-Verlag, 1985).
Bernard Lewis and Guenther von Elbe, Combustion, Flames, and Explosions of Gases, 3rd ed. (Burlington, MA: Academic Press, 1987).
Sam Mannan, ed., Lees’ Loss Prevention in the Process Industries, 3rd ed. (Amsterdam: Elsevier, 2005), ch. 16 and 17.
Society of Fire Protection Engineers, SFPE Handbook of Fire Protection Engineering, 4th ed. (Quincy, MA: National Fire Protection Association, 2008).
Daniel R. Stull, Fundamentals of Fires and Explosion, AICHE Monograph Series, no. 10, v. 73 (New York: American Institute of Chemical Engineers, 1977).
Problems
6-1. Estimate the flash point of a solution of 50 mol % water and 50 mol % methanol.
6-2. Estimate the flash point of a solution of 50 mol % water and 50 mol % ethanol.
6-3. Estimate the LFL and the UFL of the following mixtures:
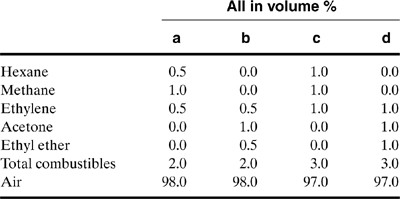
6-4. Estimate the LFL and the UFL of Problem 6-3a at 50°C, 75°C, and 100°C.
6-5. Estimate the UFL of Problem 6-3a at 1 atm, 5 atm, 10 atm, and 20 atm of pressure.
6-6. Estimate the LFL and the UFL using the stoichiometric concentrations for methane, propylene, ethyl ether, and acetone. Compare these estimates to actual values.
6-7. Estimate the LOC of propane, hydrogen, and methane using Equations 6-15 and 6-16. Compare to the values in Table 6-3.
6-8. Determine the LOC of a mixture of 2% hexane, 3% propane, and 2% methane by volume.
6-9. Determine the minimum compression ratio required to raise the temperature of air over hexane to its AIT. Assume an initial temperature of 100°C.
6-10. What will be the LFL of hexane in the presence of hexane mists with drops larger than 0.01 mm?
6-11. Why do staged hydrogen compressors need interstage coolers?
6-12. Why do hot engines sometimes continue to run after the ignition is turned off?
6-13. A set of experiments is run on a flammable gas in a spherical vessel. The following data are obtained for two different vessel volumes. Estimate the value of KG for this combustible gas:
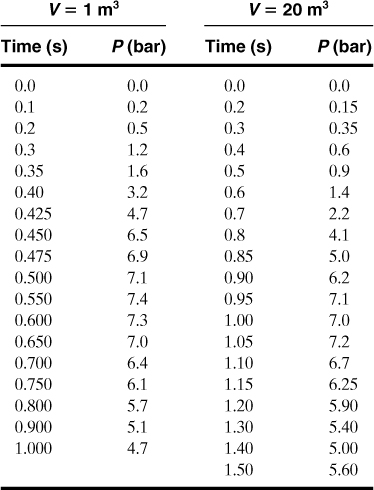
6-14. Determine the energy of explosion for 1 lb of gaseous n-butane. What is the TNT equivalent?
6-15. A gas cylinder contains 50 lb of propane. The cylinder accidentally falls over and ruptures, vaporizing the entire contents of the cylinder. The cloud is ignited and an explosion occurs. Determine the overpressure from this explosion 100 ft away. What type of damage is expected?
6-16. A VCE with methane destroyed a house structure 100 ft away from the ignition source. Estimate the amount of methane released.
6-17. A large cloud of propane is released and eventually ignited, producing a VCE. Estimate the quantity of propane released if the blast shatters windows 3 mi from the source of the ignition.
6-18. At 77°F gasoline has a vapor pressure of 4.6 psia. Why can gasoline be stored in vented storage vessels without the presence of flammable vapors above the liquid in the vessel? Comment on the EPA’s effort to reduce gasoline volatility in order to reduce fugitive emissions. What will happen as the volatility is reduced?
6-19. An automobile assembly line includes an operation that involves filling the gas tanks with gasoline. Estimate the ventilation rate required to reduce the vapors from this operation to below the LFL for gasoline. Assume that each tank has a volume of 14 gal and that a tank can be filled in 3 min. Assume splash filling and that only one tank is filled at a time. The molecular weight of gasoline is about 94, and its vapor pressure at 77°F is 4.6 psia. Also, calculate the ventilation air required to reduce the concentration of the gasoline vapors to below the TLV-TWA. Which problem is more difficult?
6-20. A butane tank is located 500 ft from a residential area. Estimate the minimum instantaneous release of butane required to produce a vapor concentration in the residential area equal to the LFL for butane. What continuous release rate is required? Assume that the release occurs at ground level. Will the minimum amount increase, decrease, or stay the same if the release occurs above ground level?
6-21. Benzene is stored in an inside storage area, 15 ft long and 15 ft wide with an 8-ft ceiling. This storage area has a ventilation system that changes the air in the room completely six times per hour. The storage area is also equipped with a flammable vapor detector that sounds an alarm when the flammable vapor concentration reaches 25% of the LFL for benzene. What is the minimum benzene spill rate, in lb/hr, that will set off the flammable vapor alarm in the room? Assume a pressure of 1 atm and a temperature of 80°F. Also assume average ventilation conditions.
6-22. A standard laboratory cylinder is about 5 ft high with an internal vessel diameter of about 6 in. Determine the total energy of explosion for this cylinder if it contains nitrogen compressed to 2500 psig. Assume initial and ambient conditions of 298 K and 1 atm.
6-23. Many chemical operators believe that the inerted vapors above a flammable liquid are not flammable when they mix with air. This is frequently not the case: If the inerted vapors escape from the vessel and mix with air or if the vessel is purged with air after emptying, the resulting mixture might be flammable.
A storage vessel contains liquid benzene at 100°F. The vessel vapor space is inerted with pure nitrogen to a total pressure of 1/2 in of water gauge. Assume that the vapor space is saturated with benzene vapor.
a. Determine the volume percent concentration of benzene in the vapor.
b. Use a flammability diagram to show whether or not this mixture will become flammable when mixed with air.
(Hint: 1 atm = 34.4 ft of water.)
6-24. An informal industry rule is to design occupied control rooms to withstand a 1-ton blast of TNT at 100 ft.
a. What overpressure does this correspond to?
b. What quantity (in pounds) of propane (C3H8) does this correspond to, based on an equivalent amount of energy?
c. How far away (in ft) from this 1- ton blast must a residential home be in order to receive no more than minor damage to house structures?
6-25. According to fire code, propane storage tanks cannot be closer than 10 ft to a house. This requirement is designed to prevent flammable vapors from entering the house, not to protect the house from a potential explosion.
What quantity of propane (in lbm) can be stored under these conditions that will cause no more than minor damage to a house in the event of an explosion? Be sure to list any assumptions.
6-26. Fires and explosions are substantial hazards in many chemical plants.
a. Describe with examples the three ingredients of any fire.
b. Create a checklist with at least six items to identify fire hazards in any workplace.
c. List six common fire prevention/protection features for chemical plants, and describe when they would be appropriate.
6-27. The following liquids are stored in a storage vessel at 1 atm and 25°C. The vessels are vented with air. Determine whether the equilibrium vapor above the liquid will be flammable. The liquids are
a. Acetone
b. Benzene
c. Cyclohexane
d. Ethyl alcohol
e. Heptane
f. Hexane
g. Pentane
h. Toluene
6-28. A natural gas wellhead is located 400 m from an instrument control room. The control room is a potential ignition hazard in the event of a leak of natural gas (essentially pure methane). Studies have shown that a suitable safety margin is imposed if the downwind gas concentration is determined using one-half the LFL. For methane this represents a concentration of 2.5 vol. %.
a. What is the minimum release rate of methane (in kg/s) that will result in a concentration at the control room equal to half the LFL? Be sure to state your assumptions clearly. Assume a temperature of 298 K and an ambient pressure of 1 atm.
b. If the methane pressure in the wellhead is at 10 atm pressure, what hole size (in cm) will produce the release rate of part a?
c. If the largest pipe size in the wellhead is 4 cm (internal diameter), comment on the likelihood of an ignition hazard from the control room.
6-29. In the TWA Flight 800 tragedy the accident is blamed on explosion of fuel vapors in the central fuel tank. The volume of the central fuel tank is 18,000 gal.
a. If, at the time of the explosion, the fuel concentration in the tank is 1% by volume and the pressure inside the tank is 12.9 psia, determine the equivalent energy of explosion for the vapor (in pounds of TNT). Assume a temperature of 80°F. Be sure to state carefully any assumptions.
b. Estimate the overpressure at a distance of 50 ft from the fuel tank explosion from the explosion of the vapors in part a.
c. Estimate the limiting oxygen concentration (LOC) for the jet fuel, given that the LFL is 0.6% by volume and the stoichiometric coefficient for oxygen in the combustion equation is 18.9.
For jet fuel the energy of explosion is 18,590 Btu/lb and the molecular weight is 160.
6-30. You have decided to purchase a 500-gal tank of liquid propane (C3H8) to heat your house during the winter. You are concerned about tank rupture and the possibility of a vapor cloud explosion of all the propane. How far away (in ft) must the tank be from the house to ensure that your house will receive only minor damage from an explosion? The specific gravity of liquid propane is 0.500, and the energy of explosion for propane is 488.3 kcal/g-mol.
6-31. A liquid mixture containing 0.50 mole fraction benzene-toluene is contained in a storage vessel at 25°C and 1 atm. The vessel is vented to the atmosphere.
a. Is the vapor in the vessel flammable?
b. What are your resulting concerns about fire and explosion hazards with this storage vessel?
Hint: Benzene-toluene can be assumed to be an ideal liquid-vapor system.
6-32. A tank containing liquid butane (C4H10) is located 500 ft from an electrical substation. One of the scenarios we are considering is the breaking of a 1-in schedule 40 pipe (internal diameter = 1.049 in) with discharge of the liquid butane. We are concerned that this leak will cause flammable vapor concentrations at the substation. Assume that all the liquid flashes to vapor.
a. Estimate the discharge rate (in lbm/s) of butane from the 1-in broken pipe.
b. Estimate the butane vapor concentrations at the substation. Is this likely to be a flammable hazard?
The temperature is 80°F and the ambient pressure is 1 atm. Make sure you clearly state any assumptions. The vapor pressure of liquid butane at 80°F is 40 psia, and the specific gravity of liquid butane at 80°F is 0.571.
6-33. Acetone is used as a solvent in a laboratory. There is some concern about the fire hazards associated with the acetone. One solution is to dilute the pure acetone with water, thus providing an increased flash point. What mole fraction of water in a water-acetone mixture is required to increase the flash point of the mixture to 100°F? Acetone is completely soluble in water.
6-34. You have been assigned the task of assisting in relocating the new control room for your process. The new control room will be designed to withstand an explosive overpressure of 2 psig. Your attention is focused on a propane storage tank located 100 m from the proposed site for the new control room. What is the maximum quantity of propane (in kg) that can be stored in this tank without exceeding the overpressure rating of the control room? Make sure you state any assumptions used in your calculation.
6-35. Methyl alcohol liquid is stored in a vessel. Its vapor is inerted with nitrogen to a total pressure of 2 in of water gauge. Will the inerted vapor be flammable if it escapes the vessel? Assume a temperature of 25°C.
6-36. Draw a flammability diagram for n-butane. The experimentally reported LOC for n-butane is 12%. What must the oxygen concentration be reduced to before pumping in butane? What butane concentration must the vapor be reduced to before pumping air into the vessel before taking it out of service?
6-37. For flammable gases the minimum ignition energy is typically 0.1 mJ. The mass of a penny is typically 2.6 g. How far must this penny be dropped to contain the kinetic energy equal to 0.1 mJ?
6-38. During a particular accident, an estimated 39,000 kg of flammable material was released and ignited, resulting in an explosion and fireball and the subsequent fatalities and equipment damage. The publication Guidelines for Evaluating the Characteristics of Vapor Cloud Explosions, Flash Fires, and BLEVES (New York: American Institute of Chemical Engineers, 1994) provides a number of equations useful for estimating the effects of such an explosion.
The heat radiation intensity (in kW/m2) from a ball of burning vapor is given by the empirical equation
The effective time duration (in seconds) of the burn is given by
The height of the center of the fireball (in meters) is assumed to be constant during the burn and is given by
HBLEVE = 0.75Dmax.
Finally, the maximum diameter of the fireball (in meters) is given by
For these equations Ie is the effective radiation intensity (kW/m2), mf is the mass of fuel (kg), L is the distance from the center of the fireball to the receptor (m), and te is the effective time duration of the burn (s).
Use a spreadsheet program (such as Quattro Pro or Excel) to estimate the total number of fatalities resulting from the burning fireball. Use the probit equations provided in the text. Assume that 400 people are distributed evenly at a distance of 75 m to 1000 m from the fireball center. Divide the distance interval into a number of small increments. Use a small enough distance increment so that the results are essentially independent of the increment size.
Your spreadsheet output should have designated columns for the distance from the fireball center, radiation intensity, probit values, and percentage and number of fatalities. You should also have a single designated spreadsheet cell providing the total number of fatalities.
One way to simplify the procedure is to specify a threshold radiative flux. It is assumed that 100% fatalities will occur to anyone exposed to anything above this value. Anyone exposed to a lesser value will be unharmed. Estimate an approximate threshold radiative flux value that will result in the same number of fatalities as the detailed probit calculation.
6-39. The air in a 55-gal drum must be flushed and inerted with nitrogen before the drum is filled with a flammable liquid. This is accomplished by placing a nitrogen lance through the hole of the drum reaching to the bottom. A constant flow rate of nitrogen is used to achieve the inerting.
a. Show that the concentration of oxygen in the drum is represented by
where C is the concentration of oxygen in the drum (mass/volume), k is the nonideal mixing factor (0.1 < k < 1), and Qv is the volumetric flow of nitrogen (volume/time).
b. Show that the time required to reach a target concentration Cf from an initial concentration Co is given by
c. Estimate the time it will take to inert a drum to 1% oxygen using 75 L/min of nitrogen. Use k as a parameter.
6-40. A container in a process using a flammable vapor has dimensions of 100 m by 100 m by 10 m high. Use the TNO multi-energy model to estimate the overpressure 100 m from the process resulting from the release and ignition of the flammable vapor. Assume that 20% of the process volume is moderately congested and that the remaining 80% is lightly congested. Be sure to state any additional assumptions.
6-41. A polymeric foam is expanded using gaseous propane (C3H8) as a blowing agent. The polymer is shipped as small pellets in shipping containers inerted with pure nitrogen to an initial shipping pressure of 1 atm abs pressure. During shipping, the propane gas comes out of the pellets and mixes with the gaseous nitrogen in the shipping container. Laboratory studies have shown that the propane out-gassing can increase the pressure in the container by 10 kPa. Will a flammable atmosphere be created when the shipping container is opened and dumped into a hopper? The ambient pressure is 1 atm.
6-42. The table below provides the vapor pressure for liquid propane as a function of temperature:
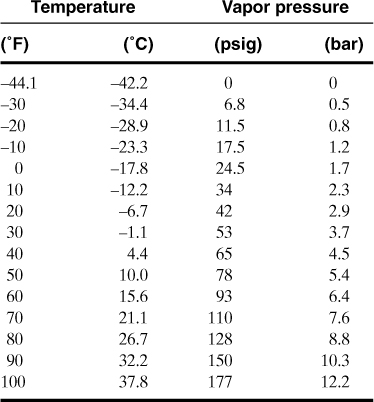
A cylinder of propane contains 9 kg liquid propane at 30°C. The ambient pressure is 1 atm.
a. What is the pressure in the tank (in bar) at this temperature?
b. If the valve is equivalent to a 10-mm-diameter hole, what is the initial discharge rate of the propane (in kg/s) if the valve is opened?
c. If all of the propane leaks out and mixes with air and then ignites in the open, what is the distance (in m) to the 13.8 kPa (3 psig) peak side-on overpressure?
6-43. Our plant site is considering installing a propane storage tank at a location 100 m from a control room. We have been asked to evaluate the risk at this location due to flammability and explosion hazards.
a. What continuous release of propane (in kg/s) is required to result in a concentration at the control room equal to the LFL? Make sure you clearly state and validate your assumption of atmospheric stability. Assume rural conditions, a temperature of 25°C, and a pressure of 1 atm.
b. The control room is designed to withstand a side-on peak overpressure of 2 psig. How much propane (in kg) can be stored at this location? Be sure to clearly state and justify your assumption of an explosion efficiency.
6-44. A lab worker has left an open beaker containing 1.5 liters of carbon disulfide on the desk in his lab office at the end of the workday, and he closed his office door when he left. To save energy, the company turns off the office ventilation system at the end of the workday. If the CS2 evaporates, it might form a flammable mixture in air, and an explosion might result if the worker turns the light switch on in the morning. The temperature is 30°C and the ambient pressure is 1 atm. The floor area of the room is 3 m by 3 m, and the ceiling height is 3 m.
a. Estimate the resulting concentration of CS2 in the room, in volume %. Compare to the flammability limit.
b. Estimate the equivalent amount of TNT from the vapor. Make sure you clearly state any assumptions.
c. If the vapor explodes, at what distance is the 3 psi overpressure found?
Physical property data for CS2 at 30°C:
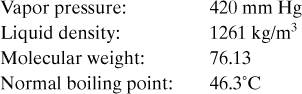
6-45. Our plant site wishes to install a pressure vessel containing a total of 1000 kg of liquid propane (C3H8). We are concerned about the scenario of rupture of the vessel and subsequent mixing with air and explosion of the flammable mixture.
a. Our control room has a maximum side-on overpressure of 3 psi. How far (in meters) must the vessel be located from the control room? Make sure you explicitly identify and justify your explosion efficiency.
b. How far (in meters) should the vessel be located from off-site housing, in order to have no more than minor damage to the house structures?
6-46. Your plant is considering installing a vessel containing 1000 kg of propane. One possible site is located 100 m from a residential area.
a. What overpressure (in kPa) can be expected in the residential area due to the sudden failure of the vessel followed by a vapor cloud explosion? What type of damage would be expected from this overpressure? Assume a 2% explosion efficiency.
b. What concentration of propane can be expected in the residential area due to the failure of the vessel? Will this be flammable? Assume urban conditions and worst-case conditions, as described in Table 4-6. The pressure is 1 atm and the temperature is 298 K.
6-47. You have been assigned the task of assisting in relocating the new control room for your process. The new control room will be designed to withstand an explosive overpressure of 2 psig. Your attention is focused on a propane storage tank located 100 m from the proposed site for the new control room. What is the maximum quantity of propane (in kg) that can be stored in this tank without exceeding the overpressure rating of the control room? Make sure you state any assumptions used in your calculation.
6-48. The stoichiometric air/fuel mixture for gasoline is specified as a mass ratio of air to fuel of 14.7.
a. Convert this to volume percent fuel in air. Assume a molecular weight of gasoline of 106 and for air of 29.
b. An automobile has a gasoline engine with a 5-liter displacement. What is the gas consumption, in gallons per hour, if the engine is operating at 1500 rpm? Remember, the 4-cycle engine intakes air and fuel only every other stroke. Assume a specific gravity of 0.75 for gasoline. The air/fuel mixture is fed to the engine at a temperature of 1 atm and 25°C.
c. If the air/fuel vapor mixture is preheated to 150°F, what is the fuel consumption?
6-49. How many liters of gasoline are required to make a stoichiometric vapor concentration in a tank truck compartment with a volume of 11,860 liters? The stoichiometric concentration for gasoline is 1.83 vol. %. The temperature is 25°C and the pressure is 1 atm. Use the following physical properties:
6-50. A 60-gal hot water heater, completely filled with liquid water, catastrophically ruptures at a pressure of 290 psig. Estimate:
a. The fraction of water flashed.
b. The energy of explosion in terms of an equivalent amount of TNT, in pounds. Calculate this using the total enthalpy of the hot water in the heater when it ruptures minus the enthalpy of an equivalent amount of liquid water at the normal boiling point of 212°F.
c. What overpressure would result at a distance of 50 feet? Use a steam table to determine the enthalpy values.
6-51. Black powder was used as a blasting agent and a rifle propellant for hundreds, if not thousands, of years. It is a mixture of potassium nitrate, charcoal, and sulfur. The reaction that occurs during black powder combustion is
2KNO3 + 3C + S ==> K2S + 3CO2 + N2.
Estimate the TNT equivalence (in kg) of 1 kg of black powder. The heats of formation are given below:
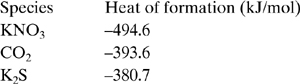
6-52. A fair amount of variability exists in determination of the flammability limits. For example, various researchers have reported lower flammability limits for methane of 5.3%, 5.0%, and 4.85%. Rework Problem 6-3c to determine how this variability affects the mixture LFL.
6-53. A plant location has several vapor streams that contain flammable vapors. These streams include the inerted vapor from an acetone storage vessel, the vapor from a hood ventilation system at an acetone drumming station, and ventilation from laboratory hoods.
The plan is to send these vapors to a flare for destruction.
Can all of these streams be combined into a single duct for combustion at the flare? If not, which streams can be safely combined and which must be kept separate? Why?