Chapter | five
How Large Is an Audio Signal?
CHAPTER OUTLINE
When describing the size of an audio signal, it is very important that there is agreement on what techniques to use to make the measurement. Otherwise there is a risk that differently measured values are not comparable.
ACOUSTIC SIGNALS
As a rule acoustic signals must be measured using transducers, for example microphones. An electrical signal that is analogous to an acoustic signal is what is really being used in practice when one performs this magnitude measurement.
ELECTRICAL SIGNALS
An electrical signal can be described by amplitude values for the voltage or current. Alternately, the electrical signal can be described by the energy it contains, for example the electrical power that is fed into a given load or during a given period of time.
When we study the amplitude of a signal as seen on an oscilloscope or a digital audio workstation (DAW), we can describe the values that we normally use to describe the magnitude of an audio signal.
PEAK VALUES
The peak value describes the instantaneous maximum amplitude value within one period of the signal concerned. The peak value can also be the maximum value that is ascertained during any period of time under consideration, even though the normal designation here concerns the maximum value within one period. Normally, the peak value measurement is used with symmetric signals, i.e., signals that deviate equally far from 0 in both a positive and negative direction.

FIGURE 5.1 Sinewave where the peak value (Up), peak-to-peak value (Up-p) and the phase (φ) are indicated.
For a sinusoidal wave:
Peak value = Maximum value
(See the following two sections for discussions of RMS value and average value.) In practical sound technology, particularly in so far as it concerns circuits for the recording and transmission of audio signals, it is the peak-topeak value that is significant. It is this value that says how much “space” (voltage) the signal “takes up” in the electrical circuit, or how much a membrane must move in a purely physical sense from one extreme to the other in order to record or reproduce the sound.
For a sinusoidal wave:
Peak to Peak value = 2 × Maximum value
= 2.828 × RMS value
In relation to the recording of audio signals, it is important to know that possible phase shifts, which can arise for example in different forms of pre-emphasis or correction networks, can make a signal asymmetric. (See Figure 5.2.)
In addition, there are many acoustic signals that contain an asymmetric wave. This applies, for example, to voice and to musical instruments, particularly percussion instruments, where the impact can be highly asymmetric.
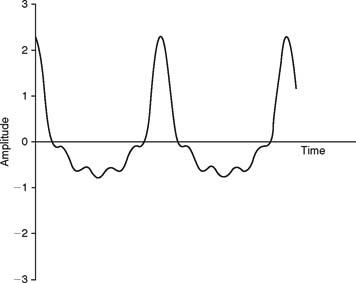
FIGURE 5.2 Example of a signal that is asymmetric around 0. The signal contains a fundamental tone and subsequently four harmonic overtones (symmetric sinusoidal tones). Each of the harmonics has a 90° phase shift in relation to the fundamental frequency. The length of this curve corresponds to two periods of the fundamental frequency.
AVERAGE VALUE
The average value is based on the average of the numerical values for the amplitude over a period of time. (Numerical value here means the indicated value without regard to its sign.)
The average value is calculated according to the following expression:
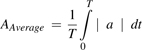
where
T = period
a = amplitude
For a sinusoidal wave:
RMS VALUE
The RMS value is based on the energy that is contained in a given signal. RMS stands for root mean square and in essence is the square root of the square of the average value.
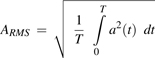
where
T = period
a = amplitude as a function of time
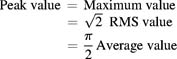
For a sinusoidal wave:
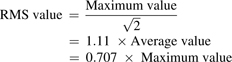
For a square waveform:
RMS value = Maximum value
For a triangular wave:
For a half-wave:
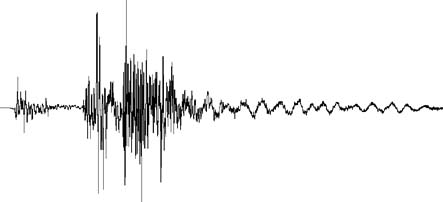
FIGURE 5.3 Sound impulse with a high peak value, but a low RMS value.
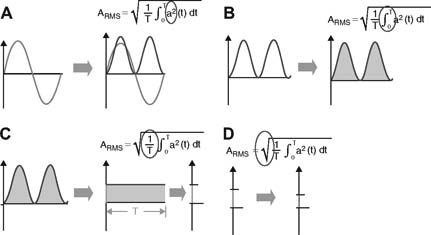
FIGURE 5.4 This strip explains what happens to the signal when finding its RMS value. A: All values are squared (provides positive figures). B: By integration the area below the curve is found. C: The area is divided by the time of the period. D: The square root is taken and we have a result: RMS!
Crest Factor
The crest factor expresses the relation between the peak value (maximum value) and the RMS value. It is a magnitude that is important to know when recording because the maximum value is an expression of the signal’s amplitude, whereas the RMS value relates to what the level meter is showing.
For a sinusoidal waveform:
Crest factor = √2 = 1.414
For a square waveform:
Crest factor = 1
For a triangular waveform:
Crest factor = √3 = 1.73
For pink noise:
Crest factor ≈ 4
For (uncompressed) speech:
Crest factor ≈ 10
Form Factor
The form factor expresses the relation between the signal’s RMS value and average value. The form factor relates to the signal’s waveform in that a small form factor is an indication of a flat waveform and a large form factor is an indication of a waveform containing peaks.
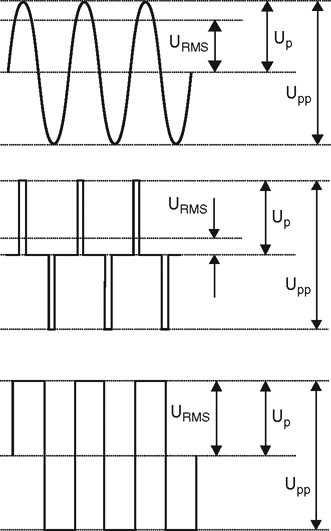
FIGURE 5.5 The relation between peak, peak-to-peak and RMS-values for different waveforms.
For a sinusoidal waveform:
For a square waveform: