Chapter |ten
Determination of Loudness
CHAPTER OUTLINE
Corrections to Zwicker’s Method
Dolby Leq(m) Movie Loudness/Annoyance
ITU-R BS.1770 — Loudness in Broadcast Programs
Loudness is a measure of how loud an acoustic signal sounds and we will naturally be interested in measuring acoustic sound in a manner that expresses precisely the loudness experienced. Depending on the application there are several methods for doing this.
In principle, a weighted measurement like IEC A is an attempt to measure sound as it is subjectively perceived. This, however, is very approximate and not sufficiently precise as a measurement of loudness.
The basis of loudness measurement is, of course, the “equal loudness” curves. Each point (and thus frequency) on the same curve sounds equally loud, even though the sound pressure varies with the frequency. The curves express constant loudness regarding constant tones, and this loudness is expressed in phons. When we depart from pure tones and move towards complex and composite sounds, which consist of many frequencies of different duration, it is necessary to compute data in a more comprehensive manner.
ZWICKER’S METHOD
The most important method for the measurement and computation of loudness of noise was described by Eberhard Zwicker. The same method has also been standardized internationally.
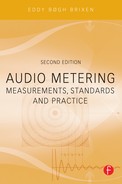
The basis of this method is a frequency division into the so-called critical bands. As input data for the model, 1/3 octave spectra are used. However, frequencies under 280 Hz are added on an energy basis. In addition, it must be determined in advance whether the spectrum concerned is recorded in a direct, frontal sound field (the sound comes from only one direction, the front) or in a diffuse sound field (where all sound directions are equally possible). Loudness can then be computed manually by using one of ten charts as described below (see Figure 10.1). Alternatively, a number of instruments can measure loudness directly and provide the result in phons.
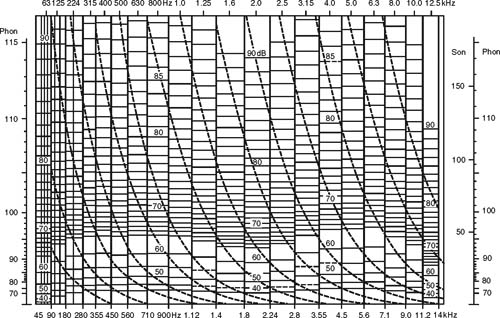
FIGURE 10.1 One of the ten charts used for the determination of loudness is shown here. This particular chart is called C8 and is used to determine loudness in a diffuse sound field for sound pressure in the 60–90 dB range.
The principles are described as a standard in ISO 532–1975. This standard actually specifies two methods for determining a single numerical value of a given sound; the first method is based on physical measurements, such as spectrum analysis in octave bands, and the second method is based on spectrum analysis in 1/3 octave bands.
Zwicker’s articles that formed the basis for the standard can be found in Acoustica, No. 10, p. 303 (1960) and in the Journal of the Acoustical Society of America, No. 33, p. 248 (1961).
Procedure
Manual determination of loudness by Zwicker’s method is performed in three steps.
First, the proper chart is selected. Are we measuring a direct frontal sound field or a diffuse sound field? Then the chart is selected where the highest value that occurs in the 1/3 octave spectrum can be plotted on the chart. The 1/3 octave values from 45 to 90 Hz are added together to one value. The same applies for the 90 – 180 Hz values and the 180 – 280 Hz values. These values are then plotted on the measurement chart.
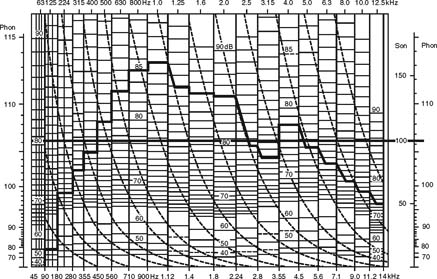
FIGURE 10.2 The measured 1/3 octave values are plotted on the measurement chart. Lines are drawn between the values from left to right. For a rising level, vertical lines are used. For a falling level, follow the dotted lines. Finally, a horizontal line is drawn where the area that is inside the curve above the line is of the same magnitude as the area that is outside the curve under the line. The line is extended to the scale on the right side. The point where it intersects the scale indicates the result.
The next step consists of connecting the levels plotted so that a following higher frequency band is connected with a vertical connecting line if the level in this next band is higher than the value in the previous one. If the next band has a lower value, the line follows a parallel to the slanted lines. (See Figure 10.2).
The third step consists of drawing a transverse line such that there is just as much curve area above the line as under it. The line is extended out to the scale on the sides of the measurement charts. The point of intersection then indicates the loudness value.
As mentioned earlier, the method has been standardized under the auspices of the ISO. The other charts can be found in the standard.
Corrections to Zwicker’s Method
Some researchers have made a revision to Zwicker’s method. This is not currently a standard, however. A description can be found in the following article:
Moore, B.C.J., Peters, R.W., and Glasberg, B.R. A revision of Zwicker’s loudness model. Acta Acoustica, vol. 82, pp. 335–345 (1996).
In practice, there are only insignificant differences between the original and revised versions of Zwicker’s method.
STEVENS’ METHOD
A somewhat simpler method was designed by S.S. Stevens. It is based on 1/1 octave analysis. It is not as precise as Zwicker’s method, but it is also included in ISO 532–1975.
Each octave band is converted to a loudness index based on a measuring chart similar to the example shown in Figure 10.3. It requires differentiating between a direct, frontal sound field and a diffuse sound field. There are only two charts to choose from.
FIGURE 10.3 Measurement chart used in the manual calculation of loudness as per Stevens’ model. This is the calculation chart for a diffuse sound field.
The different loudness indices are added using the following expression:
St = Sm + 0.3(∑S–Sm)
where
Sm = the highest loudness index occurring in the measurement concerned
ΣS = the sum of the loudness indices in all bands
St = the total loudness expressed in sones
DOLBY Leq(M) MOVIE LOUDNESS/ANNOYANCE
Dolby’s method, which was mentioned earlier when discussing frequency weighting, claims to measure loudness. However, the value obtained is rather “annoyance.” It is a method that was developed to measure the sound level of movies, particularly trailers and advertisements.
The measurement of a film’s sound is made electrically since it is presumed that a film will be played in a cinema with a calibrated sound system. The sound from each track is frequency-weighted and filtered with CCIR 468 (levelcorrected to 0 dB at 2 kHz). All signals are detected and then summed on an energy basis to a single value. An average is taken over the total length of the film. The final value arrived at in the measurement is designated Leq(m). This involves a dose measurement that adds the levels on an energy basis, since the measurement must relate to the sound field in the interior of the cinema.
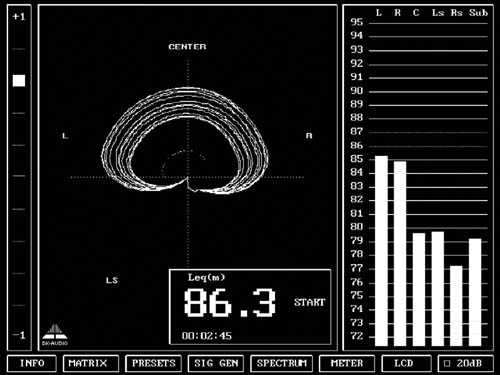
FIGURE 10.4 The Leq(m) standard has been implemented on, among other instruments,the DK-Audio MSD600.
When a test film from Dolby called Cat. No. 69 is played in a cinema, this meter would show that Leq(m) = 82 dB.
ITU-R BS.1770 — LOUDNESS IN BROADCAST PROGRAMS
In broadcasting it is a still increasing problem that viewers watching television programs often complain about audio loudness jumps at every commercial break. Television commercials have unfortunately been infamous for their high compression and loud play-out. Mixed with other program material the level has been evaluated as very uneven. The problem could not be solved with existing standard metering and the traditional level setting alone.
A lot of effort to address this issue was made in standards organizations as well as in private companies around the years 2000–2005. Most of these interested parties were gathered in an ITU-initiated workgroup created to address this problem. Large scale tests were initiated to find a practical solution for measurement and control of loudness. Many old and new algorithms and meters were tested against real program material. Fortunately, the outcome of the ITU work was presented in 2006 as a surprisingly simple solution that has become the ITU-R BS.1770 recommendation.
The basis for this recommendation is a weighting filter — the RLB curve (see Chapter 9 on frequency weighting) and a Leq measurement. The RLB (revised low-frequency B-curve) proved to be the best solution for continuous mono signals. As broadcast programs may contain not only mono, but also twochannel mono, stereo, and 5.1 surround sound, a further study was made to provide one single loudness value regardless of the number of channels.
The presence of a head in the sound field has an influence on the spectrum. The acoustic effect of the head modeled as a rigid sphere was taken into account by adding pre-filtering to compensate by raising the levels above 2 kHz by 4 dB.
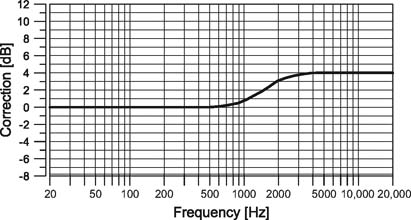
FIGURE 10.5 The ITU 1770 pre-filter added to all channels prior to summation in orderto compensate for the acoustic effect of the head.
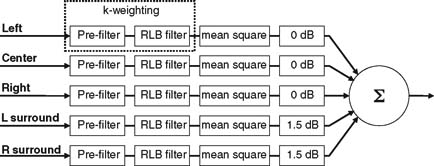
FIGURE 10.6 Block diagram of multichannel loudness algorithm (ITU 1770).
Humans’ awareness of sounds coming from the rear has also been taken into account by adding approximately 1.5 dB (a factor of 1.41) to the left surround and right surround, respectively, prior to the summation. The complete processing can be seen in Figure 10.6.
The additional weighting together with the original RLB curve received a new name: k-weighting. In this respect, loudness was indicated on a scale with reference to a full scale maximum. The loudness level thus became LKFS, meaning level, k-weighted, with reference to full scale. A unit of LKFS is equivalent to a dB.
The recommendation “ITU-R BS.1770 — Algorithms to measure audio programme loudness and true-peak audio level” has been a major breakthrough on loudness measures in the field of broadcast. It provides the possibility of defining a target level for the instantaneous loudness as well as of the full length of the program based on an adequate loudness measure. (It is however noted in the recommendation that in general it is not suitable for estimating the loudness level of pure tones.)
EBU R-128 — GATING
The European Broadcast Union accepted the ITU 1770 loudness algorithm. However, in the recommendation EBU R-128, the program loudness estimation has been taken a bit further:
The ITU 1770 algorithm measures rather long term or continuous loudness and does not take into account certain types of programs that may contain larger sequences with very low-level audio. This could be a TV program about wildlife having a narrator with long views overlooking the savannah while the wind is silently whispering in the grass in between the narration. If the level of the total program is averaged to reach the target level then the narrating part will be gained too much and become too loud on air. Additionally, commercials could be produced “creatively” including silence in order to become louder in the non-silent parts.
The EBU workgroup P/LOUD adopted the ITU algorithm for loudness estimation. One thing that was changed is that the named LKFS scaling was substituted by Loudness Unit relative to Full Scale (LUFS). However, in addition to this a gating function was introduced. This gating function halts the calculation whenever the loudness level is 8 LU below the target program loudness level. As mentioned, the basic loudness algorithm is the same as in the ITU recommendation but the gating function prevents sequences in the program from exceeding the target level. The practical loudness reading includes long-term, short-term and instantaneous loudness readings (more about this in Chapter 14 on Loudness Metering).
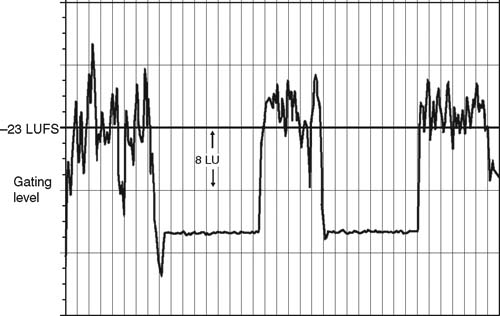
FIGURE 10.7 EBU-initiated gating function.
Bibliography
Zwicker, E. Ein Verfahren zur Berechnung der Lautstärke (A procedure for calculating loudness), Acustica, vol.10, pp. 304–308.
ANSI S3.4-1980 (R1997). Procedures for the computation of loudness of noise.
Moore, B.C.J., Peters, R.W., and Glasberg, B.R. A revision of Zwicker’s loudness model. Acta Acoustica, vol. 82, pp. 335–345.
ISO 532:1975. Acoustics e Method for calculating loudness level.
ITU-R BS.1770 (2006). Algorithms to measure audio programme loudness and true-peak audio level.
EBU Recommendation R 128 (2010). Loudness normalisation and permitted maximum level of audio levels.
Skovenborg, E., Nielsen, S. Evaluation of different loudness models with music and speech material. AES 117th Conv. 2004. Preprint 6234.
Soulodre, G. A., Lavoie, M. C., and Norcross, S. G. The Subjective Loudness of Typical Program Material, AES 115th Conv. 2003. Preprint 5892.
Soulodre, G. A. Evaluation of Objective Loudness Meters, AES 116th Conv. 2004. Preprint 6161.
Soulodre, G. A., and Lavoie, M. C. Stereo and Multichannel Loudness Perception and Metering, AES 119th Conv. 2005. Preprint 6618.