Chapter | twenty-seven
Other Measurement Systems
CHAPTER OUTLINE
Speech Transmission Index, STI
Following are some very brief descriptions of several measurement systems/ technologies in addition to those already discussed.
TDS
Time Delay Spectrometry, or just TDS, is a technique that was originally developed by Richard Heyser of Jet Propulsion Lab.
The technique is based upon a known signal being transmitted, for example through a loudspeaker. The signal is typically a short frequency sweep, which is then recorded through the system via a microphone. The receiver can be synchronized in relation to the measurement signal transmitted. A tracking filter is synchronized so that it passes the frequency concerned when it arrives. When the sound is reflected and returned to the microphone shortly afterwards, the filter will be tuned on to a different frequency, and hence the reflected sound will be rejected. In this manner, a free field can be simulated without any influence from reflections. The filter can of course also be delayed so that the reflections can be measured on their own if needed.
(Reference and further reading: “Time Delay Spectrometry” edited by John R. Prohs, published by the Audio Engineering Society.)
What is interesting about the TDS system is that it can emulate a large number of other measurement systems and that it is in a position to measure everything from distortion to reverberation time and speech intelligibility in rooms.
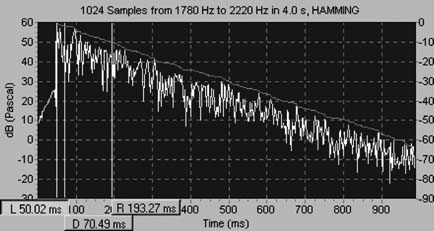
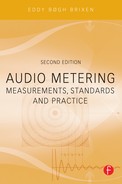
FIGURE 27.1 An analysis from a TDS measurement system such as those supplied by TEF®.
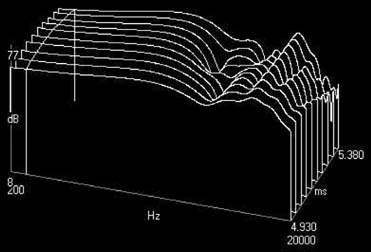
FIGURE 27.2 Waterfall plot with frequency spectra, generated by TEF®.
MLSSA/MLS
MLSSA is pronounced “Melissa” and is an acronym for Maximum-Length Sequence System Analyzer. This is a system for acoustical analysis of rooms and electro-acoustical components and systems. In contrast to other methods, MLSSA can be used for measurements over a large frequency range and a long time span at the same time.
MLSSA, as well as many other later developed systems, is based on the MLS (Maximum Length Sequence) method. The excitation signal is a periodic sequence of pseudorandom binary digits. A measurement system is typically based on a sound card in a computer. Measurements can be performed in a very short time and various post-processing options for the measurement data can give information concerning impulse response, the reverberation time in a room, frequency response, and speech intelligibility for electro-acoustic systems. MLS-based measurement systems can also emulate more traditional systems, such as the 1/1 octave or 1/3 octave analyzer.
SPECTROGRAPH
The spectrograph is an instrument – or software package – that can simultaneously display three parameters of a sound signal. It shows time on one axis (the x-axis) and frequency on another axis (the y-axis), and the level is shown by the degree of density. Some analog spectrographs are still in use. However, most spectrographs today are based on FFT analysis and run on computers.
The spectrograph is used in particular for voice analysis (both humans and animals), utilizing filters with both narrow and relatively large bandwidth. However, the spectrographic display (in colors) also forms a basic editing window for “spectral editing,” where specific frequency components can be altered without affecting other parts of the frequency range.
Figures 27.3 and 27.4 show an analysis of the author’s utterance: “Audio Metering.” Different filter bandwidths have been applied in each figure.
FIGURE 27.3 Spectrogram of the author’s utterance: “Audio Metering.” The horizontal axis is time, and the vertical axis is frequency (linear scale), whereas the degree of density indicates the level. A wide filter of 100 Hz was used, so that the individual harmonic overtones in the voice are not seen, but rather the formants, which are comprised of multiple harmonic overtones within a certain frequency range.
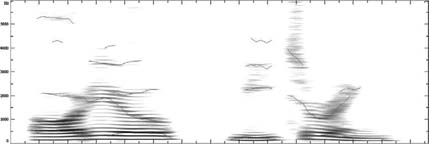
FIGURE 27.4 An analysis of the same sequence as above is shown here, but a narrow filter (10 Hz) has been used. It now shows a plot of the overtones instead. The analyses were performed with STx.
TRANSIENT ANALYSIS
A very large part of the current measurements and analyses of sound involve finding the RMS values of the signals, either in the entire spectrum or as a function of the frequency. The signals are regarded as constant within the period concerned.
Nevertheless, events can occur in the perceived acoustic image that are clearly audible, but difficult to measure using the traditional methods. Examples of this are things like a single click or “glitch” in the sound due to erroneous sampling, drop-out, or clipping. There can also be mechanical rattle from objects in the listening room, which are set in motion by the oscillations of the loudspeakers. Or by the loudspeakers themselves, which, due to the moving coils scraping against the magnet, produce some audible, but not easily measurable, noise. Transient analysis is the tool that makes a large number of these phenomena “visible.” Instead of measuring the RMS value of the signal, the signal’s instantaneous change in energy is measured.
This technology applies even to audio forensics when looking for possible edit points in the process of the authentication of digital audio recordings.
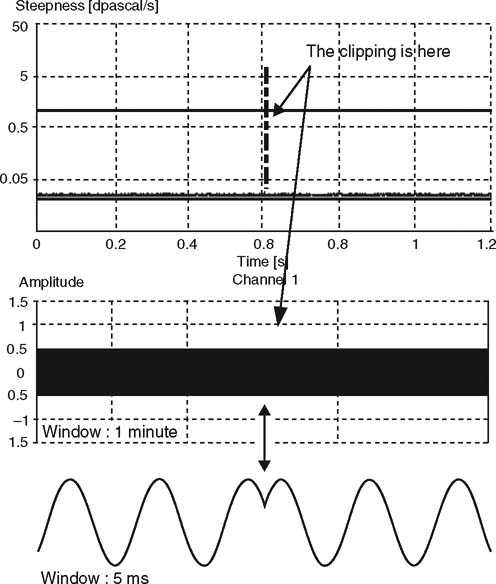
FIGURE 27.5 Example of a transient analysis of a sinusoidal tone where a clip has occurred. The analysis clearly shows where this audible click occurs, even though it cannot be seen on the time signal before zooming all the way in. The analysis was performed with Harmoni™ Lab.
SPEECH TRANSMISSION INDEX, STI
At the beginning of the 1970s, it was proposed that MFT, Modulation Transfer Function, be used as a method to describe the intelligibility of speech in a room. MFT expresses an apparent signal/noise ratio since not just background noise, but also the reverberation of the room, is regarded as noise in the signal transmitted. The method shows how “unscathed” a speech signal is, transferred from the sound transmitter to the listening position. MFT technology used for speech transmission has been given the name STI, short for Speech Transmission Index. The method is used both for the computation and the measurement of speech intelligibility.
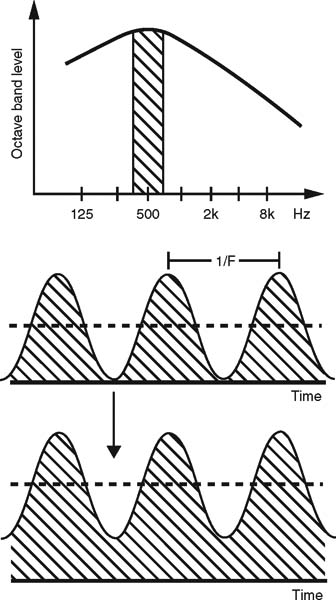
FIGURE 27.6 Principles of STI: Octave band noise (here 500 Hz) is modulated at a number of frequencies. When measuring STI, seven octaves are used, whereas for RASTI only two are used. In STI-PA all seven octaves are used however, with fewer modulation frequencies. The modulation index is determined for each modulation frequency and all results are combined to one single number.
This method uses the seven octave bands from 125 Hz to 8 kHz, which in total cover a frequency range corresponding to the spectrum of human speech. Each octave band is modulated by 14 different low frequencies, which in 1/3 octave steps go from 0.63 Hz to 12.5 Hz. The low-frequency modulation corresponds approximately to the modulation in speech. For each combination of carrier frequency (octave band noise) and modulation frequency, the MFT is computed or measured. This gives in all 98 sets of data, which are then reduced to a single number, that is the STI value for the combination of sound source and listening positions concerned in the room under investigation.
Subjective Scale
The STI values are related to a subjective scale, with designations running from “Bad” to “Excellent.” An STI value of 0.6 or better is normally what is aimed for. This corresponds at least to “Good.”
FIGURE 27.7 This scale indicates the relation between the STI-value and the subjectively assessed speech intelligibility
RASTI
Since a complete STI measurement is quite comprehensive and time-consuming, a reduced version called RASTI was developed. RASTI stands for RApid Speech Transmission Index. (Some call it Room Acoustic Speech Transmission Index.) Only the most significant combinations of carrier and modulation frequencies are included in it, amounting to nine combinations. However, the principles are otherwise the same as for STI. For a period of time, standardized RASTI measuring equipment has been the only practical way to perform measurements. The limiting factors of the RASTI measurement is that it does not accept nonlinearities in the signal chain like compressors, limiters, and the like, which in many cases may increase the intelligibility of a system. Therefore the RASTI values have primarily been valid for the measurements of pure acoustic spaces. The RASTI measurement is rarely used today, as a more comprehensive and yet easy-to-handle method has been developed.
STI-PA
STI-PA is short for Speech Transmission Index for Public Address Systems. Like RASTI, the STI-PA is a derivative of STI. However, this reduced methodology provides results that are sufficiently comprehensive to be compared to complete STI measurements. It was developed to cope with the nonlinear processing environment common to advanced sound systems, and to reduce the measurement time required to a practical level.
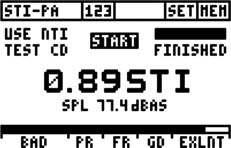
FIGURE 27.8 STI-PA readout from a handheld device (NTI AL1 Acoustilyzer). The display shows that the measurement is finished and that the value is 0.89 (which corresponds to “Excellent”).
STI-PA supports fast and accurate tests with portable instruments that are able to evaluate speech intelligibility within 15 seconds per position. The STI-PA signal can be generated from a (professional quality) CD player or directly from a file-based signal generator. Implementing an artificial voice source an end-to-end system check including the microphone can be performed.
The procedure includes different routines to get the correct result: If the STI-PA value measured is less than 0.63, two more measurements must be made and all three results are averaged. If the results differ more than 0.03, three further measurements must be made and all six readings are averaged for the final results. Results that in the same position vary more than 0.05 should not be accepted. This kind of error may occur if the background noise is very impulsive or otherwise is varying. Measurements can be made at a time with less background noise and the results can be corrected using dedicated software.
Emulated STI Measurements
There are other types of measurement instruments, based on TDS and MLS, which are used to measure STI, RASTI, and STI-PA. Handheld microphones are basically not allowed. Additionally, time-varying background noise must be prohibited. Still, when comparing the results of the measurements from these systems, they are not completely in agreement with the “real” measurements and should not be used for documentation.
Standards
Following are some of the standards that require STI data:
ISO 7240 Fire detection and alarm systems.
NFPA 72 National Fire Alarm Code 2002
BS 5839-8 Fire detection and alarm systems for buildings. Code of practice for the design, installation, and servicing of voice alarm systems.
DIN 60849 System regulation with application regulation DIN VDE 0833-4.
LOGGING SYSTEMS
Noise regulations in the entertainment industry have been introduced in many countries. Even “awesome” music can be considered noise. Especially in venues for rhythmic music it is essential to control the sound level during a concert. The front of house (FOH) engineer should have proper information so he or she can keep the concert rolling and avoid being stopped by authorities due to excess of local limits.
In the measurement of environmental noise the limit is normally defined by the A-weighted equivalent level measured during a given interval of time ranging from minutes to hours. However, in order to control the level the time interval usually is in the range of 5–15 minutes.
Due to legislation, very often the levels measured have to be reported. Thus a noncorruptible logging system has to be installed.
Systems and programs for this special purpose have been developed. The best of these perform to the same standards as integrating sound level meters and include a calibrated microphone. Additionally, clear displays are provided showing the actual A-weighted sound pressure level and the C-weighted peak level. The A-weighted Leq is calculated from the start. In some cases a special readout can tell if you are safe or if you are close to the limits and should “hold your horses.” When the job is done an encrypted data file with logging data can be extracted from the system. Even if the connection to the microphone was broken during the measurement, this will be noted in the file.
European legislation is based on DIRECTIVE 2003/10/EC OF THE EUROPEAN PARLIAMENT AND OF THE COUNCIL of 6 February 2003 on the minimum health and safety requirements regarding the exposure of workers to the risks arising from physical agents (noise).
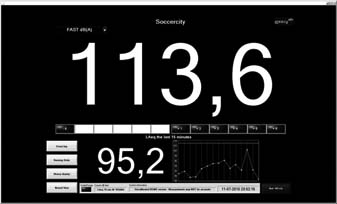
FIGURE 27.9 Screenshot of readout from the measurement system “10eazy”.