Lean methods and tools (part I)
This chapter discusses 5S workplace organisation in Section 1 and visual management in Section 2.
SECTION 1: 5S WORKPLACE ORGANISATION
Introduction
5S is on the surface level a housekeeping practice, a deep spring clean. Untidy and cluttered workplaces are less productive. However, the deeper aim of 5S is to develop a team member’s awareness and responsibility of normal and abnormal conditions in their immediate work area. It enables people to see problems and waste as soon as they surface and facilitates root cause problem solving. 5S creates the environment for Lean and supports many of its methods, for example standardised work depends on having equipment and tools always in the same place. 5S is, in essence, a visual communication of the workplace status. 5S also becomes an ongoing practice to help your people think about how their work area is laid out and arranged, and for them to act on all the small things that can make it better, safer, more ergonomic and easier to work in.
5S is a common starting point on the Lean journey as it is very employee centric and improvements are quickly visible. Jane Norman of Profound Knowledge Products Inc. uses the analogy of mowing the lawn to describe the impact of 5S: an immediate and distinct improvement in the work environment. Organisations that have successfully applied 5S are proud to have visitors tour their pristine facilities and learn from them.
Consequences of disorganised workplaces include:
- safety risks due to physical obstacles and concealed hazards
- lost time searching for materials and equipment
- defects and equipment breakdowns resulting from contaminated surroundings
- incorrect deliveries
- difficulty in distinguishing between what is and is not needed and in identifying problems.
The 5Ss are:
- Sort (remove all items and general clutter not used in the area)
- Set-in-order (arrange items so they can be found when needed within 30 seconds)
- Shine (clean and inspect the workplace and equipment to uncover issues and prevent problems)
- Standardise (make an organised workplace the norm for the area)
- Sustain (conduct audits to ensure continuous improvement and the prevention of back sliding).
In my experience, 5S that is well structured and supported is one of the most powerful methods for delivering a positive return on investment. This is because every one of your employees performs thousands of tasks every week in each of their areas, and seconds saved from wasted work such as searching, duplication and walking add significantly to the bottom line. These small savings grow appreciably when multiplied by hundreds of people on the shop/office floor each day of the year.
Waste (symptom) and 5S countermeasures
The potency of 5S is in attacking the sources of waste:
| Waste (symptom) | An example of a 5S countermeasure |
| Transport | Locate equipment at point of use |
| Inventory | Inventory reduced on line due to kanban (see Chapter 8) racking |
| Motion | ‘Treasure hunts’ for missing tools eliminated with shadow boards |
| Waiting | Machine changeover time is reduced with tool colour coding (set-in-order) |
| Over-production | Floor ‘footprints’ and visual management to prevent overbuild |
| Over-processing | Status of product at each stage is evident and handled only once |
| Defects | Abnormal conditions are surfaced in real time |
| Design | Changeover clamps are painted yellow to deter from leaving behind in the press |
| Overhead | Facility floor space is better utilised (less in-progress inventory) |
| Energy | Air leaks repaired during third S (shine) |
| Safety | 5S is major safety enabler – loose cables, trip hazards, etc. |
| Ideas | Employees come up with ideas to remove waste |
| Technology | Find any file in your PC in 30 seconds! 5S is virtual here – think about the cost spent searching hard drives for files in your facility every day |
How to apply 5S workplace organisation
Before rolling out 5S it is good practice to meet the work team in the pilot area. Start by asking what has wasted people’s time over the past week. This will help people to connect with the benefits of 5S because it will be linked with the objectives of the organisation and identify with employee hassle factors such as searching for tools or continually solving the same problem day after day for the past 10 years! People will accept change when they are involved in the decisions and the outcomes are meaningful to them. This is no different with 5S.
Select a 5S champion who will drive the pilot rollout and prove the concept prior to a more extensive rollout. All employees in the area are given an overview of what 5S is and what deliverables are expected. The 5S champion and a small group of frontline employees conduct a baseline 5S audit and take photographs capturing the condition of the workplace at this precise time.
Sort
5S veterans will attest that approximately a third of items in any pre-Lean workplace are not required or are just general clutter or rubbish. The sort stage will address these excess items.
Unnecessary items are red tagged as a visual control cue that they are to be moved out to an interim holding area. The team will later make a decision on the items in this area. This approach encourages people to be ruthless about moving stuff out as the interim holding area provides a safety net. If the team decides that an item is needed again it can be returned. It is also a control against throwing out business critical items. Items are logged by an appointed person on a red tag log sheet (see Figure 4.1) at the red tag holding area, in real time, and an estimate of cost is recorded. Later this sheet is updated with the disposition decision.
A word of caution on sort: people’s personal items are a sensitive issue, so adhere to the ‘respect for people’ pillar here. It will enable hoarders to move out more excess items in the long run. Examine the workplace three dimensionally, ground, walls and ceilings, and categorise all items in the area under one of the following classifications:
- excess (move out to the red tag holding area)
- obsolete (move out to the red tag holding area)
- defective (move out to the red tag holding area)
- not needed in the area (move out to the red tag holding area)
- used every day (store at point of use or carry with you)
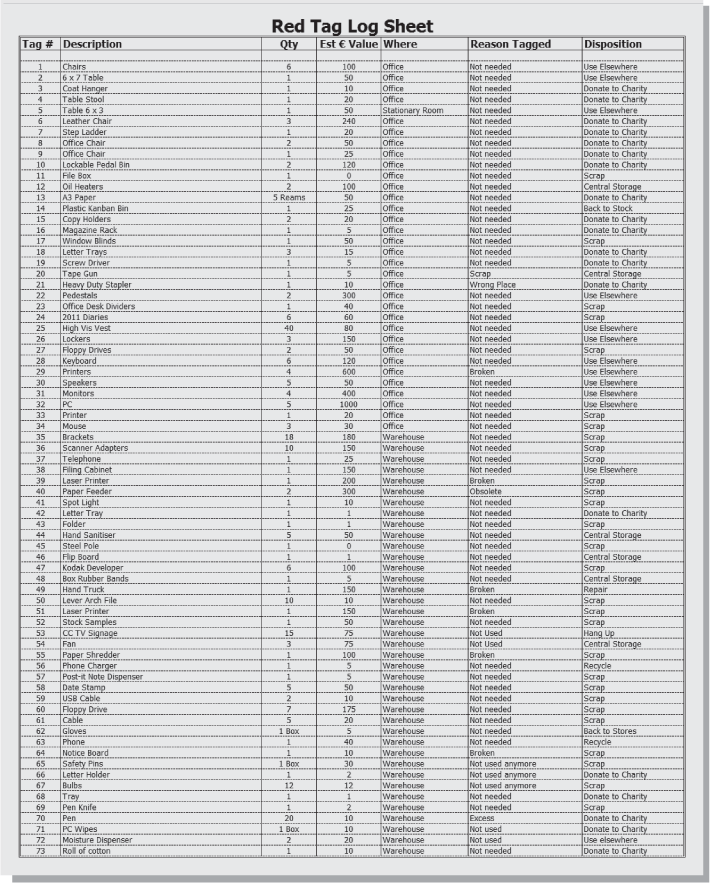
Figure 4.1 Red tag log sheet example
Set-in-order
The objective of this phase is to arrange the remaining items so that they can be easily found and are in locations where they are needed to facilitate the smooth flow of work. Floor areas can be marked and labelled with stencilling to outline equipment and material ‘home’ locations (see Figure 4.2). Signage can also be suspended from the ceiling with strong fishing line to identify drop locations or kit locations, etc. Aisles and other location zones can be demarcated with colour coding using industrial grade floor tape or line paint marking machines.
Figure 4.2 Equipment home locations
Shadow boards are a very simple visual control that allow people to have easy access to the tools that they need to do their jobs. An outline of the tool or supply is drawn on a board and the tool or supply is attached with Velcro® or similar. If a tool is missing it is obvious. Some of the benefits of maintaining shadow boards include:
- time is not lost looking for equipment and parts; quick retrieval of tools is necessary for the job
- frustration of missing/no tools no longer affects employees, hence morale is improved
- makes it easy to see if parts are missing/worn out as it is a visual tool
- tools last longer (they are not misplaced or go missing)
- pressure is applied to replace missing/worn out tools, as it is obvious there is a deficiency
- clears up clutter and gives the workplace a tidy and orderly look, and improves safety
- financial savings as equipment does not need to be replaced as often
- a complement to high productivity (eliminates ‘treasure hunts’ for equipment) and quality (using correct tools/jigs, etc.).
However, all the above benefits are lost if boards are not maintained by all employees. Later, in Chapter 11, we discuss the Lean management system that enables Lean methods and tools such as shadow boards to be sustained.
Shine
Lean views cleaning as inspection or looking for non-conformances. When you wash and shine your car you notice if there is any damage or minor imperfections. The same philosophy applies to workplace equipment and products. Work teams should establish 5–10 minute routines for cleaning up every day. A deep clean can be performed periodically to restore areas to a pristine level. Teams also perform ‘visual sweeping’ to look for sort and set-in-order status. Refurbishment and painting are also often carried out during the shine phase.
The quality of an organisation’s products or services is strongly mirrored by the condition of the workplace. 5S creates the environment for excellence. Morale and stress will also be greatly improved in post-5S environments along with employee involvement in continuous improvement. It is unlikely that employees will step forward with ideas for improvement if their work environment is in disarray.
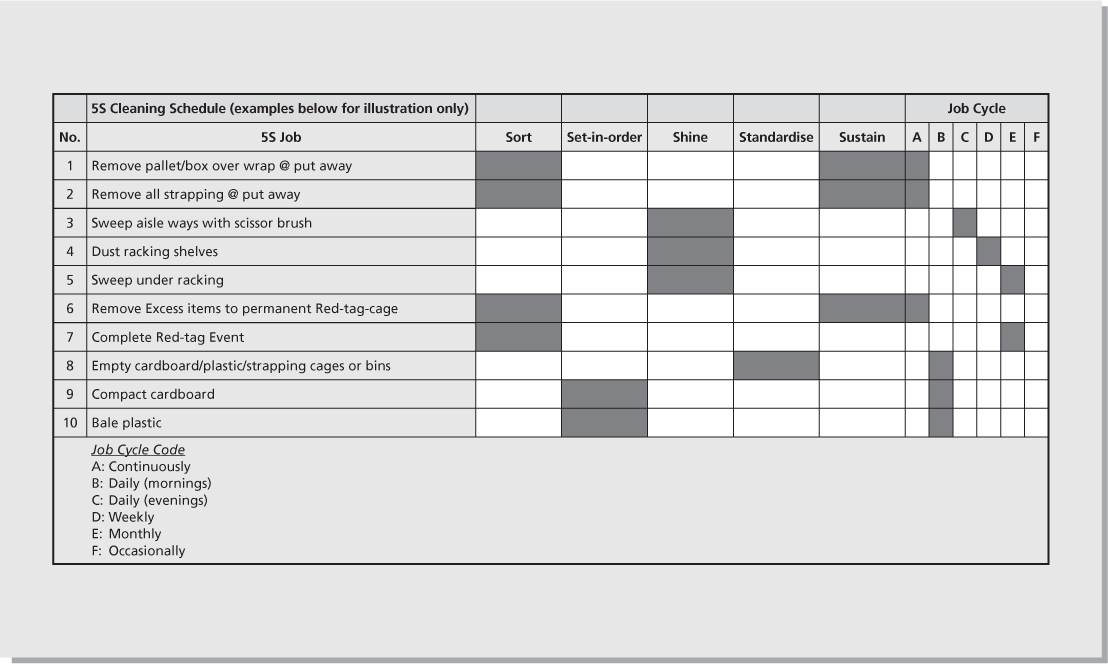
Standardise
You deploy standardise to ensure best practice in the sort, set-in-order and shine activities. A cleaning schedule is developed to make daily cleaning systematic and to put cleaning on the same stage as making the operational numbers. A sample cleaning schedule is shown in Figure 4.3.
Leader standard work is the glue that keeps 5S (and all the Lean methods) from falling apart and becoming another fad of the month. This forms a central element of the Lean management system discussed in detail in Chapter 11. Roles and responsibilities are cascaded down by level in a collaborative fashion. The ‘who’, ‘what’, ‘why’ and ‘when’ are detailed (see the hospital example in Table 4.1). The ‘why’ or purpose of any activity is particularly important. A good example from a hospital is cleaning: are we cleaning rooms or preventing infection? Bring out into the open the purpose of people’s work to drive people’s intrinsic motivation to improve.
Table 4.1 Leader standard work for 5S (leaders exist throughout the organisation)
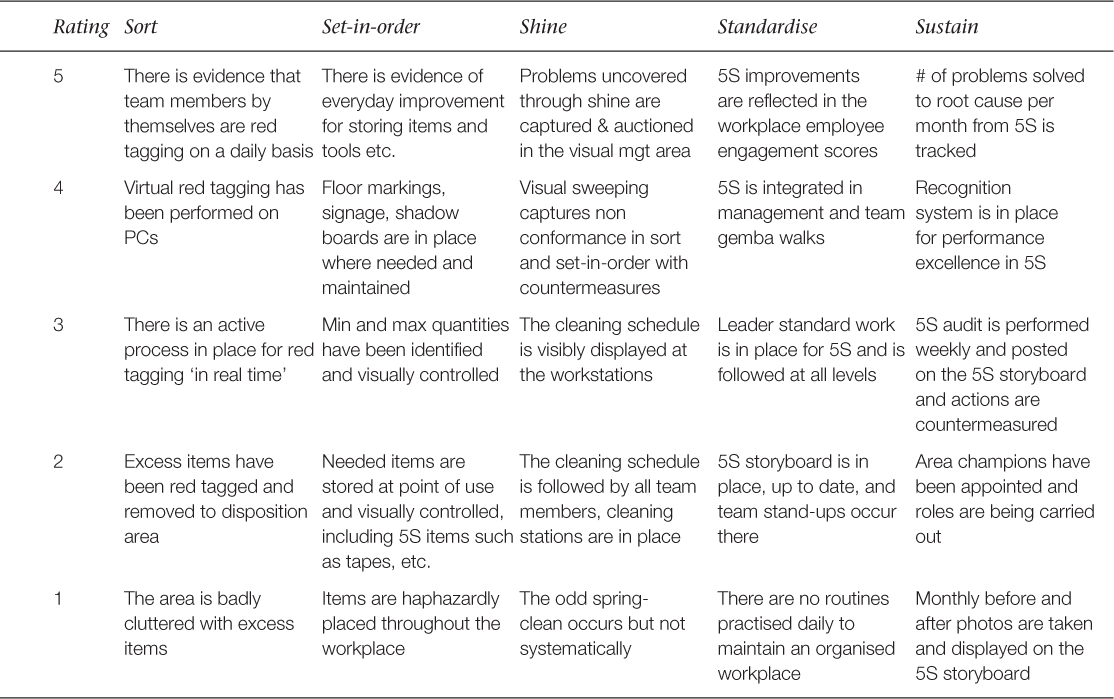
Sustain
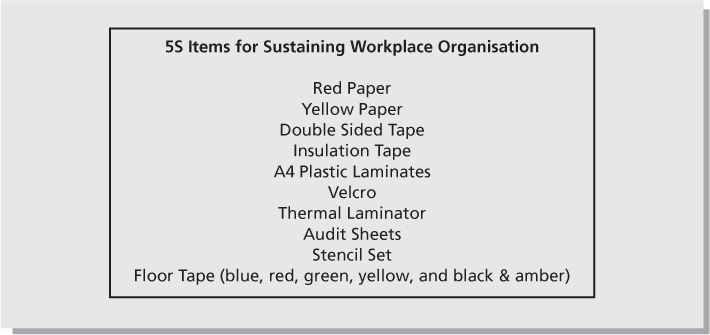
The final ‘S’ is the element that enables stability and further continuous improvement. The audit detailed in Table 4.2 conducted on a weekly basis highlights that non-conformances, along with countermeasures, should be driven through the 5S storyboard (see Figure 4.4). To compare the before and after conditions of your workplace, photographs should be taken monthly and compared with the previous month’s photos. This will visually demonstrate improvement or deterioration. A permanent red tag area is helpful so that unneeded items can be removed on the go and not just in periodic clean-ups. This prevents the rebuilding of clutter. 5S supplies such as tapes, stencils, cameras and signage materials should also have their own readily accessible home location (see Figure 4.5). The supervisors of each area are a critical resource in driving and sustaining the 5S improvement agenda and for making time for 5S. The 5S storyboard should be the nerve centre of sustaining the gains. This is where the monthly before and after photos are displayed, area champions are recognised and audit activity is tracked (see Figure 4.4).
Table 4.2 5S audit
It is when things are busiest and people are under pressure that compliance with 5S is most important. It facilitates smooth work flow and prevents problems. Dr Maxwell Maltz in his groundbreaking book Psycho-Cybernetics1 noted that it took 21 days for amputees to stop feeling phantom sensations in an amputated limb. From further research he found it took 21 days to create new habits in general. Therefore the first month or so of a newly rolled out initiative needs strong and visible management support to hardwire the newly required behaviours.
5S review
As with Lean, 5S never ends. If it takes people more than a few seconds to find something, your employees should ask themselves ‘Why?’. A decade after Toyota’s Kentucky plant began 5S training management say that employees are still coming up with approximately 6,500 5S ideas alone each year. The beauty of problems discovered via 5S is that they are usually implemented quickly (as they are small problems) and have a positive effect on employee irritations. Productivity is also greatly improved. For example post-5S activity shadow results from the nursing profession reveal that between 1–2 hours of time can be released back to caring at the bedside per nurse per shift.
5S improves morale and ownership of the workplace, encourages involvement and continuous improvements. 5S mitigates what is referred to in the field of social science as the ‘broken windows theory’. Once one window in a derelict house is broken, soon they are all broken due to the abandonment perception. You can observe the same effect when streets start to be littered at large social occasions, etc. The same applies to our workplaces and 5S is the countermeasure. 5S hits all four True North metrics. The subtle hidden benefit of 5S is that it builds discipline – the discipline to lay the foundations for excellence – and Lean is all about disciplined execution of the basics, just like any good team in sport.
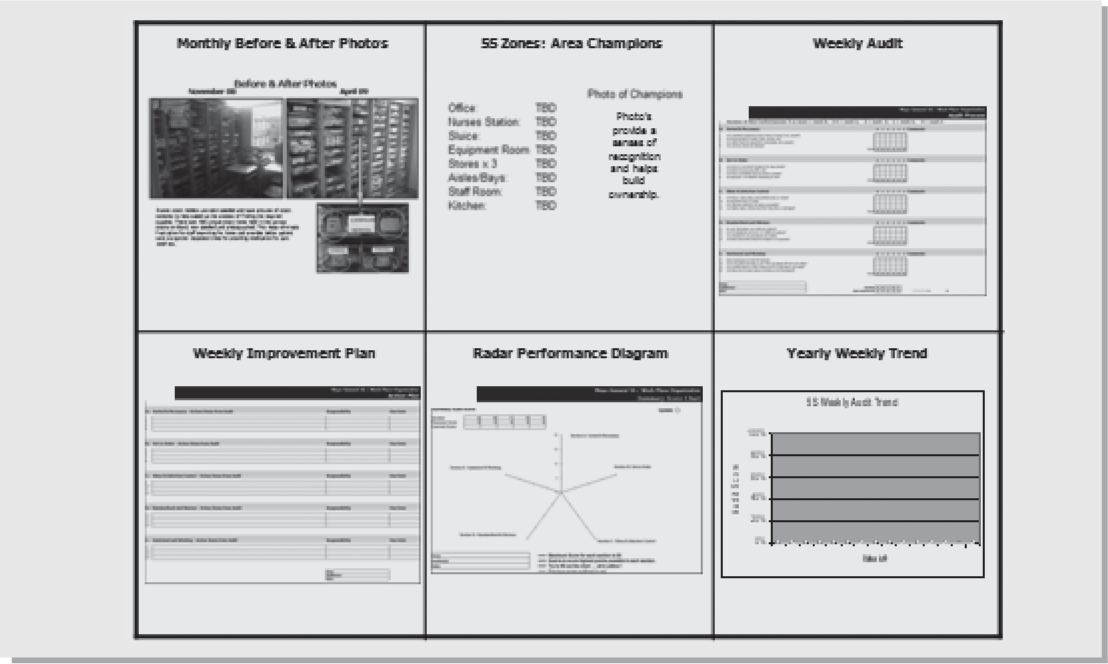
Figure 4.4 Paediatric Ward 5S: workplace organisation storyboard in office
SECTION 2: VISUAL MANAGEMENT
Introduction
One hallmark of managing in a Lean culture is quick response to deviations from the standard process. Two elements are required to realise this in the workplace: a defined, agreed upon standard (that works well and is followed by all) and a method to quickly determine departures from that standard. This is the purpose of visual management.
With visual management, a quick walk through the workplace is all that is needed to determine the status of the area – is it a good day, a bad day – and if intervention is required. Hence organisations must strive to design a workplace that almost talks to you, one where problems become immediately apparent.
By responding to issues at the time they occur and asking ‘Why?’ five times (more or less), root cause(s) can be quickly identified. The causal trail is still warm and process corrections can be made relatively quickly before the problem escalates.
About 80% of our brains is dedicated to visual processing. We need to recognise and incorporate this fact into our workplace design. A visual workplace is devised of mechanisms that are purposely created to communicate information at a glance and without the need for verbal intervention. An example of visual management is the departure screen at an airport. Visual systems can share information not just through the sense of sight, but also through sound, touch, smell and taste. In tandem with 5S (5S prepares the way to workplace transparency), visual management lays the foundation so that the basics are performed flawlessly. Without the basics, operational excellence is unattainable.
To create a visual workplace you need to ask:
- What decisions do employees need to make?
- What do they need to know in the area to make those decisions?
- What would an employee need to know if it was their first day working in the area?
The deliberate design of the workplace removes the need for decision making based on unspoken tacit knowledge. It is proven that the fewer decisions a person has to make whilst performing a job, the fewer mistakes are likely to occur due to reduced ambiguity and cognitive workload.2
To check if a workplace is satisfactorily designed from a visual management perspective you could ask if a stranger could walk into the workplace and be up to speed with the workings of the area within five minutes.
Examples of good visual management include: transparent machine covers and guards, colour coding, floor marking to designate areas for different tasks, shadow boards for supplies and tools, work team storyboards with charts and metrics, location signage and equipment labels.
Why use visual management?
The purpose of visual management is:
- to make problems immediately visible
- to prevent having to ask avoidable questions
- to enable somebody to see if things are missing
- to help workers and management stay in contact
- to clarify targets for improvement
- to promote communication (from my experience communication is one of the major root causes of defects and errors)
- to promote employee involvement and inclusion through maintaining the visuals
- to reduce errors (well-designed systems reduce baseline error rates by approximately one third)
- to reduce search time in the workplace
- to make everyone’s jobs easier and less stressful
- to recognise achievements and improvements.
Levels of visual management
There are four levels of visual management, each level building on the ones below.
Table 4.3 Four levels of visual management
| 4. Visual management (sustaining levels 1–3) | Daily practice of the three techniques below to manage the workplace and quickly detect issues, hence triggering root cause problem solving. |
| 3. Visual controls (defect prevention) | To detect abnormal conditions at a glance before they become a defect. Examples include floor marking and signage to outline locations, mistake proofing devices (think three-pin plug), production status andon systems (refer to the Glossary), and colour coding. |
| 2. Visual display (information sharing) | All the information for workplace decision making such as standards and status storyboards are available at a glance and kept up to date. |
| 1. 5S workplace organisation (process transparency) | Area is designed for optimum performance, safety and immediate exposure of non-conformances. |
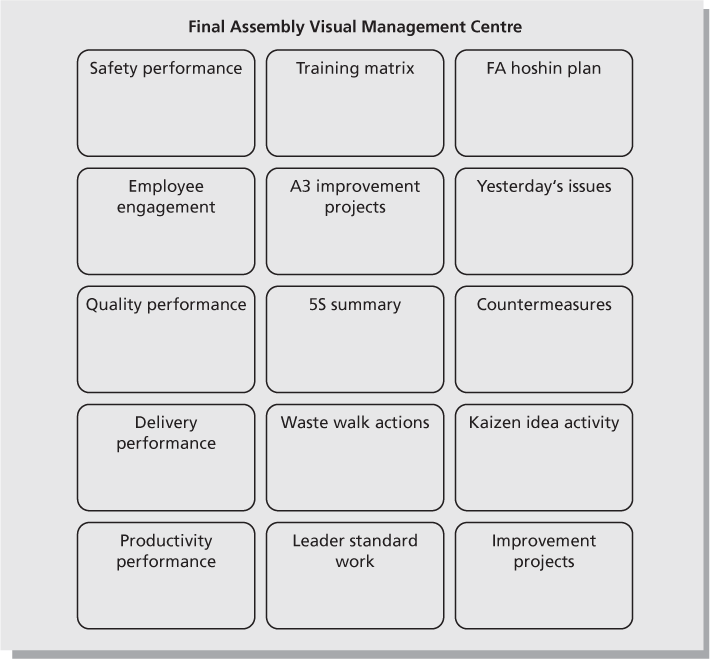
Visual management centre (VMC)
A VMC (see Figure 4.6) is the central repository of the visual displays in the workplace. The purpose of the VMC is so that anyone in the workplace, even those who are unfamiliar with the detail of the processes, can rapidly see what is going on, and distinguish what is, and is not, under control.
You can use the VMC in your organisation to:
- be the focus area for your daily stand-up meetings to understand and indicate work priorities
- see whether daily, weekly and monthly performance metrics are on or off track
- identify abnormalities or when something is going wrong or not happening in your workplace
- display hoshin kanri (refer to Figure 2.3) plans, A3 problem-solving activity (covered in Chapter 5), leader standard work (see Chapter 11), waste walk activity (see Chapters 1 and 11), 5S audit, skills versatility matrix, etc.
- communicate to everyone what performance measures are in place
- provide real-time feedback on all aspects of your workplace per-formance
- cut down on ad hoc meetings to discuss work issues.
VMC success factors include: a daily assessment of information; timely problem resolution; and an identification of the drivers behind the numbers.
Operational tracking at the gemba
Operational tracking at the gemba refers to visual display of real-time, manually updated records of the actual outcomes from a process versus the defined target performance level. An example is shown in Figure 4.7 where actual production numbers are entered on an hourly basis in the columns corresponding to each day of the week. When the number is below (or indeed above) the target the reasons for this are recorded. This then triggers real-time problem solving and countermeasures to correct problems. This board is updated by the frontline staff running the process and provides both a tempo to the work environment and a mechanism for employees to highlight problems that are hindering them in achieving their target numbers.
A useful template, illustrated in Table 4.4, can be used to audit the level of visual management in your own workplace and address any gaps.
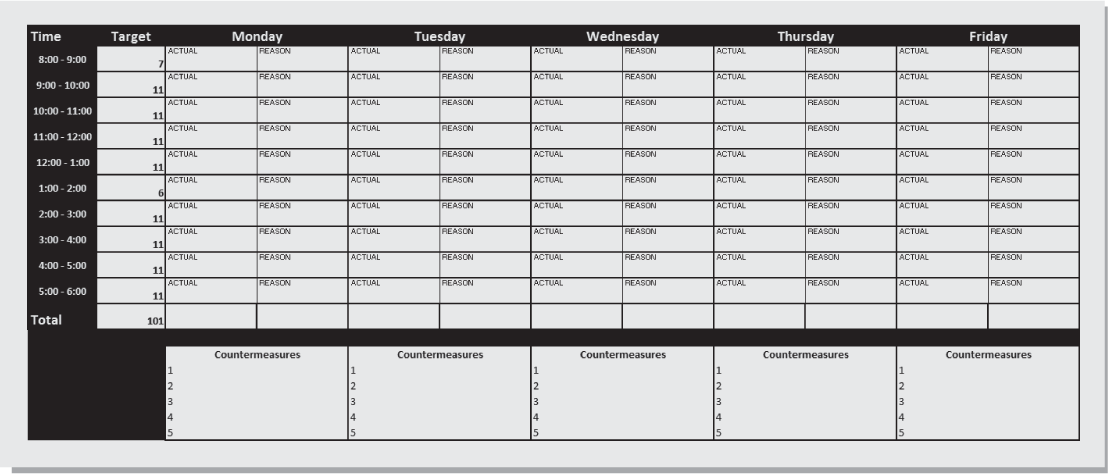
Figure 4.7 Week by the hour report3
Table 4.4 Visual management assessment (manufacturing example)
Visual management review
Visual management is not about the area looking attractive; it is about working better through non-verbal sharing of information and operational status. It is management by sight and what gets measured, gets improved. In my experience once your employees experience the positive benefits they will be asking for deeper and broader applications. As with all communication channels the key to a positive delivery is to make metrics meaningful at each level of your organisation. You must make sure that the increased transparency through information sharing and posting of operational metrics is not perceived as punitive to people. Demonstrate through communication and actions that the intention of visual management is to provide a strong focus on the process, resulting in improvement of the system. The intention is not to blame people: Dr Deming advised us that 94% of problems are system not people related.