
Lean methods and tools (part II)
This chapter discusses A3 problem solving in Section 1 and standard work in Section 2.
SECTION 1: A3 PROBLEM SOLVING
Introduction
‘No one has more trouble, than the person who claims to have no trouble.’
Taiichi Ohno
Problem solving is central to Lean management and is the primary method of realising improved performance. The quotation above, from Taiichi Ohno (Toyota’s principal Lean sensei), shows that problems are welcomed in a Lean environment. In many businesses a culture of hiding problems is commonplace and this is extremely destructive to organisational success. In your organisation you should be pleased if you come across problems as they are the seeds of improvement.
A problem is defined as any obstacle that prevents the attainment of the target condition (the gap between the current and desired state). A problem usually presents itself as a symptom of an underlying, more deeply concealed, root issue. It is commonplace across industry to put a sticking plaster on problems or to solve the surface causes or symptoms.
The root cause of problems can be generally classified into three categories:
- No standard work.
- Standard work exists but is not followed.
- Standard work exists, is followed, but is not adequate.
A3 problem solving is the Lean methodology used to build consensus and mentor people in problem solving. A3 assists people to observe current reality, present facts, propose working countermeasures, gain agreement and follow-up with a process of checking and adjusting the actual results. It works through a large and smaller nested PDSA (see Chapter 1 for a definition) cycles. It is called A3 as it is confined to a single sheet of A3 paper for maximum conciseness and clarity. The format also reduces management communication time and nurtures deep thinking. It enables an intense vigilance on the problem through its structured approach and encourages collaborative team-based conversations about the problem.
It is common for A3s to contain both hand-written text and sketches. A picture is worth a thousand words and engages creative right brain creativity. At the outset you and your team should spend adequate time properly clarifying and defining the problem. From my experience the problem often goes through numerous iterations as you proceed through the phases of the A3 and your understanding increases through the diagnosis stage in particular. However, spending time to define the problem to your best level of current knowledge at the outset is a key factor for successfully addressing root cause(s) later in the process.
A3 is not a linear form of problem solving and teams should move backwards and forwards through the steps (just as in the problem definition above) to update the A3 sheet as the knowledge about the problem expands under each section. A3 problem solving should be performed at the gemba (the place where the actual problem occurred – also known as the point of cause) involving those who work in the process. This enables the maximum number of relevant ideas to surface and fosters local ownership required for successful problem resolution. If you do this, it is likely that successful problem-solving activity will spread through your organisation as frontline employees directly see the benefits. Blind copying is not encouraged though; solutions that work in a particular set of circumstances and time often need to be modified when leveraged elsewhere in the organisation.
A3 problem solving consists of nine steps (see Table 5.1). Note that the challenge is to work diligently through all the nine steps. For many people it is tempting to skip steps 1–3 and go straight into the analysis phase and then stop at step 5 or 6 when a certain comfort level is reached through problem containment. One of the major building blocks for the creation of a Lean culture is for your management team to commit to following all nine steps of this process. The goal should be that the nine steps evolve to be the way that people in your organisation think conceptually about issues in their heads as well as on paper. The one thing that distinguishes the elite performing Lean organisations is their diligence in working through all nine steps involved in A3 systematic problem solving.
A3 will foster dialogue and communication in your organisation. It’s not just down to one person; A3 is a team endeavour. The authority to make changes is built through the A3 owner building consensus with stakeholders. You will see that this is a shift from the traditional practice of authority being viewed as the entitlement of those of power or higher rank in the organisation. In a Lean culture, developing an A3 and taking ownership is encouraged at all levels. It is a powerful persuasion technique to help influence other people. Leaders with authority to make changes that solve problems that result in improvements should be independent of hierarchy.
It is critical that problem surfacing and solving takes place against a backdrop of a non-penal culture. By this I mean that you have to foster a blame free culture, or even better a just culture. James Reason, a former Professor of Psychology at the University of Manchester, popularised the concept of a just culture (in my view stronger than a blame free culture as ‘blame free’ carries the inference that nobody is accountable). A just culture is one where an atmosphere of trust exists and people are encouraged and even rewarded for providing essential safety related information. This need not be limited to safety concerns, in my view. Inadvertent errors that people make due to poor system design (> 90% of all mistakes) must not be used to blame or reprimand people. Such errors should be exploited as a way of improving your organisation’s systems. However, errors that are caused by negligence, recklessness and intentional policy breaches must never be tolerated. A just culture ultimately results in problems not being masked as they might have been in the past due to fear of reprisal or humiliation. Problems are best viewed as gaps in your current knowledge about your processes and as opportunities for evolution. This demands that you view problems impersonally and that the focus is on the concern not the person or team. In my experience the irony of a problem receptive culture is that more problems will be surfaced and dissolved in comparison with a culture that strives to keep quiet about problems at all costs.
Why A3?
- It builds alignment as to what the real problem actually is and the path to resolution.
- It builds consensus to make changes all the way across the organisation.
- It develops problem-solving capability at all levels.
- It exposes lack of agreement (through consensus building) that can undercut progress.
A3 document
The structure of the A3 document is detailed in Table 5.1. The intent is to work through each section in sequence and these can then be updated throughout the problem-solving process as your knowledge of the problem deepens through analysis and tests of change. The A3 should be assigned an owner who is responsible for implementation and a mentor to guide the owner through the phases in a way that raises their skills. This practice uses the process both to improve the process and to develop your people.
Table 5.1 A3 document template
The seven basic quality tools
The Japanese quality authority Ishikawa was heavily influenced by Dr Deming, the American statistician, professor, author, lecturer and consultant, who was heavily involved in the transformation of the Japanese manufacturing industry in the mid-1900s. Ishikawa formalised seven basic quality tools that Deming argued could solve over 90% of quality problems. These are used throughout the A3 problem-solving process, some as diagnostic tools, in the analysis step and include the cause and effect diagram, Pareto chart and process map. Others are deployed as hold the gains/sustaining tools, for example using a run chart to monitor data over time and to detect if the process drifts beyond the specified stability limits.
The seven tools are:
- cause and effect diagram
- Pareto diagram
- process map
- tally chart
- scatter plot
- run chart
- histogram.
1. Cause and effect or fishbone diagram
This is a visual team tool used to brainstorm possible root causes to a problem with your employees. The potential causes are written in the diagram. It is common to use the six ‘Ms’ to label the initial bones: Man (person), Machine, Methods, Materials, Measurement and Mother Nature. The contributing causes are tested to see if they are root cause(s) through the repeated asking of ‘Why?’. This tool is known as ‘5 Why?’ as five is generally accepted as the number of times we need to ask ‘Why?’. (Not always the case in practical use however!)
Example problem statement:
Customer orders are consistently delivered late.
Why?
The press machine frequently breaks down. (Identified contributing cause under Machine section)
Why?
The ram seizes and trips out a fuse.
Why?
The ram wasn’t adequately lubricated.
Why?
The lubrication pump was clogged up.
Why?
The dispenser on the pump was broken.
Why?
Grime and grit entered the pump shaft.
Why?
The pump motor was designed without a filter. (Deep root cause)
You can have as many levels of ‘Why?’ as the situation demands. Continue asking ‘Why?’ even when you think that you have revealed the root problem. To test the last core root cause, work your way back up the ‘Why?’ ladder asking ‘therefore’ to verify if each ‘Why?’ holds true. In practice, each ‘Why?’ can often lead to several branches. You may for that reason have to prioritise, go down one branch, and then return to the branching point to explore other possibilities. One caveat to be aware of with ‘5 Why?’ is that different people solving the same problems can derive different root causes, so it is sensible to use a number of tools to complement and reinforce each other. An example would be to use a cause and effect diagram (see Figure 5.1), prioritise the primary potential causes, and then use ‘5 Why?’ to investigate if these causes are symptoms or root cause(s). You would finally run a small test of the change using PDSA to ground your theory into facts.
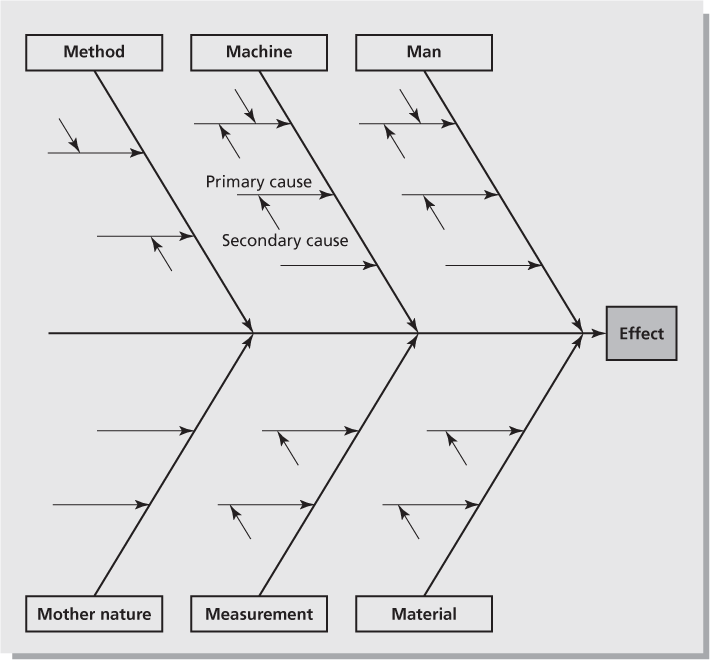
Figure 5.1 Cause and effect or fishbone diagram template
2. Pareto diagram or 80/20 rule
This principle is named after Alfredo Pareto, an economist who noted that a few people controlled most of a nation’s wealth. It is viewed by many as the single most powerful management technique of all time. It gives recognition to the fact that a small number of problems (< 20%) account for a large percentage (> 80%) of the effect of the overall number of problems. That is, the vital few cause you 80% of the pain! You should aim to solve these first before the trivial many. A principle worth remembering is that this rule also applies within the top 20% bracket – 20% of the top 20% has 80% of the impact! An example Pareto diagram is shown in Figure 5.2.
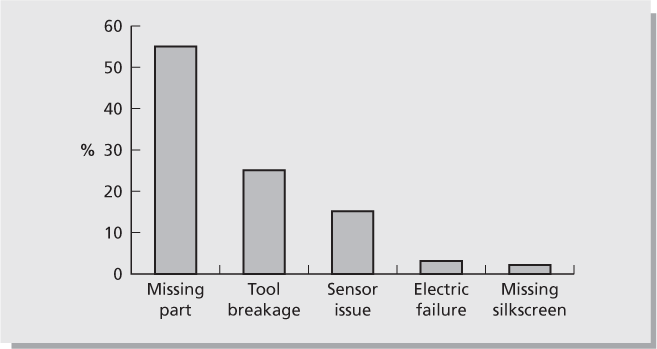
Figure 5.2 Pareto diagram of defect categories
3. Process map
The process map (see Figure 5.3) lists every step that is involved in the manufacture of a product or a service delivery. It helps to identify value and waste. It is also powerful for standardising processes after problem-solving activity has led to improvements in the original ‘as is’ process map. The mapping should be done at the actual workplace of the process under study, not remotely or relying on people’s perception of how they think the process works. Once the map is complete the individual steps can be brainstormed into those that add value, those that are pure waste and should be eliminated as soon as possible, and those which are necessary but non-value-added (they are needed to support the process in the short term). Each step is challenged using the criteria discussed previously:
Value-adding task
An activity is ‘value-added’ if, and only if, all these three conditions are met:
- The customer must be willing to pay for the activity.
- The step must either physically move the product or service towards completion, or be an essential precondition for another step.
- The step must be done right the first time.
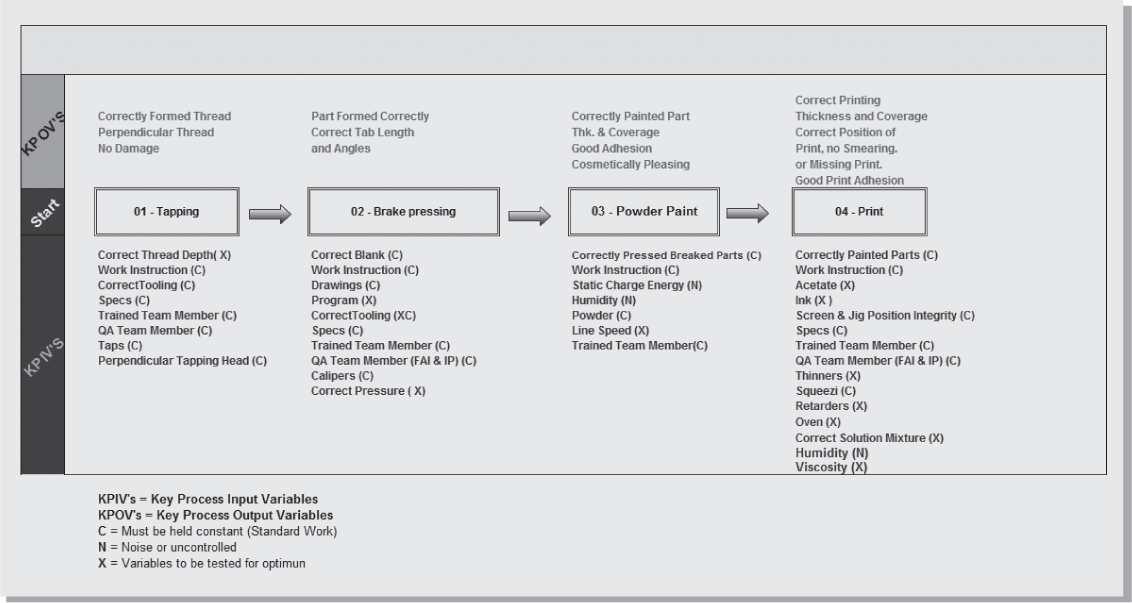
Figure 5.3 Process map example
Non-value-adding task
An activity that is neither required by the business nor one the customer is willing to pay for. These activities fall into the TIM WOOD DOES IT (see Chapter 1) categories of operational waste.
Value-added enabling task
An activity that is required to operate the business but one the customer is unwilling to pay for (e.g. inspection, regulation, budget tracking).
4. Tally chart
How often are certain events happening in your organisation? Tally charts (see Table 5.2) turn opinions into facts. Simple but powerful, you can place them next to your processes and use them to check the occurrence of issues. They are useful for identifying trends or signals such as a particular day of the week, shift, etc.
Table 5.2 Tally chart
| Defect category | Tally | Total |
| Missing part | IIIIIIIIIIIIIIIIIII | 19 |
| Tool breakage | IIIIIIIIIIII | 12 |
| Sensor issue | IIIIII | 6 |
| Electric failure | II | 2 |
| Missing silkscreen | I | 1 |
5. Scatter plot or measles chart
Each defect occurrence is plotted on an existing defective part or engineering drawing at the location where the problem occurs (see Figure 5.4). If the accumulation density is concentrated in one area it gives an excellent indication of where the problem lies. Some companies use this method to identify which areas in the organisation are generating the most ideas for improvement.
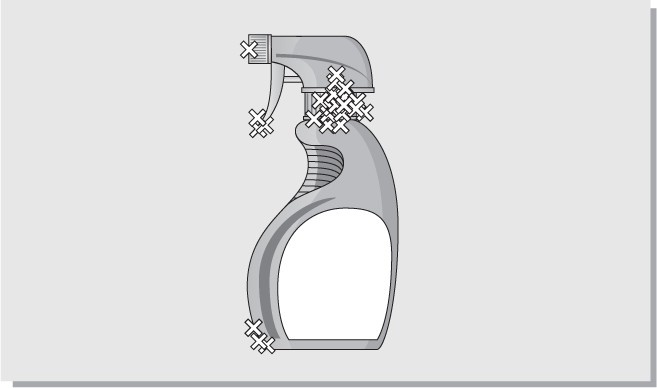
Figure 5.4 Scatter diagram signalling a strong defect problem area
6. Run chart
A run chart (see Figure 5.5) is a simple visual representation that displays data in the sequence that it occurs and shows a process’s characteristics over time. For example, a run chart in a café could plot the number of customers served against the time of day or day of the week. The data might illustrate more customers arrive at 1 p.m. than at 5 p.m. and even more during the weekend than on weekdays. This might lead to improvements in the staffing levels at particularly busy times to improve the customer experience.

Figure 5.5 Run chart
It is very important to capture the performance of a process over time and under a wide range of conditions. This helps us to make informed decisions regarding the condition of the process with respect to common and special cause variation. Common cause variation is deviation caused by unknown factors but the process still remains stable. In the café example this might be a slight variation between the number of people who sit for lunch on a Tuesday or Wednesday. An example of a special cause variation might be that there is a football final in the town and the café is booked out from 3 p.m. to 7 p.m. that evening. The cause and effect diagram discussed earlier is often used for investigating special cause variation.
7. Histogram
A histogram (see Figure 5.6) represents the frequency and distribution of data. It allows large data sets to be graphically displayed in a concise chart where trends and outliers can be quickly spotted. Generally the more bell shaped the graph contour is, the more stable and in control the process is.
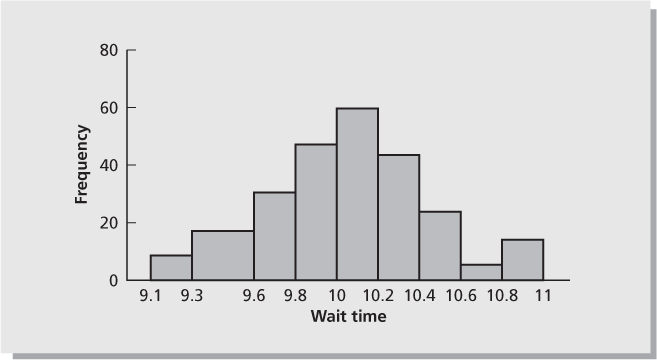
Figure 5.6 Histogram
Four ways of using A3s
- Problem solving: a problem-solving A3 is used for structured systematic root cause problem solving (see Table 5.1 earlier).
- Proposal: a proposal A3 is focused on the future, expressing where and how you want to improve the situation in a particular area (see Table 5.3).
- Status report: a status A3 communicates the progress of a medium- to long-term project (see Table 5.4).
- Strategic: a strategic A3 develops the path to the achievement of a hoshin breakthrough goal (see Figure 2.1).
Table 5.3 Proposal A3 outline
| Proposal: | Date: To | From |
| Theme: | Plan: | |
| Proposal detail: | What How Who When | |
| Open issues: |
Table 5.4 Status A3 outline
| Status report: | Date: To | From |
| Theme: | Implementation Status: | |
| Background: | Total Effect: | |
| Objectives: | Open Issues/Next Actions: |
Categories of problems
It is useful to classify problems into four categories, namely A, B, C and D problems.
‘A’ problems
The cause is known. Countermeasures can be implemented immediately using PDSA cycle(s).
Team members can usually solve these problems directly; these problems are often related to non-conformance to standard work or no standard work. Standard work is one of the primary methods used in Lean to make problems visible. About 60–70% of problems encountered in your organisations in all probability fall into this category. These problems do not require the level of analysis provided by A3. Instead these problems can be tracked using a 3C board as in Table 5.5. This visual management board is a good method for sharing concerns and successful solutions within your local areas and with other value streams.
Table 5.5 A 3C board
| Concern | Cause | Countermeasure |
| 1. | ||
| 2. | ||
| 3. |
‘B’ problems
The root cause(s) are known, countermeasures are not known.
These problems are normally solved using the A3 methodology. They can be a re-occurrence of an ‘A’ problem when the incorrect cause(s) had been countermeasured. The frontline supervisor often mentors their team members during the process. In parallel with this comes the progression of your team members’ problem-solving capability. Developing the correct thinking through PDSA is integral to the process along with deeper knowledge of the process under analysis. Approximately 20% of problems encountered in an organisation are ‘B’ problems.
‘C’ problems
Cause is unknown.
These problems also require an A3 and deeper analysis using the basic quality tools such as cause and effect diagrams and ‘5 Why?’ analysis to arrive at a proposed set of countermeasures to be tested. Approximately 10% of problems encountered in an organisation are ‘C’ problems.
‘D’ problems
This is intentionally creating a problem through removal of precaution contingencies – the proactive creation of problems to stress the system. An example of this would be the lowering of an inventory buffer between workstations in order to reveal problems (that would otherwise be concealed by the comfort of extra inventory) due to small machine stops, etc. Tightly linked processes without excess cushions, be that extra inventory, time, people, etc., force you to tackle the source of disruptions rather than mask the causes by adding extra resources.
A3 problem-solving review
A3 is a powerful method for solving problems and communicating within the organisation. Due to its concise and standard format it obliges everyone in your organisation to think about and view the problem or project with an aligned approach. It pushes people to go to the actual workplace and interact directly with frontline employees. The process also subtly develops people’s ‘hard’ and ‘soft’ skills. The ‘hard’ skills are developed through problem definition formulation and root cause analysis. The softer people skills are nurtured through the process of dialogue and building persuasion and consensus with the various stakeholders. Alignment is built through the coaching process of Socratic questioning (open ended questions of what, why, when, where and how). This questioning approach rather than telling (reduces accountability) develops the other stakeholders through allowing them to learn through experimentation rather than directives. (This is developed further in Chapter 10 through deployment of the Cathedral model.) The process of problem solving is used not just to solve problems, but also to create leaders in Lean organisations. Over time A3 has the power to change the cognitive thinking of people, as this structured approach evolves into a habitual way of applying shared thinking to problems.
SECTION 2: STANDARD WORK
Introduction
‘Today’s standardisation…is the necessary foundation on which tomorrow’s improvement will be based. If you think of “standardisation” as the best you know today, but which is to be improved tomorrow – you get somewhere. But if you think of standards as confining, then progress stops.’
Henry Ford1
Stability is the foundation of Lean, and in order to create stability it is necessary to describe, document and teach standard work to employees. Standard work is the current best known documented way to safely, effectively (satisfies customers’ needs) and efficiently (least wasteful way) carry out a job. It also needs to meet the required level of quality in the allotted time. The very act of documenting the work highlights obvious improvements. You should view standard work as a continuous improvement method that removes operational waste and allows supervisors to audit their processes (deviations from being able to follow the standard raises problems). Without standards there is no baseline for performance comparison. Standards are most effective and bought into when developed in collaboration with your people doing the everyday work. Standard work improves process discipline, which is the heart of Lean transformation.
Standard work supports the True North aspirations of quality, cost, delivery and people growth (we discuss True North in Chapter 1). Quality is improved through the removal of variation and more consistent delivery of customer requirements. Performing work steps by the same method each time improves quality across all industries. When a problem does occur, comparing the standard work method to what is currently happening in the process can quickly identify the root cause(s). Hence standardisation enables non-conformances or quality issues to be highlighted immediately. The root cause of practically all problems in your organisation – as stated previously – can be traced back to three broad categories:
- There was no standard work for the task.
- There was standard work for the task but it was not followed.
- There was standard work for the task, it was followed, but the standard was inadequate.
Cost is enhanced through the removal of waste and defining the current best known method that most effectively meets your customer requirements. Standard work supports delivery through the specification of the current best-known work sequence, standard work in progress and takt time (see Chapter 3). Takt time paces and staffs the value streams in synchronisation with customer demand. This means that all processes are paced at the rate that your product and services are being sold. Standards help define the theoretically correct number of people required to staff the organisation to meet customer demand. People growth is also cultivated with standardisation through the acknowledgement that standards are just the current temporary best known method that we recognise today. The expectation is that people should challenge all standards on a continuous basis in order to improve upon them. You should strive to have a robust change management process in place that allows making changes to standards to be as seamless as possible.
Standard work is often frowned upon as it raises the idea that the workplace will become regimented and stifles creativity as people will be expected to mindlessly conform to policies and rules. The opposite should be true in a Lean organisation. Standard work should not be top down. Standards should never be set in stone, instead they should be developed in collaboration with those doing the work. People will generally follow standard work when they are involved in developing it (they then identify with it and ownership is fostered). Standard work does in fact free up time for improvement and creativity. This is because in a stable environment people spend less time fire-fighting. If work is deferred to individual choices there is no consistency in outcomes. When properly applied (visible and reviewed frequently) standard work will help sustain and lock in improvements and also expose concealed waste in your workplace.
As Figure 5.7 shows, standard work is a reflection of the current best known method. The target condition or desired state must be defined. This is the magnet that is pulling people to improve the current condition and to reduce the difference that exists between the two states. The target condition is a powerful waste removal concept. The difference is closed through repeated turns of the PDSA wheel in the form of tests of change. These changes should be reflected in each new version of standard work and can be viewed as the means that prevents backsliding against the force of entropy.
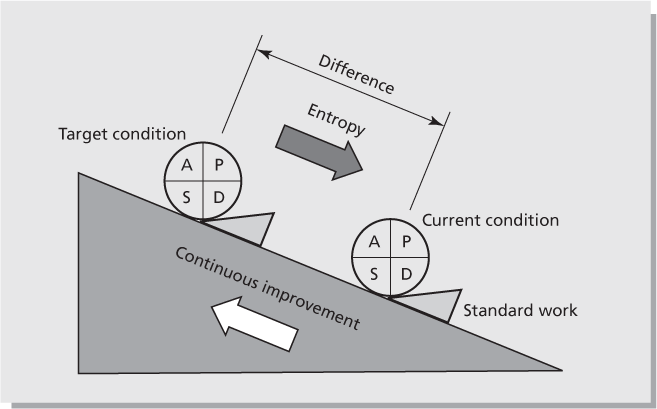
Figure 5.7 The target condition creates a pull for improvement
‘Continue the cycle, over and over, with never-ending improvement of quality, at lower and lower cost.’
W. Edwards Deming2
There is no end game or 100% stable process; problems are inherent in every system. How will you know if you are reaching the target that you set? A clue might be that you are seeing only common cause variation over a number of months. In other words the process has reached stability, and you are in the position to ‘challenge’ this capability by setting an even higher standard of operation.
Standard work and job classifications
Charles Perrow3 classified jobs into four categories:
- Routine work: these are highly repetitive jobs such as assembly line tasks or transactional office work, for example, processing application forms. These tasks are prime targets for standard work. However, the expectation is that the employees are on the look out for shortcomings in these standards and will come forward with ideas that they can contribute towards improving
the work. - Technician work: there is a wide variety of tasks and the order can change depending upon the situation. An example of technician work would be a person overseeing the operation of a complex automated machine, or a person running an MRI scanner in a hospital. Their activities can be supported by standard work for repetitive daily tasks such as productive maintenance, or reference procedures for equipment settings.
- Craft work: there are an almost infinite number of different tasks involved in this job classification. Expertise and practice are significant factors for the attainment of high levels of competency. There are very high levels of autonomy in this job style, but standard work is deployed in a limited fashion so as to aid fundamental skills such as problem solving, safety policies, quality acceptance levels and the workplace layout.
- Non-routine : this type of work is concerned with one-off type projects where decisions must often be made without prior knowledge. The engineer performing research and development would be classified in this category. Formal standard work is implemented sparingly such as the sharing of best practice, following good design protocol and adhering to specifications. The emphasis is more on proficient training and extensive experience under the guidance of a mentor.
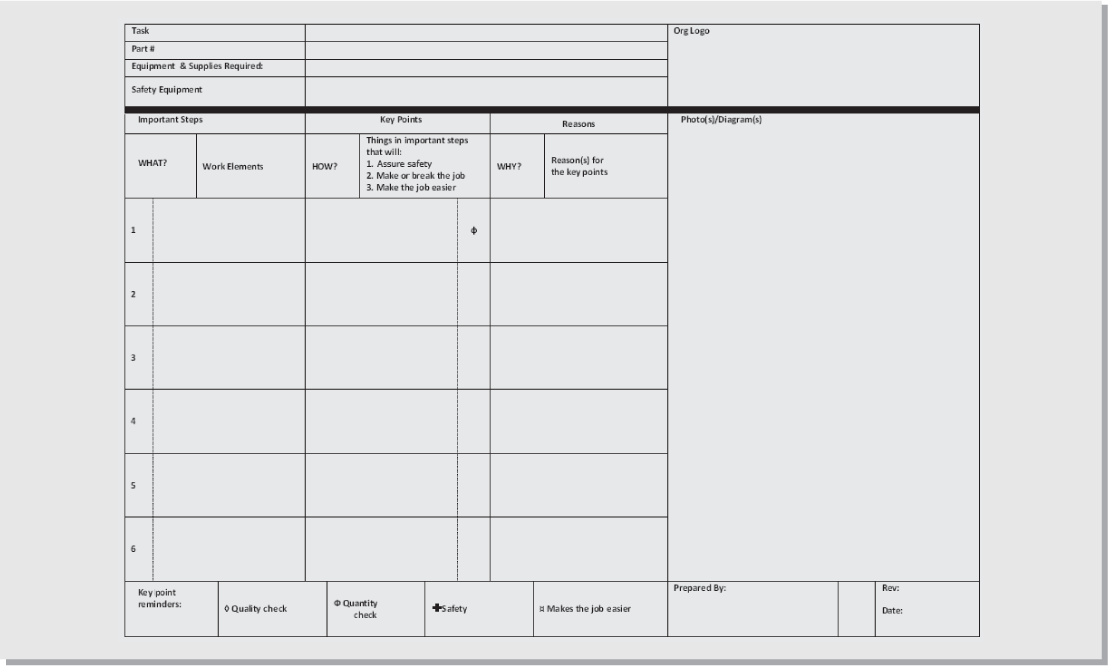
The standard work chart (see Figure 5.8) makes the job content explicit and is usually but not always combined into one A3 page. Its primary purpose is to ensure that the defined standard is followed; this is accomplished through daily support from the area supervisor. Takt time and cycle time are derived through direct observation of the work over a wide range of users and market conditions over time. Cycle time divided by takt time gives a feel for the theoretical number of staff needed in a process area. This puts a science behind the correct levels of staffing required for an area which is often very loosely calculated or based on people’s perceptive judgements. If demand changes significantly, takt time will also change and this should trigger changes to standard work. The capacity of the process must be understood in order to develop effective standards as this will determine factors such as staffing, cycle times and indeed takt time itself. The work elements detail the what, how and why of the job. The ‘why’ or purpose of the process should also be made explicit in order that people understand the benefits of their job to the end user. In general, employees will resist what they do not understand, and are unlikely to comply if they do not see mutual benefit (or the why) in doing so. Key points are detailed (in a participative manner between the area supervisors and the frontline people running the process) for work elements that make the job safer, easier or are of critical importance. Failure to perform the key points successfully can lead to safety concerns, make the job harder for employees and/or can make or break the job’s desired outcome.
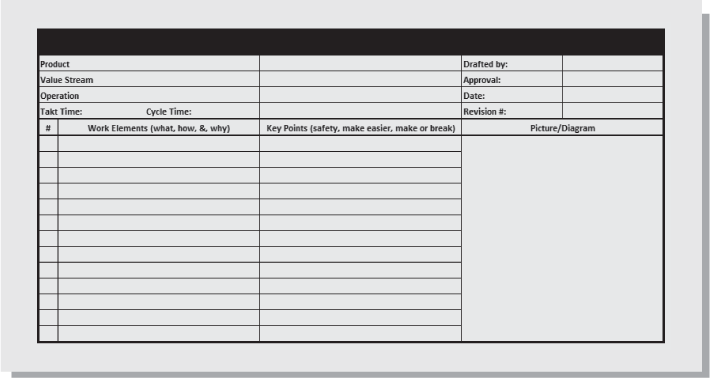
Figure 5.8 Standard work chart example layout
When you are implementing standard work practices, remember that key points should be stated in a positive manner. For example, avoid stating, ‘Do not use too much wrapping’; instead be specific and say, ‘Use 350 mm of 3 micron polyethylene wrapping’. Of course, not all work elements require key points. Often the description is complemented with photos, sketches or diagrams to enhance clarity or to place emphasis on critical quality checks. A better understanding of the purpose of standard work will help to determine the appropriate level of detail. Standards are sometimes populated in pencil to ease the bureaucracy of change control and the supervisor stamps and initials changes to provide a safety net against uncontrolled changes.
Improving standard work
In order to focus on the current version of standard work you will need to study the process in detail. The way to do this is by using a form called a standard work combination chart; this will remove waste in each of the TIM WOOD DOES IT categories. A sample chart is shown in Figure 5.9. This chart will help you consider the micro details of processes and factor in all the minute details that can have serious consequences if they escalate. It is very useful to combine this chart with a video analysis of the process so that you can later play it back for detailed analysis. Show it to all the process stakeholders so that you can examine the details in an unbiased manner. The renowned parable below reminds us of the importance of attention to detail:
‘For the want of a nail the shoe was lost; For the want of a shoe the horse was lost; For the want of a horse the battle was lost; For the failure of battle the kingdom was lost; And all for the want of a horseshoe nail.’4
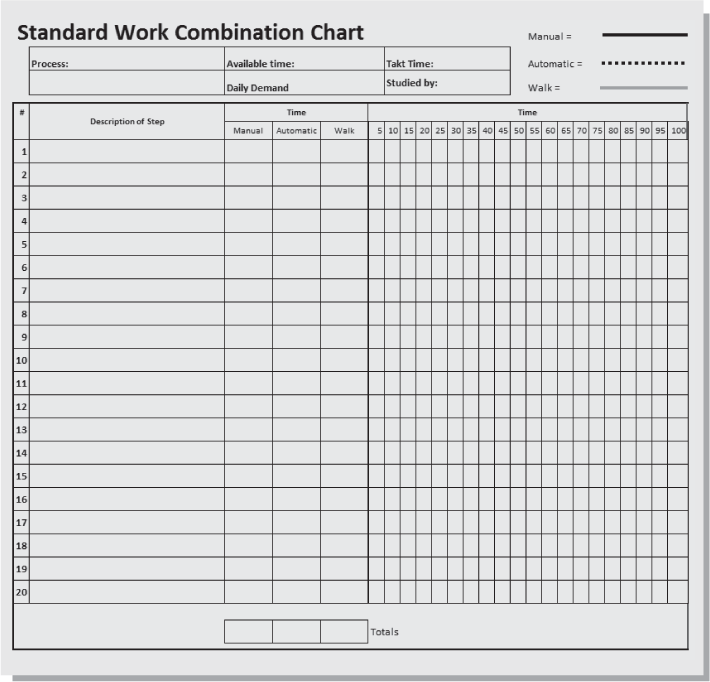
From Figure 5.9 and the expected level of detailed analysis, you will see that standard work is much more than documenting the work, it is a vigorous waste reduction practice. Once standard work has been created and everyone is trained, it is time to start the process and make observations. This is the time to look for yet further improvements.
Bringing standard work to life
When the process has been documented your work is not complete! Once you have knowledge of work practices you then need to transfer this to the people doing the work. It is necessary to obtain a structure that will transfer the information in the standards to the people performing the work. This is where the programme known as training within industry (TWI) is invaluable.
Employees often do not follow standard written procedures because they do not understand them, they are impossible to follow as written, they are incomplete and offer either insufficient or superfluous information, or a different method is known that will increase quality, productivity, safety or cost. In short, they need to be trained on the what, how and why a job must be performed in a particular way.
TWI is a four-stage programme for training employees. It involves:
- how to do the task – called job instruction (JI)
- how to continually look for ways to improve the task – called job methods (JM)
- guidance on treating and managing people with respect, as detailed in the job relations programme (JR)
- job safety (JS) so that the effectiveness of both the JI and JM programmes is maximised (this relates to the ‘respect for people’ pillar).
Job instruction is used to impart the knowledge in standard work to employees. It should be done directly by the supervisor who in turn should be wholly proficient in performing the task. The job is broken down in a job breakdown sheet where the specific what, how and why of the job are outlined (see Figure 5.10 below). A job breakdown sheet is user friendly and has more specific job details than standard work charts (which are used primarily for auditing by the supervisor).
The supervisor works through the four steps on page 109 to explain the job standard. These four JI steps are commonly carried by supervisors in credit card sized memos that serve as a visual cue for correct application. This time tested method is extremely effective for training in all types of industries from manufacturing to software development and beyond. Its origins date back to World War II when over 1.6 million personnel were trained through TWI to support the manufacture of war equipment. TWI is arguably the most proven and effective training programme in existence today.
Job Instruction Method5
Step 1: Prepare the student
- Put the student at ease.
- State the job name.
- Find out what the student already knows about the job.
- Get the student interested in learning the job.
Step 2: Present the operation
- Teacher demonstrates one major step at a time as the student observes.
- Teacher demonstrates again as the student observes each major step and key point.
- Teacher demonstrates again as student observes each major step, key point and reasons for the step.
- Explain clearly, completely and patiently.
- Present no more than the worker can master.
Step 3: Try out performance
- Have the student try the job while you correct mistakes.
- Student explains the major step as the job is done again.
- Student explains the key points as the job is done again.
- Student explains the reasons as the job is done again.
Step 4: Follow up
- Assign the person a task.
- Tell the student where to go for help.
- Check their progress frequently.
- Encourage them to ask questions.
- Gradually reduce the coaching follow-up.
Standard work review
Standard work ensures reliable, capable and repeatable work outcomes. Standard work is perhaps the hardest work of Lean but one of the most critical elements. It can also be the least engaging work in Lean as it requires meticulous attention to detail. You probably even found reading this chapter arduous and tough going! We work in organisational cultures where heroic fire-fighting is generally rewarded over preventing problems. As mentioned previously, the major cause of almost all your work problems can be traced back to deficiencies in standard work. We are time and again rewarded for workarounds rather than preventing problems. However, we have to live with the consequences of not following standard work and the subsequent fire-fighting and losses that ensue. Hence it seems obvious that it should never be optional to perform work in the correct way through standard work. The wisdom that the right process will yield the right results is very true.
We all have experienced the benefits of standard work in our daily lives from, say, our consistent customer experience whilst visiting Starbucks to the pilot’s standard safety checks before departing for take-off at the airport. Even highly variable work can benefit from a degree of standardisation, for example in a stressful service recovery situation, loose scripting can help ensure that all the customer sensitive touch points are covered. Even creative work (yes, creativity is a process too!) can have elements standardised such as the various phases of the creative process, knowledge management portals and references to required information. Standard work is not a set up and forget exercise: it needs to be observed, audited and nurtured by your local area supervisors.
Note: non-value-added failure demand work placed on your organisation should not be a target for standard work; the goal is to eliminate this category of work.
Standard work also greatly reduces the learning curve to job proficiency. (In my experience proficiency levels are reached in half the time in cultures that have embedded standardisation into the daily work routines.) Thus the possibility of job rotation and flexibility is greatly enhanced.
Standards can never cover everything that can happen and good standards should factor in criteria to handle variation in local conditions. Standards should however look after the estimated vital 20–30% or so of tasks that should be consistently delivered across all industries. As J.W. Marriott, CEO of Marriot Hotels, stated:
‘What solid systems and SOPs [standards are often called standard operating procedures in service industries] do is nip common problems in the bud so that staff can focus on uncommon problems that come their way.’6