Hoshin kanri strategy deployment
Introduction
‘If you always do what you've always done, you'll always get what you've always got.’
Einstein
Hoshin drives the tempo of improvement during your Lean transformation. It puts operational improvement on the same stage as making the numbers or doing the normal day-to-day routine work. In my view it can be the potent advantage that sets your organisation ahead of the competition.
Hoshin kanri is often formally conducted after Lean has been piloted for a short period in an organisation. The reason for this is to prove the concept of Lean first and to build confidence through a demonstrated success story.
The Japanese term hoshin means compass, or pointing direction, kanri means management or control.1 Hoshin kanri is a systematic method of expressing the strategic aims for the next 3–5 year time horizon and to lock in the critical few breakthroughs that the organisation will pursue for the forthcoming year. A breakthrough is defined as an objective that will close the gap between True North and our current reality. Accountability is assigned and execution is monitored on a periodic basis. At a high level, hoshin is a large application of the PDSA cycle introduced in Chapter 1, and multiple PDSA cycles are effected to develop and implement the individual objectives. PDSA ensures that we have solid but flexible plans in place that are executed and that their effectiveness is confirmed.
Hoshin cascades top management intentions throughout the organisation into actionable deliverables at each level. Hence actions at all levels are aligned towards delivering the strategic aims. Without hoshin each department could be working on its own processes in a piecemeal fashion. This lack of joined up thinking often makes overall performance worse, despite people’s best intended efforts.
The hoshin kanri process
Members of the senior leadership team come together over a number of workshops (the number is dependent on the size and Lean maturity of the organisation) to work through the following steps:
- Reflection on the previous year’s performance
- Review of the organisation’s vision, mission and values
- Objectives for the forthcoming year
- Alignment building and action plans
- X-matrix development
- Implementation
- Monthly evaluation
- Annual evaluation.
1. Reflection on the previous year’s performance
Reflection is a common practice in Lean organisations. It means to analyse past performance to look specifically at:
This process looks at what we achieved last year against what we set out to do. It’s very important to understand what is already working and to do more of what works. Reflection is also consistent with the ‘continuous improvement’ pillar of Lean; we are constantly looking at better ways of performing and learning in a constructive way from past problems. It is surprisingly uncommon for organisations to review past performance in this way, especially if things are deemed to be going acceptably well. Lean organisations foster a healthy attitude of constructive discontent.
2. Review of the organisation’s mission, vision and values
Mission, vision and values should assimilate the True North ideals of Lean in terms of people growth, quality, delivery and cost.
The mission statement describes the purpose (Lean principle 1) of an organisation: what it does and for whom and why.
The vision describes the organisation’s ideal future (think True North!). For example, it is good practice for you to conduct a review session of both the mission and vision and ask questions such as:
- Is it articulated?
- Is it still relevant to our business today and into the future?
- Are people at all levels in the organisation able to tell a visitor what our vision is?
- Does it inspire action?
Values help to guide daily behaviour, which in turn helps to shape the culture of your organisation, which ultimately determines habits and hence performance. The list of values below can be used to contrast against your current values if the latter are already specified. If not the list can be used as a trigger to see which values speak to the organisation’s preferred ideals. It is common to have between five and seven core values and these are then crafted into the organisation’s personal context (see ‘Behavioural Standards’ in Chapter 10) to make them real.
Examples of core values
respect, continuous improvement, drive, competency, fairness, integrity, service, responsibility, perseverance, diversity , fun, loyalty, creativity, teamwork, excellence, accountability, self-reliance, quality, collaboration, empathy, courage, challenge, learning, kindness, discipline, generosity, optimism, dependability, flexibility, pride, camaraderie, humility
Taken as a group the mission, vision and values unite an organisation to follow a common, refined path. Hence they greatly enable the hoshin alignment process.
3. Objectives for the forthcoming year
The Lean assessment (see the appendix) and value stream mapping should be done just before hoshin by senior management with frontline personnel and a Lean coach (either an externally appointed Lean expert or an internal expert). The assessment and mapping workshops provide essential input to the process of framing objectives. Value stream mapping is discussed in Chapter 3.
The process of deciding the breakthrough objectives depends on an intensive period of gathering data and facts. In my view it is helpful if this work is completed prior to the teams meeting as a group and should include numerous hours understanding reality at the gemba. (The gemba is a Japanese term that means to go to the actual place where the work is being performed and to observe the process deeply with your own eyes.) The selection of your breakthrough objectives can come from the collective business knowledge both inside and outside the meeting.
Utilisation of more formal tools such as the classic SWOT (strengths, weaknesses, opportunities and threats) matrix,2 for example, can also be deployed. Another method often used at this stage is a strategy map.3 This is a form of environmental scanning and assesses internal factors (e.g. financials, productivity and growth strategies, customer offerings and branding, employee learning and development, and innovation processes) as well as external competitor offerings in the marketplace. To identify breakthroughs, organisations should have a deep understanding of what their customers truly value (see Figure 13.2, the Kano model).
The use of ‘what-if’ can also be deployed to mould breakthrough objectives. For example: what if it is three to five years in the future. We are incredibly thriving. What does this look like, and what breakthroughs got us here?
It is common for a greater number of breakthroughs to be proposed than the ‘vital few’ that can be realistically resourced. You need to prioritise based on benefit–effort ratings and/or other business needs. It is important to ensure that a balanced approach to the breakthrough objectives is taken. That is, there should be at least one breakthrough from all four areas of True North, namely people growth, quality, delivery and cost. Improving any one in isolation will eventually limit the systemic improvements that are possible. Some items that you deem to be important (but at a lower level than the hoshin objectives) can be delegated to the normal, routine, daily management process to be progressed. A ‘discontinue doing’ list is also helpful at this stage to park existing low-priority projects and make time for more value-added breakthroughs. Critical projects in progress but not yet complete from last year can also make up a breakthrough objective.
4. Alignment building and action plans
The process of building alignment and consensus throughout the organisation is known as catchball. This quite literally means passing the ball up and down, back and forth, and across the organisational silos. Consensus does not mean that everyone agrees: it does mean however that everyone has had input into the process and their voice is heard and truly listened to.
Consensus building is the big differentiator from traditional command and control strategy development. This is where all stakeholders have the opportunity to enrich the plans that are being developed in a collaborative manner. It also builds ownership. Management gets the opportunity to obtain reaction on their beliefs of current actuality. This is very much in keeping with the Lean gemba principle of going to the actual source of the action. Goals are made more area specific as they are cascaded throughout the organisation.
When the team finally decides on the vital few breakthroughs (to close the gap from current and future state) for the coming year, detailed plans are developed and further catchball takes place.
The extent to which catchball is played out depends on the maturity of Lean in the organisation and people’s capability with Lean and in the leadership of their teams. Organisations just embarking on their Lean journey would typically not use the concept of catchball directly on the frontlines. As problem solving skills grow and the credibility of Lean deepens (by actual results), catchball can be carried out throughout the organisation.
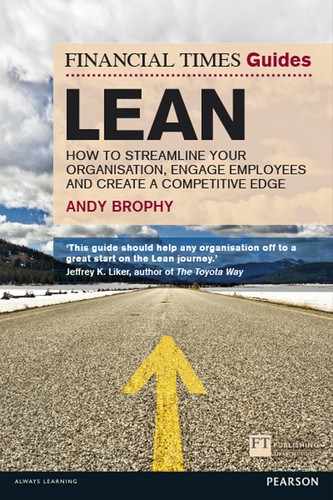
A detailed action plan (see Figure 2.1) is developed for each breakthrough. Activities are outlined that will deliver the objective. Timelines for delivery are planned and metrics to assess the progress of the line items are tracked. Colour coding facilitates the tracking process: for example, items that are planned but not yet begun are grey, items that are complete are green, items that are slipping are yellow, and items that were not done are red. Red items are assigned a ‘back to green’ plan.
Some individual activities that require more detailed planning may merit another lower level plan. These become known as a child plan and feed into the main or mother plan. Seasoned Lean veterans always take the time to plan well and recognise that a good plan is half the work done.
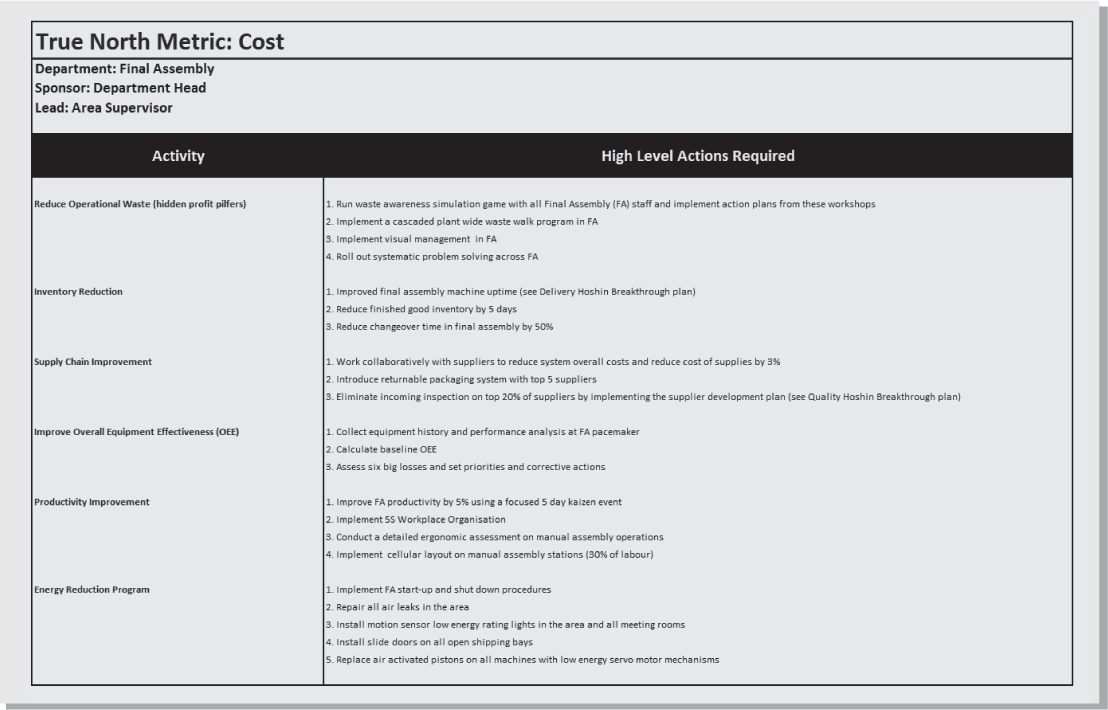
Bowling charts (see Figure 2.2) are used to track monthly progress against the planned gains. Each one of your breakthrough plans can use a bowling chart. They are reviewed monthly to drive accountability. The delicate point and great value of these charts is that they force us to slice the improvements down into smaller increments and to learn and adjust (PDSA) every month. They help us track the pathway to the next destination – the achievement of the breakthrough.
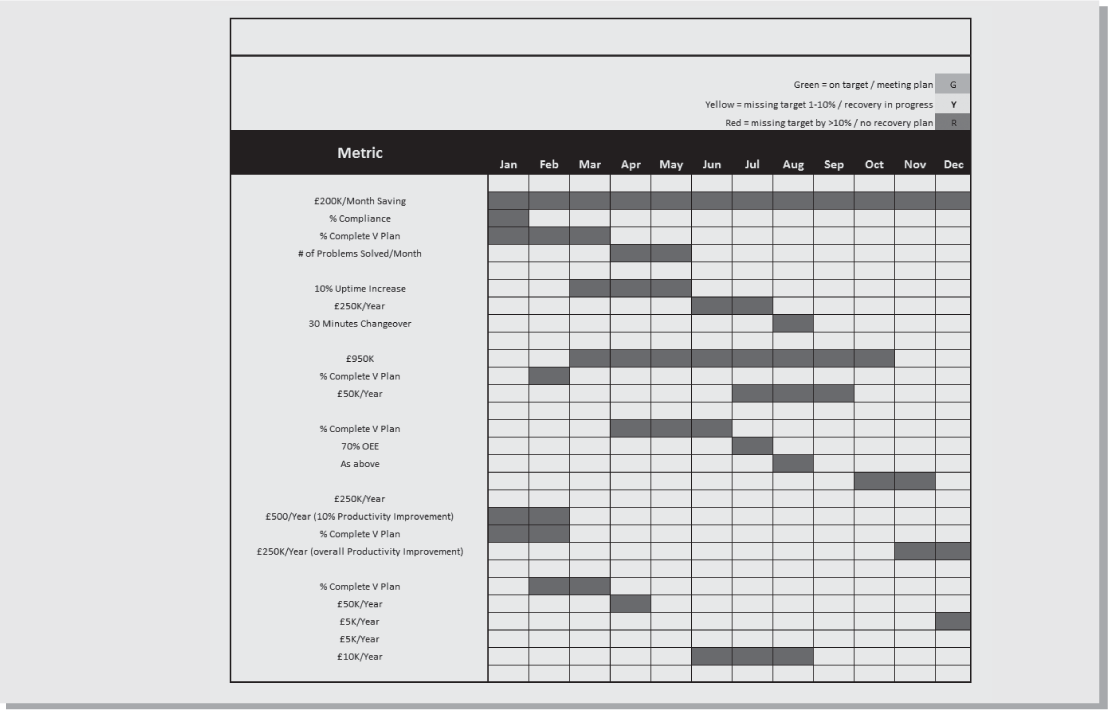
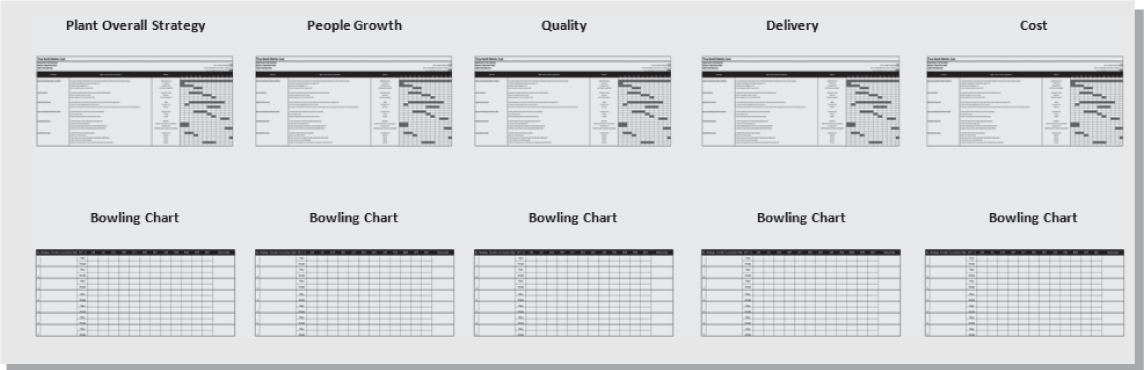
The plans are typically displayed in a visual management centre (VMC – see Figure 2.3). The VMC is an area where performance data is visually displayed and kept up to date. The purpose of the VMC is so that anyone in the workplace, even those who are unfamiliar with the detail of the processes, can rapidly see what is going on, and distinguish what is under control and what isn’t. The VMC craftily increases the level of accountability (through increased transparency) and urgency for delivering the plans. I often use a sporting analogy – ‘If we are not keeping score, we are just practising!’ – to diminish resistance to increased levels of performance transparency.
A word on metrics
Typically, most organisations track results oriented measures. Yet measures focused solely on results represent after the fact data: the horse has already bolted. Process metrics are also needed to measure and track the performance of a process, and provide real-time feedback that can be acted on swiftly. If we get the process right the results will always follow. Effective measurement systems should alloy a blend of both result and process measures (four times the number of process metrics in general).
A car’s dashboard provides a good analogy. The mileage clock tracks results – how far your car has travelled in a trip. However, without process metrics such as the fuel or oil gauge, we cannot be sure or predict that we will arrive at our destination. And so it is with organisations: we need to track both the results and the means that deliver those results.
A third type of metric encouraged by Associates in Process Improvement4 is called a balancing measure. This metric helps to prevent an improvement accomplished in some measures degrading performance in others. When making changes to results and process measures we need to ensure that any related measures are maintained or improved. This will help safeguard against any unintended consequences of your improvement activities.
5. X-matrix development
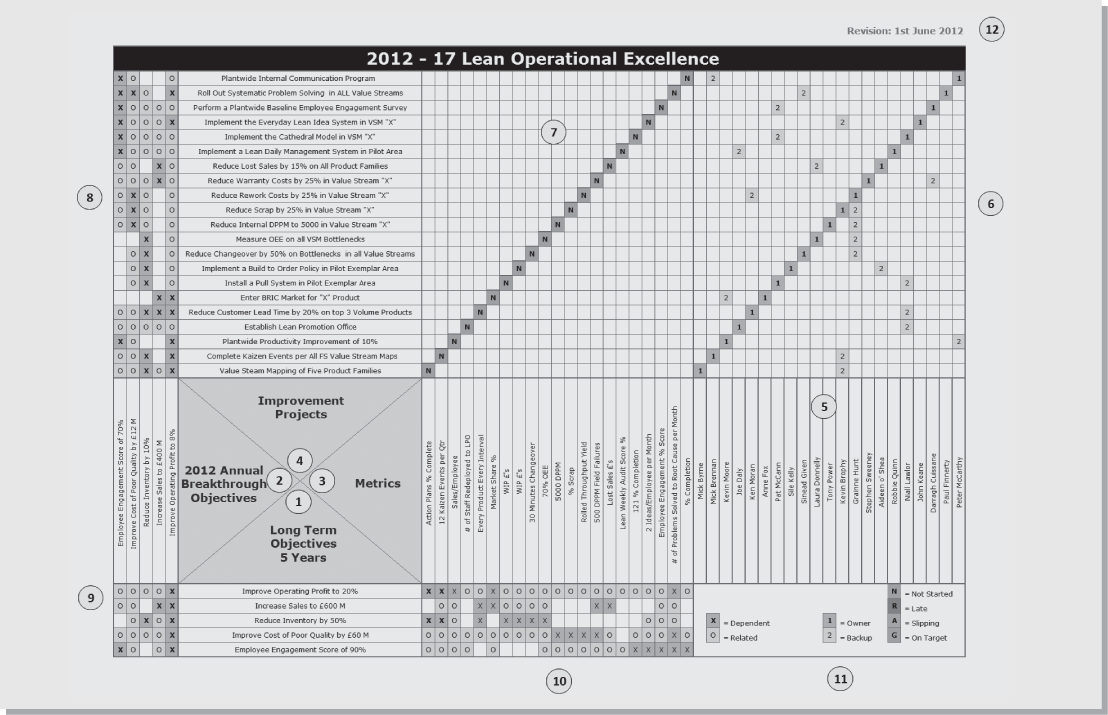
The X-matrix is based on the work of Ryuji Fukuda7, an authority on Japanese quality. It looks very complex at first glance, but it is actually quite straightforward in practice. It is a visual management template that merges the what, who and how much of the organisation’s strategy onto one A3 page. The matrix is a great dialogue and consensus builder in the formulation of strategy and is another form of catchball. Hence I recommend that you print the template and populate it in pencil initially; there should be lots of changes as consensus is built! The matrix is reviewed as a part of the hoshin monthly review meeting. The primary focus of this meeting is on exceptions (red items) and putting a plan in place to bring these back on track. (Note that managing ‘on green’ is discussed in Chapter 10.) New objectives and initiatives can be added as the business environment changes and learning increases. The example shown in Figure 2.4 is a top level or mother X-matrix. Lower level X-matrix templates can be deployed per level, if needed, to make the objectives more detailed and meaningful. The extent and level of this are dependent on the size of the organisation. The X-matrix enables everyone to appreciate how the long-term strategy, annual objectives, improvement projects and metrics are integrated together as a system (Lean principle 2).
Filling in the X-matrix
- You populate your organisation’s three to five year long-term strategy. A balanced scorecard approach should be applied to the critical few objectives, under cost, quality, delivery and people growth.
- The portion of this strategy that you aim to accomplish in the forthcoming year is added here with specific targets for each breakthrough.
- The metrics are formulated and added here, taking a blended approach to result, process and balancing measures.
- The improvement assignments are agreed that will deliver your organisation’s annual breakthroughs. There can be several projects undertaken per breakthrough.
- Accountability is determined for each assignment.
- This grid outlines the owners and back-up resource for the assignments. It is the responsibility of the owner to develop more detailed plans for each improvement project.
- The improvement projects are correlated to the metric, and the traffic light system is updated monthly to monitor progress against the detailed plans.
- The improvement projects are correlated against your annual objectives. They are assigned as being dependent on delivering the strategy or related to the strategy. Again this should involve a team-based conversation and catchball.
- The long-term strategy is also correlated to your annual objectives, as above.
- Correlation between the long-term strategy and the metrics is completed.
- Detail the X-matrix keys.
- The revision date for the X-matrix is recorded; this should be monthly or more often as required.
6. Implementation
Ultimately, it’s the rubber meets the road time! The breakthrough plans are rolled out throughout the organisation. Lean is learned primarily by doing, or more precisely through repeated PDSA cycles. However, people still need supplementary training and coaching on the Lean principles, tools and methods, and the leadership required for successful application. A detailed discussion of the Lean tools and methods appears in Chapters 4 to 9. Chapter 10 deals with the important keystone of Lean leadership and cultural enrichment.
The preferred approach to training is: learn – apply – reflect . The appropriate tools and methods needed for the particular breakthroughs are taught in a just-in-time manner. This new learning is then applied straightaway to the implementation of a particular breakthrough. The ‘reflect’ element means that we study the outcomes and learning and adjust our approach for the next cycle of improvements, if and when required. This process of learning prevents the classic waste of training that happens way in advance of being needed, if indeed it is ever used at all.
Improvement muscle is required at all levels of the organisation to deliver the breakthroughs. There will be pressure to do the day-to-day job and to deliver the hoshin breakthroughs. Lean productivity improvements will free up people, but the tendency to make thesepeople redundant must be resisted. This would violate the ‘respect for people’ pillar and kill off the likelihood of other areas making improvements. Another equally damaging impact of laying off freed up resources is that we cut the capability to release time for people to spend on improvement work. This stops the virtuous circle of Lean in its tracks. Why not use your freed up resources to create greater and greater gains, for ever, through everyday waste elimination? Note: this is another reason why you need to think about what you measure. If you (or your accountants) track labour utilisation in isolation, this may discourage taking time out for improvement as this metric will degrade. However, the increased capability of your people will actually increase efficiency in the longer term.
7. Monthly evaluation
The hoshin plans are reviewed on a monthly basis. The X-matrix and bowling charts are reviewed for exceptions (red and amber). Countermeasures are developed and rolled out to bring these back on track. The meeting is often closed with a reflection exercise. Finally, the lessons learned should be disseminated throughout the organisation.
8. Annual evaluation
The annual review is the assessment step that examines the year end results of hoshin in terms of:
- Were the breakthroughs achieved and if so are they sustainable?
- Were the action plans rolled out in an inclusive manner? Was catchball performed?
- How did the monthly review process go?
- Were the metrics adequate? What was not captured?
- Can the achieved breakthroughs be managed in future by the normal daily management process and KPIs (key performance indicators)?
- Did the hoshin process develop engaged Lean leaders at all levels?
- What Lean principles and methods were learned during the year and by whom?
- Were people overburdened with the workload?
- What can we do better for the next cycle of hoshin deployment?
A person of influential authority in the organisation should have ownership and accountability for the overall hoshin process. They are responsible for the entire rollout of the hoshin process (but not delivery of the individual breakthroughs, this is the responsibility of the local area managers) and synthesis of the documentation.
Review
There are countless examples of organisations that have jumped on the Lean ‘bandwagon’ and attempted to deploy Lean tools in a piecemeal fashion. Stopping to ask, ‘What are we trying to accomplish?’ is commonly skipped. In my experience this piecemeal approach never works in the long term, apart from some short-term, quick wins, followed by an inability to sustain the gains and continuously improve. Lean is a systematic approach to improvement where joined up thinking is required.
As Dr Deming profoundly advised us, need must drive change. The hoshin process addresses the needs of the business. It invites us to think about what we do need to change from being, towards what we do need to change to be. This requires that we examine past performance, reflect on why we are in business, what drives us and where we are going. Through numerous diagnostic methods and creative thinking we craft the near and long-term objectives that will get us there. Alignment and buy-in are nurtured throughout the organisation through the hoshin process. Hoshin packages your strategy concisely in a systems format on a single sheet so people can understand it profoundly and hence execute it successfully. Learning and adjustment are performed on the strategy on a frequent basis. This is a very different approach from the traditional practice of taking down from the top shelf a dust laden, upper management strategy once a year in order to develop the following years.