
Lean methods and tools (part IV)
This chapter discusses quick changeover in Section 1 and total productive maintenance (TPM) in Section 2.
SECTION 1: QUICK CHANGEOVER
Introduction
Changeover is defined as all the activities involved between delivering the last good product or service to delivering the next good product or service at the specified level of efficiency. Changeover is relevant across all industries: from the changing of a mould on a plastic injection machine, to setting up for the next procedure in a hospital’s operating theatre, to a software engineer getting up to speed on a new application having switched tasks from another project. The last is known as cognitive changeover and is a common predicament in the knowledge economy.
The quick changeover, or SMED process as it is commonly known, was formulated in the 1950s by Shigeo Shingo.1 The acronym SMED refers to single minute exchange of die (tool) where the single minute refers to a sole digit or, in effect, changing over in less than ten minutes. It is common to achieve reductions in changeover of 50% or more with very low capital expenditure. Achieving quick changeover is an ideal candidate for the kaizen events discussed in the previous chapter.
The classic approach to moderating the impact of changeover in a business is to perform as few changeovers as possible and keep equipment or people producing large batches when the equipment is running well. But there are many unintended consequences of this practice, perhaps the worst being inflated lead times (time is money!). One reason for this is because in large batch processing there is an increased risk of quality write-offs due to extended feedback loops on quality conformance, and lead time is increased when we work with large batches (see Chapter 9 for further discussion on lead time and its impact on cost and other factors).
Why quick changeover?
The benefits are as follows:
- Reduced inventories : in manufacturing and services, batch sizes can be reduced as the time for changeover is reduced. This in turn allows smaller inventory quantities to be carried and overall product lead time is reduced through smaller transfer batches. To reduce changeover time by 50% while at the same time doubling the number of changeovers inventory can be reduced by up to 50%. So the deeper reason for changeover improvement is to be able to conduct more changeovers and reduce lead time. A metric called every product every interval (EPEI) measures the time interval that your complete range of product offerings are cycled through. The smaller this interval the leaner your organisation will become and the greater its potential to offer product diversity as a strategic tactic. Inventory holding costs include obsolescence, theft, damage or spoilage, insurance, handling (equipment and labour), cost of money tied up in inventory, space and racking allocated to inventory, and cost of updating inventory control systems such as SAP. Depending on the industry these costs can amount to a yearly holding cost of 50–80% of the value of the inventory. For example, if you are carrying on average £100,000 of inventory at any given time, it may be costing you an additional £50,000 to £80,000 per year to hold this (depending on the industry type). So you should give your full attention to the levels of inventory that you are holding and that they are the appropriate amounts, in the appropriate place, at the appropriate time.
- Higher quality levels: when inventory levels are lowered product is moved faster through the value stream and potential non-conformances are discovered more quickly. This leads to an increased probability of finding the true root cause of faults.
- Improved flexibility: reducing set-up time frees up capacity and the capability to offer and deliver more products or services.
- Improve frontline employee capabilities: involving frontline people in problem solving and kaizen leads to the development of new skills and increased levels of engagement.
- Lower costs: operational capacity improvement leads to increased output and the potential avoidance of further capacity and facility expenditure to meet demand.
‘One of the most noteworthy accomplishments in keeping the price of Ford products low is the gradual shortening of the production cycle. The longer an article is in the process of manufacture and the more it is moved about, the greater is its ultimate cost.’
Henry Ford2
It is important to have a strategy for exploiting improvements in changeover performance. This ranges from increases in capacity to the potential to serve niche markets that demand small batches of diversified products. Many companies are using quick changeover as a way of differentiating their business. One excellent example is Southwest Airlines. It leads the industry in terms of cost and customer satisfaction through its speed at emptying one aircraft on the ground to having the aircraft loaded and back in the air. It takes the airline between 20 and 30 minutes for a 137 seater aircraft.3 For its competitors the turnaround time is approximately one hour. Ground time is non-revenue generating for aircraft companies; consequently changeover improvement has immense implications for profitability.
Quick changeover does not mean rushing through the steps to achieve the changeover; quality will be improved through the removal of waste and hence process steps (fewer process steps means fewer potential opportunities for errors). Most pre-SMED changeover processes contain 80% waste: this is because they are often not deliberately designed as a process. They are frequently seen as a necessary burden and changeovers are hated by team members in general due to the hassle factors involved. Fewer steps and better teamwork allied with simplified decision making actually enable superior quality in less time.
A powerful example of quick changeover is the pit stop process in Formula 1 racing. When the car stops at the pit, preparation is first class, with the right quantity of equipment and material in place and in working order. There is no searching for items and the team is in position and ready to go. In business this is often not the case. For example, the production line or operating theatre may sit waiting for people to be available to work on the changeover and when they do start to work the roles and responsibilities for changeover are often unclear. Added to this is often the availability of equipment and supplies. Frequently they are not in place and time is wasted searching for them. In the pit stop, teamwork is first rate and everybody has defined roles and rehearses the routine regularly. Economies of repetition lead to increased competency. As a result the changeover in Formula 1 can be performed in less than five seconds; just a few years ago this remarkable feat was ten seconds but never say that good is good enough!
Figure 7.1 shows the approximate breakdown of typical changeovers and the opportunity for improvement: 80% of the time is generally in the preparation and ramp-up stages.

Figure 7.1 Changeover stages
Ways to implement SMED methodology
Team selection
Cross-functional team: frontline associates, supervisor, technician, engineer and Lean coach (usually a team of 5–8 people).
Train stakeholders
In why the improvement is being sought and what the benefits are for the business and the people themselves, the SMED process, process mapping, standard work combination chart, TIM WOOD DOES IT waste categories (see Table 1.2), and A3 problem solving.
Collect data and study the existing changeover
A number of roles are required to study the changeover process. The scribe documents the process. The timer clocks each task. Sometimes these two roles can be performed by the same person depending on the pace of the changeover. The pacer outlines the motion of the changeover person on a spaghetti diagram (see the Glossary). A video camera is very valuable for studying the process because it provides irrefutable evidence as to the current state. The waste observer records all instances of operational waste that have been detected. Ideally an individual scribe, timer, pacer, video recorder and waste observer should follow each person performing the changeover.
A typical changeover analysis sheet is shown in Figure 7.2.
SMED four-step process
The team meets after the data collection and develops a theoretical reference changeover sequence and time. A reference changeover is the time that a waste free changeover would take. The SMED stages are shown in Figure 7.3 and detailed as follows:
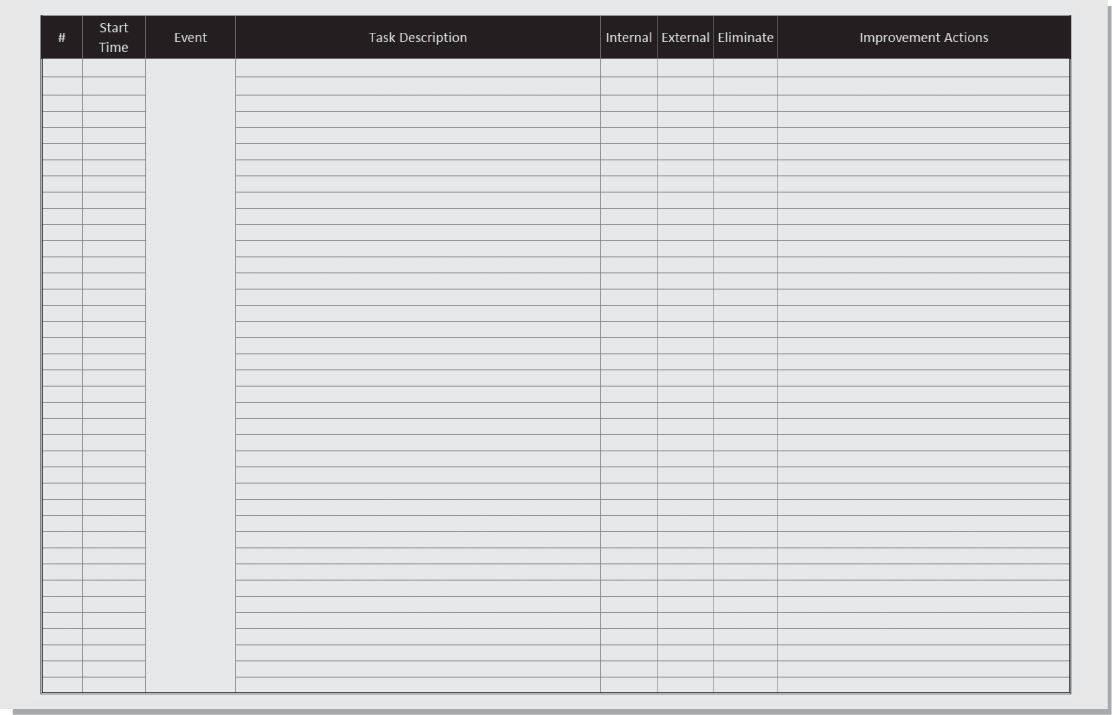
Figure 7.2 Changeover analysis sheet
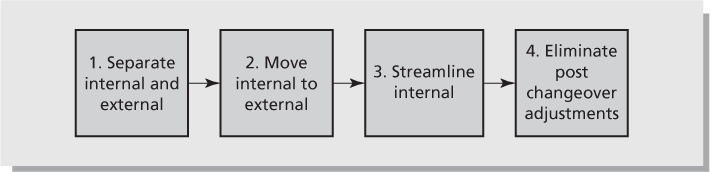
- Separate internal activities (equipment must be stopped to do this activity) and external activities (this activity can be done whilst equipment is operating). For example, ensuring that all the required equipment is in position for the changeover is an external activity. An example of an internal activity would be cleaning a hotel room between guests.
- Move internal to external: brainstorm ways to enable activities that are currently performed when the equipment is stopped to be done when the equipment is running.
- Streamline internal: identify ways to enable faster application of internal activities. An example of this would be the replacement of bolts with toggle clamps (if appropriate) on a hydraulic press machine.
- Eliminate post-changeover adjustments (time to return to the normal rate of working and quality checks etc.): look for ways to maximise the speed that the operation is returned to normal efficiency after the changeover has been completed.
Figure 7.4 shows the four-step SMED process in action.
‘… many companies have set up policies designed to raise the skill level of the workers, few have implemented strategies that lower the skill level required by the set-up itself.’
Shigeo Shingo4
Develop an improvement action plan that includes both ‘soft’ organisational changes and ‘hard’ design led changes. Your team can then move into the implementation stage to deliver the improvements.
Figures 7.5 and 7.6 illustrate the impact of SMED on changeover time when tasks are performed externally when the equipment is running, performed in parallel, streamlined and/or engineering and design methods are deployed to reduce the time of ramp-up to defined levels of efficiency. Using these techniques you will generally see a 50% reduction in changeover time.
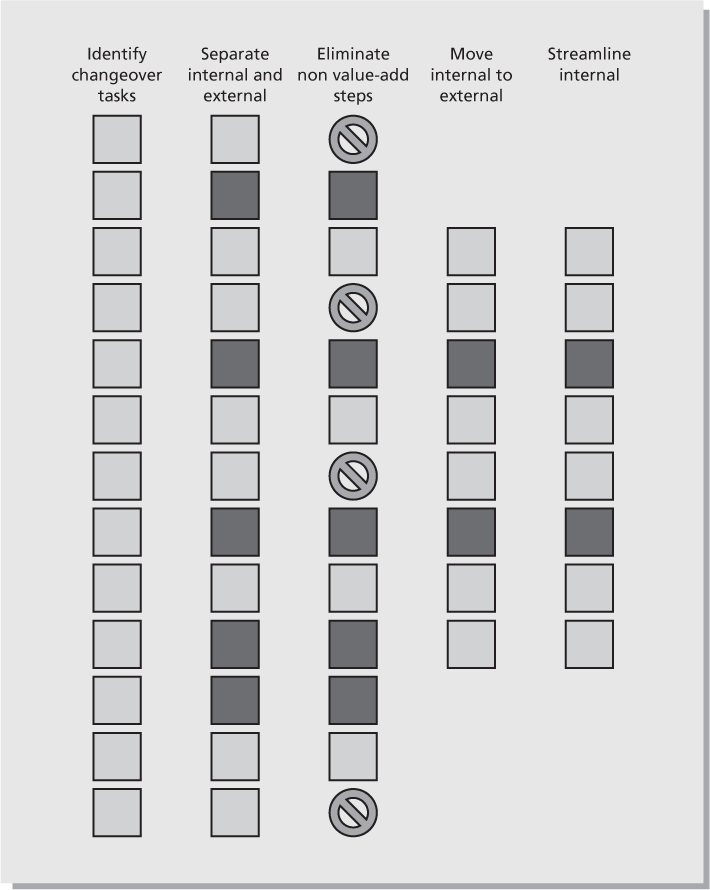
Figure 7.4 Sticky notes used to develop the future state changeover using the four-step SMED process
SMED improvement prompts
- Conduct tasks in parallel
- Break task interdependencies
- Use quick release couplings
- Use power tools
- Use location pins
- Use hydraulic lifters
- Use magnetic clamps
- Use overhead lifting aids
- Eliminate adjustments
- Replace bolts with wing nuts
- Apply 5S to the area (see Chapter 4, Section 1)
- Provide instructions at point of use
- Use visual controls or cues to reduce cognitive orientation (knowledge work)
- Redistribute tasks to obtain a better flow
- Open up tolerances
- Heat treat parts that wear
- Light weighting – replace steel with aluminium
- Use magnets
- Use gravity to good effect
- No changeovers during break times
When the process improvements have been implemented, the process needs to be verified. Re-time and video the process and study it for yet further improvements. Write and adopt new changeover standards and build consensus across shifts. It creates buy-in if you involve associates in designing the standard work and then train people according to the new standard. Sustaining the gains is fostered if you include a changeover time metric in your operational review meeting. It is good practice after the SMED event to conduct a review with your team members to maximise what has been learned.
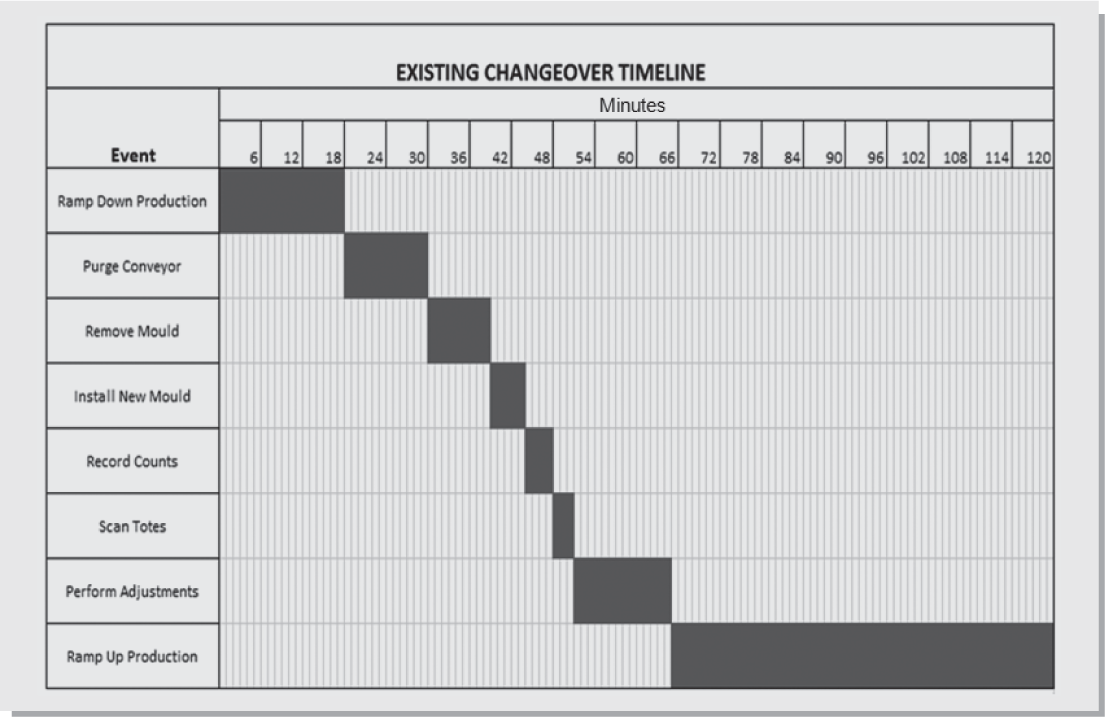
Figure 7.5 Pre-SMED changeover example
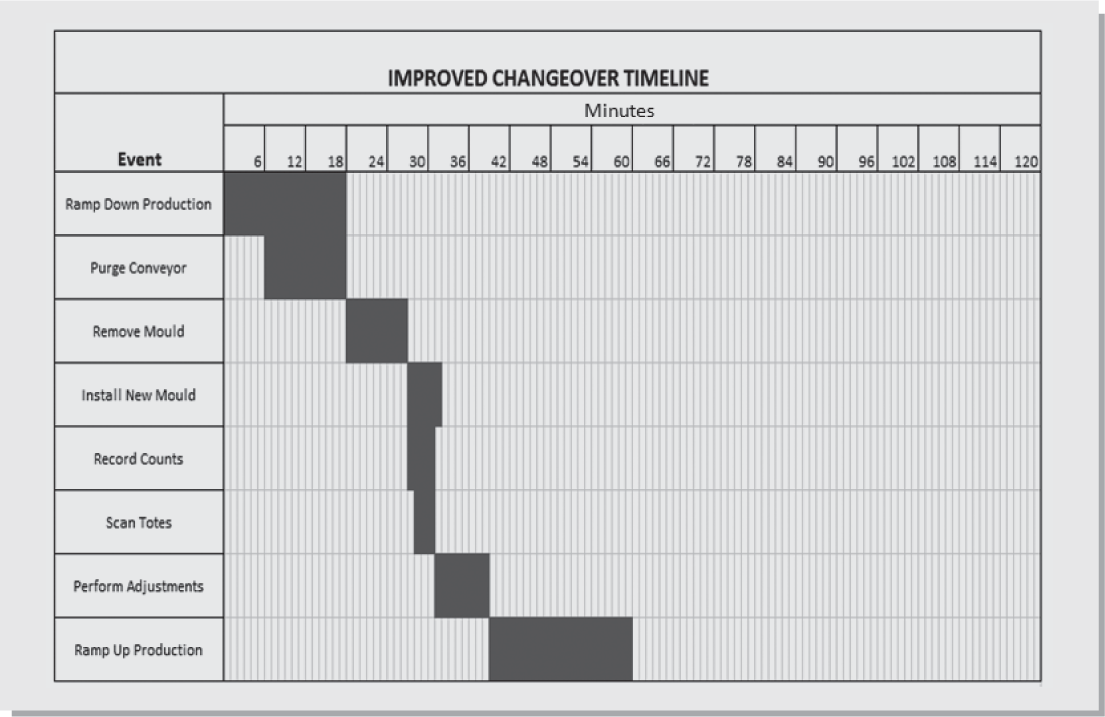
Using a visual management board (see Figure 7.7) is also an extremely effective way of sustaining gains from the initial SMED event and driving further, daily, continuous improvement. The board depicts the analogy of the racing pit crew to demonstrate the philosophy of quick changeover. The post-SMED standard work procedure for the improved changeover is displayed. The old adage of ‘tell me how you will measure me and I’ll tell you how I will behave’ is very true. The fact of measuring and reviewing change-over performance will evoke what is known as the Hawthorne effect, which instantly improves performance significantly. (If you have not heard of this, the Hawthorne effect is a form of reaction where people improve or adapt their behaviour from simply being measured.)

Figure 7.7 Visual changeover board at the gemba
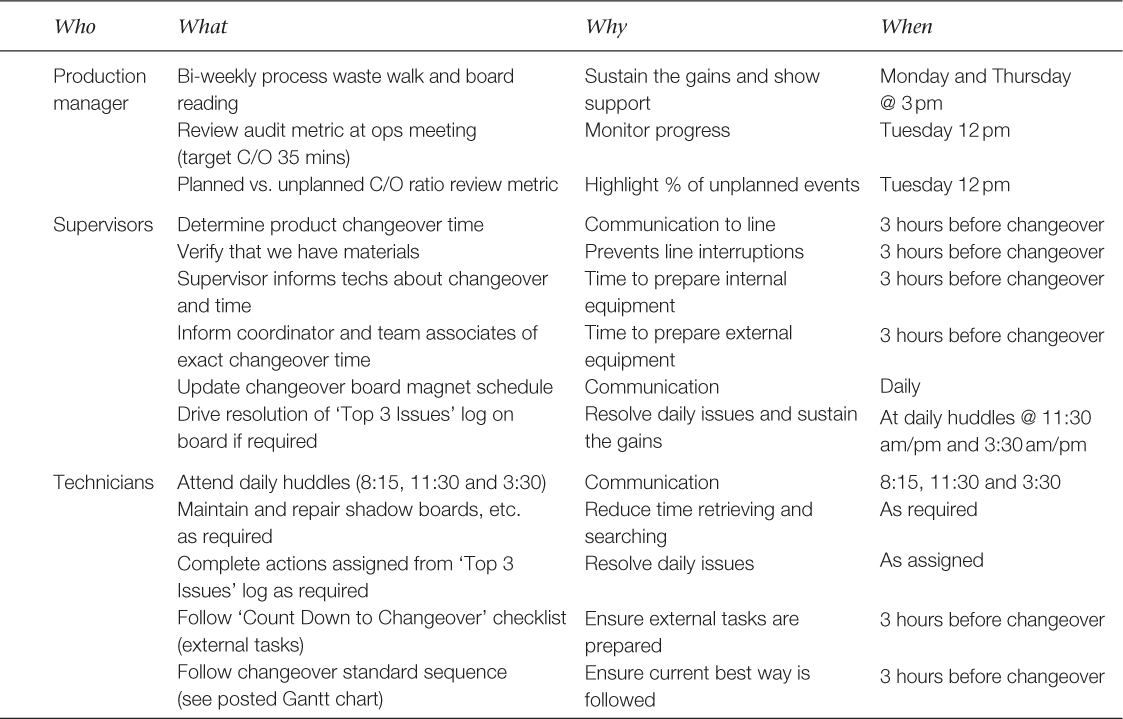
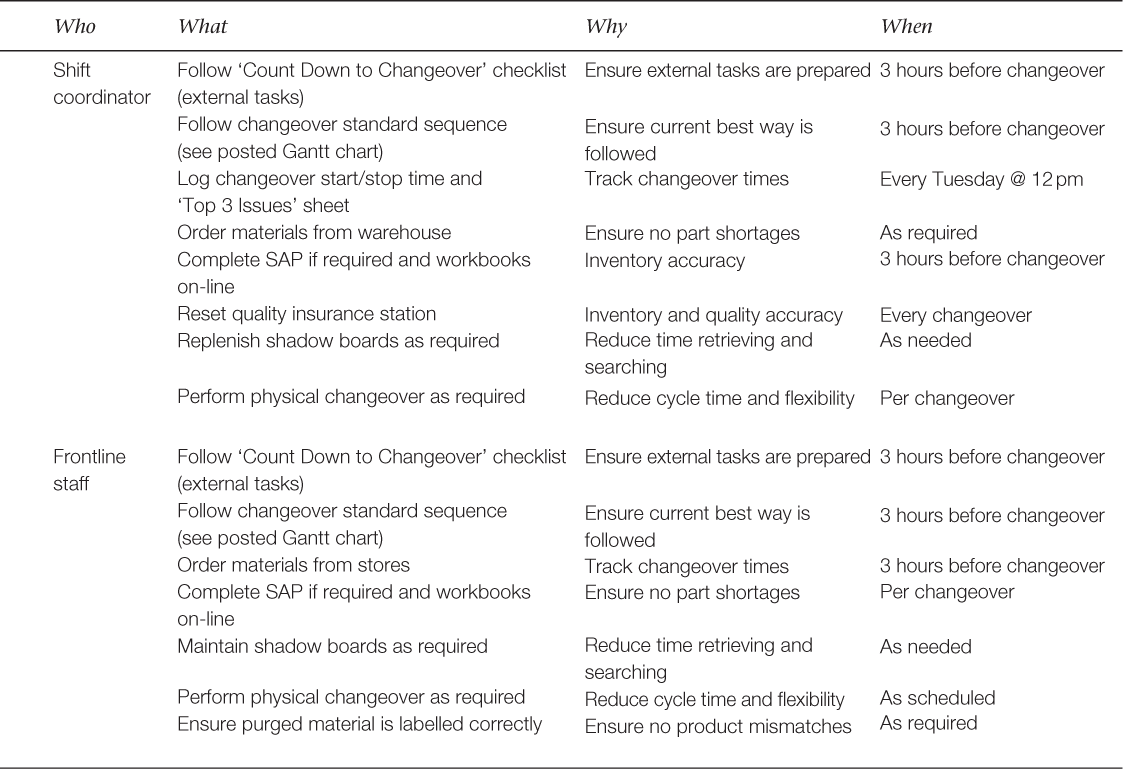
The board displays both an automated electronic metric and a manual version. This forms a good reference for comparison and also enables the frontline workers to interact physically with the visuals. To help to build ownership, photos of changeover shift champions can be displayed and also roles and responsibilities are outlined in the leader standard work (see Table 7.1). The schedule of changeovers is displayed and magnets are used to populate daily and hourly timeslots where changeovers are scheduled. This helps to inform the team when they need to start preparation for changeover (consider that approximately 30% of changeover time is preparation). The countdown to changeover checklist details the tasks that need to be completed (see Table 7.1). Finally the board has a section that captures issues from each changeover so that continuous improvement is practised between every changeover, leading to everyday incremental gains in performance.
Quick changeover review
Quick changeover is one of the most rewarding but amazingly absent methods deployed across most businesses today. Every day we come across examples of poor changeover, from waiting for a hotel room to be ready for occupancy, to waiting in line to board a plane at the airport. The benefits of slick change-over include lower inventories, on-time deliveries and improved efficiency. Achieving quick changeover will ultimately result in improved productivity, more satisfied customers and staff, and increased profits.
Table 7.1 Changeover leader standard work
Introduction
True Lean transformation is unattainable in your organisation if you have low equipment reliability. Total productive maintenance (TPM) takes a holistic view of equipment including concepts that cover availability, performance, quality, safety and capital investment.
Why TPM?
The importance of TPM becomes critical as organisations become leaner and hence more exposed to:
- shorter lead times
- lower levels of inventory
- tightly linked processes.
Hence machine stoppages can be extremely disruptive and effective maintenance is vital to achieving output targets. A great deal of capital expenditure is classically wasted on new equipment rather than making the best use of existing equipment. TPM tackles these issues at the source.
TPM will bring maintenance into focus as a necessary and vitally important part of your business. Scheduled time for maintenance is integrated into the routine work day. The idea is to have emergency and unscheduled maintenance become a thing of the past.
In the 1950s, equipment maintenance was not practised to be preventive; it predominantly involved just the act of repairing a piece of equipment after it broke down. It was, in effect, breakdown maintenance: react only when the equipment has failed. In due course management came to realise the importance of preventing equipment breakdowns in order to boost productivity. Thus, scheduled maintenance activities in order to prevent unforeseen breakdowns (preventive maintenance) gradually became popular. Under this approach equipment maintenance was the sole responsibility of technical personnel in the maintenance department.
In the 1970s, the concept of productive maintenance became popular. This combined into one system: preventive maintenance, equipment reliability engineering, equipment maintainability engineering, and equipment engineering economics. In this system, the technical or engineering group still had the foremost responsibility for equipment maintenance.
The concept of ‘true’ TPM in which everyone from the frontline people to senior management own equipment maintenance evolved shortly afterwards. TPM embraces various disciplines such as 5S, inspecting for early failure warnings, and frontline equipment ownership. This creates the environment where everyone has a stake in and responsibility for keeping equipment running and productive.
The frontline workers are no longer restricted just to running the equipment and calling a technical specialist when a breakdown occurs. They are actively involved in monitoring, cleaning, lubrication, adjustments, and also perform basic calibrations on their respective equipment. This will free your technical workforce for complex preventive maintenance activities that require more of their technical expertise. Management should also show interest in data concerning equipment uptime, utilisation and efficiency. In short, everyone understands that the concepts of zero breakdowns, maximum productivity and zero defects are goals to be shared by everyone under TPM.
Aside from eliminating equipment downtime, improving equipment productivity and defect reduction, TPM has the following goals: improvement of personnel and team effectiveness through the sense of ownership of performance targets, and a reduction in operational costs and throughput times. However, TPM cannot be implemented overnight. Normally it will take your organisation at least two to three years to establish an effective TPM system.
TPM pulls in many other Lean methods including:
- 5S (workplace organisation)
- SMED (set-up reduction)
- problem solving
- poka yoke
- team coaching and facilitation.
(Note: the success of your Lean transformation will be dependent upon how the philosophy, principles and methods all work holistically together as a system.)
Application of TPM
Your leadership team should set definitive annual objectives for the TPM programme (ideally through your hoshin planning process, as described in Chapter 2). The objectives might address specific performance measures such as MTBF (mean time between failure), MTTR (mean time to repair), equipment availability, performance efficiency, quality, safety, percentage of employees participating, and growth in employee skill versatility.
The implementation should begin with just a few target or pilot areas. The purpose of the pilots is to minimise risk by limiting the rollout to a controlled area and to build a showcase example to encourage the spread of these local success stories across your organisation.
A pilot area should be selected based on:
- a high probability of success
- an area that has important but resolvable maintenance problems
- where employee–manager relations are good
- where employees are open and willing to try new ideas.
TPM improvement plan
Only the critical equipment and/or bottleneck or near bottleneck processes should be subjected to the following rigorous care plan. A bottleneck occurs when the capacity of your organisation is limited by a specific resource. Without increasing this resource the performance of the overall system cannot be improved as this is the ‘pinch point’.
The care plan
This consists of the following steps.
1. Current state analysis
Through observations, interviews, and analysis, the team gathers data about the current state of the equipment in terms of production losses, downtime, MTBF, etc. The team assesses current skills of your personnel, other skills they will need for TPM, and their motivation to learn additional skills. The assessment can be done with the assistance of small groups of team members. The team assesses all matters relating to maintenance – 5S, productive maintenance, procedures for scheduling and managing productive maintenance and repairs, etc., and the organisation’s culture and ability to adapt to change. A TPM visual management board can be established at the gemba to show progress along the improvement journey (similar in concept to the changeover storyboard, see Figure 7.7). Collect manuals and drawings covering mechanical, hydraulic, electrical, and pneumatic aspects of equipment. Assemble available data on history – installation records, working patterns, performance rates, replacements, and planned maintenance records. Also identify any accident black spots or other safety risk areas.
2. Calculate current overall equipment effectiveness (OEE) and address losses
The True North target condition for your equipment is to operate 100% of the time it has demand (availability) at 100% of the designed capacity rating (performance) and with 100% perfect yield (quality). OEE measures the achievement of this ideal.
OEE = availability × performance × quality
OEE helps to really focus on the potential of a process and to highlight previously obscured problems. If a set of process metrics was reporting, for example, availability at 93%, performance at 90% and quality at 97% then many managers would be satisfied that things were going pretty well. However, when these metrics are aggregated together through multiplication a different picture emerges.
OEE = availability (93%) × performance (90%) × quality (97%) = 81%
This means that if the equipment is running around the clock then 32 hours are being lost every week to mainly concealed and non-obvious losses!
There are six losses associated with the calculation of OEE: for availability these are breakdowns and excessive length of time to changeover; for performance these are minor stops and running at reduced speed; and for quality these are yield losses and start-up defects (see Figure 7.8).
Your team should identify and Pareto (80/20 rule) the most important losses and perform systematic problem solving to address the root causes.
Another modification of OEE is a metric called total effective equipment performance (TEEP). TEEP is a financial tool for management rather than a frontline focusing metric. It is a measure of capacity loading on an asset and can alert management to opportunities to improve sales or the volume of work that comes into a facility. You could have a high OEE for two shifts whilst there are no orders for the third shift, and TEEP will highlight this.
There are however several concerns you need to be aware of when using the OEE metric:
- OEE says nothing about schedule attainment. It is useless having a high OEE if you are making the wrong products.
- You can improve OEE in good and bad ways. Good ways are to reduce minor stoppages and decrease the duration of change-overs. A bad way is to do fewer changeovers (remember the EPEI metric discussed earlier). OEE is not an end in itself. This is where the balancing metrics introduced in Chapter 2 need to be deployed to prevent potential unintended consequences of what you measure.
- Do not measure OEE organisational wide. Combining machine performance is meaningless. Target only critical machines such as bottlenecks.
3. Initial clean up and condition evaluation
Photograph the current state of the equipment. Systematically inspect every part of the machine in great detail. Discuss and understand the role of each component and their interdependencies – not superficially but in detail. Discuss the optimum conditions for the operation of each critical component (such as temperature, lubrication, cleanliness and sharpness). Clean and inspect, capturing all problems found. At the end of the cleaning, fill in an appraisal form for each component covering mechanical, hydraulic, electrical and pneumatic categories. Develop a cleaning and inspection programme. Identify sources of contamination (internal and external) and develop a plan to eliminate the source of the contamination, and if necessary clean. Develop the restoration plan and ownership to include quick changeover tooling and poka yoke devices (see Chapter 8, Section 2) to eliminate the source of potential errors if required.
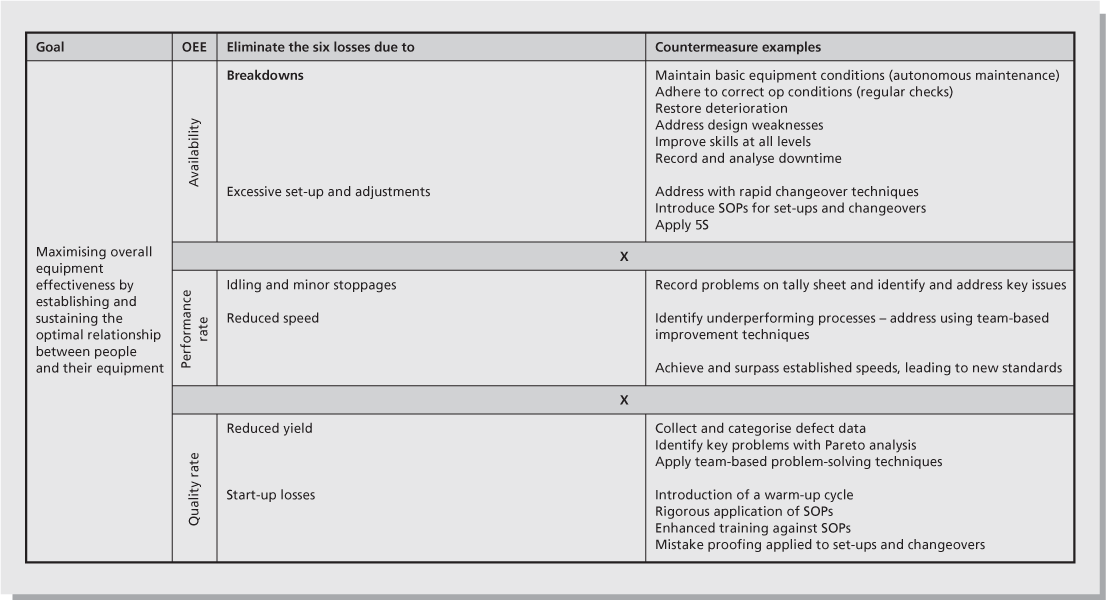
Figure 7.8 OEE metric and equipment loss countermeasure
4. Develop asset care
Clearly define the roles and maintenance tasks for the frontline staff. Produce a cleaning schedule for the equipment. Develop a kamishibai (Japanese term that loosely translates as ‘sequence of events’) board. This is a visual management mechanism for the completion of routine daily activities. When the activity is completed the card is turned backwards. It is colour coded: red to indicate that the task is due, green to indicate that the task has been completed. Identify, mark and colour code all gauges, pipe work, lubrication points, levels and sight glasses, and nut positions, etc. Label all components and tools – with cross references to their specific equipment. Indicate flow directions and motor rotations. Install transparent inspection windows and covers over critical components so that they are visual.
Figure 7.9 illustrates a visual prompt to alert people that the bolts have worked loose; the line will no longer match up to form a continuous straight line. Can you think of any situations where this simple practice could really improve reliability and safety in everyday life?

Figure 7.9 Scribe a line across a nut and onto the mounting casing
Asset care is applied using a seven-step process known as autonomous maintenance:
- Initial cleaning and inspection (often using yellow tags to highlight areas requiring attention).
- Eliminate sources of grime and facilitate cleaning (enclosures, etc.), improve accessibility and make inspection easier through the use of transparent equipment covers, etc.).
The first two steps re-establish and control basic conditions and prevent deterioration. - Prepare standards for cleaning, lubrication and tightening (single point lessons, etc.).
- Carry out technical inspection (audit against newly prepared standards).
- Coordinate maintenance activities.
The above three steps develop equipment knowledge and check and correct deterioration. - Organisation and visual management (standard work, poka yoke devices, storyboarding, etc.).
- Sustain and improve (employees gain confidence and competence through team-based improvement activities). TPM becomes ‘business as usual’.
The last two steps ensure that the continuous improvement embeds into the culture and that the gains are held.
A good analogy to autonomous maintenance is Heinrich’s Law. Herbert W. Heinrich5 proposed the following concept that became known as Heinrich’s Law (see Figure 7.10).
In a workplace, for every accident that causes a major injury, there are 29 accidents that cause minor injuries and 300 near misses that cause no injuries. And so with equipment, before one serious breakdown occurs, there were 29 minor disturbances and 300 malfunctions that caused no downtime. Frontline, employee-driven, autonomous maintenance is the engine which addresses potential signs of equipment breakdowns and is therefore an important mechanism to prevent prolonged and costly equipment downtime or total failure. It also greatly expands the lifecycle of equipment through daily preservation.
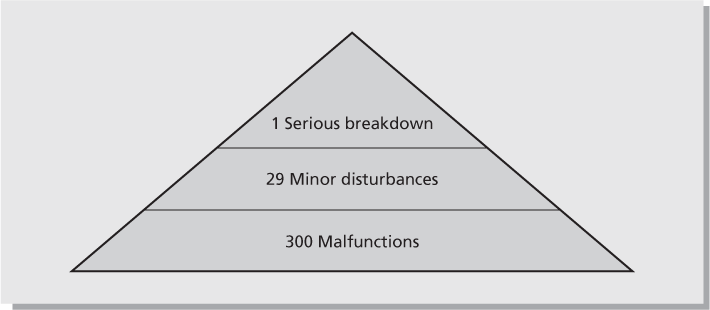
Figure 7.10 Heinrich’s Law applied to equipment failure
As part of TPM employees’ roles will change (see Table 7.2).
5. Consolidate best practice
Taking all that’s been learned in previous steps, you develop a best practice manual. Develop single point lessons (see Figure 7.11) where necessary to encapsulate best practice routines. Review standard work and amend where necessary including pictures, in consultation with frontline employees, and display the results at the gemba. Review the maintenance instructions. Review equipment spares – what needs to be kept, where, and how much? Index the spares and cross reference with manuals and SOPs. Develop a spares catalogue associated with each machine. Locate the manuals appropriately – not in the office, but at point of use.
TPM review
Most people have minds of gold … harnessing the latent potential of your people through involvement in TPM is good for business. People are the best condition monitors of equipment that were ever invented! TPM has an extremely positive impact on culture and workers love to have a say in decision making that affects them. You cannot become an enduring Lean organisation without the foundation of operational basics and TPM is about looking after the basics. The key message is that the quality of your maintenance is the preservation of your customers’ quality. TPM makes it easier to do things right and difficult to do things wrong.
Table 7.2 Changing roles as part of TPM
| The new role of frontline staff | The new role of maintenance |
| Run equipment | Perform complex maintenance tasks (skill/task alignment) |
| Identify potential problems (use of five senses) | Solve complex maintenance problems |
| Keep equipment clean and tidy | Monitor and predict machine performance |
| Perform autonomous maintenance tasks | Plan and implement predictive maintenance |
| Collect performance data | Coordinate the development of standard work, single point lessons and checklists |
| Put forward improvement ideas and coordinate implementation | Train frontline staff in autonomous maintenance using the training within industry (TWI) programme |
| Participate in kaizen events | Participate in kaizen events |
OEE is a particularly harsh metric but extremely effective (the aggregate effect highlights the existence of concealed problems) in that it encourages the ‘best of the best’ historical performance. I recall hearing one of the world’s foremost TPM experts, Peter Willmott, say that if your OEE is 60% this means that you are, in reality, effective only three days of the week! Other metrics such as yield and efficiency miss this reality. OEE is best measured at bottleneck resource points but also provides the hidden benefit of driving down work in progress as reliability increases at non-bottleneck resource points (as the bottleneck is broken). This enables a complementary shift towards other Lean metrics such as EPEI and improved customer responsiveness.
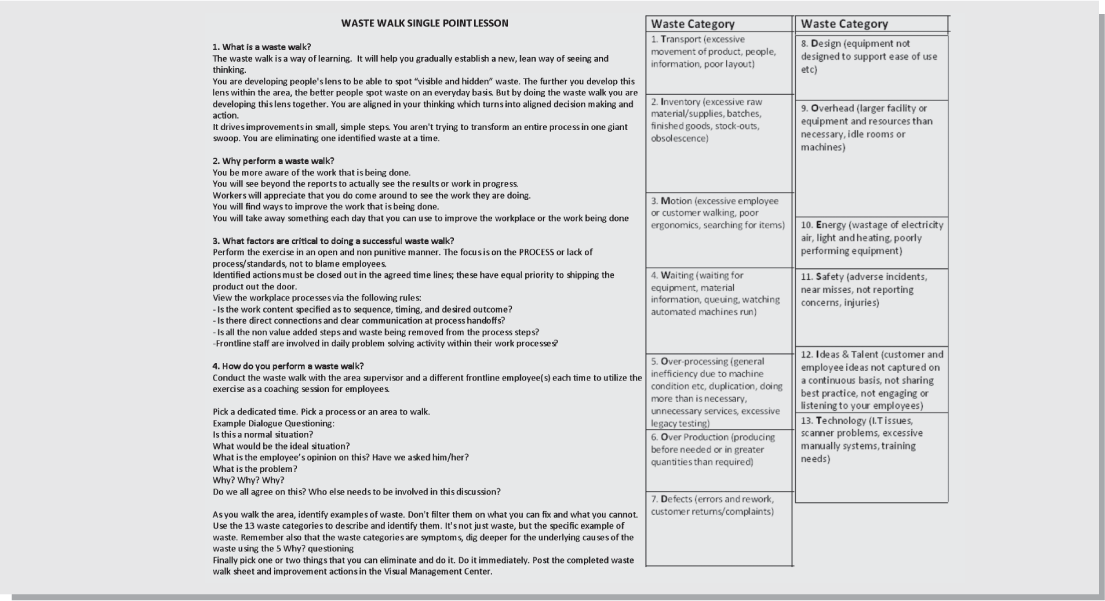
Figure 7.11 Single-point lesson example for a maintenance process waste walk