
Designing Reports
Generating Reports
Deploying Reports
One of the key components of almost every business application is reporting. Businesses put data into the system in order to get useful information out of it, and this information is generally in the form of reports. Numerous reporting tools and engines are available, and it can often be hard to choose which one is best for your application or system (they tend to work in different ways and have different pros/cons).
Visual Studio 2010 contains a built-in report designer that saves to files using the RDL file specification — and reports built using this designer can be generated using the local report engine, or rendered on a remote report server running SQL Server Reporting Services.
The professional versions of Visual Studio 2010 (and higher) also come with another well-known reporting tool called Crystal Reports. However, this chapter specifically looks at Visual Studio's report designer, and how to use it to design and generate reports (using the local report engine).
When you start designing reports, you will either want to add a report to an existing project or start a completely new project (such as for a reporting application). If it is the latter, the easiest way to get started is to create a new project using the Reports Application project template. This creates a Windows Forms project already set up with the necessary assembly references, a form with the Report Viewer control on it, and an empty report. Let's look at the former scenario and how to manually get started (which really isn't much extra work).
Reports can be viewed in either a Windows Forms application or an ASP.NET application using the Report Viewer control. There are two Report Viewer controls — one for use in web projects and one for use in Windows Forms projects, and both are almost identical in appearance and how you use them to render reports.
Note
To render reports in a WPF application, you can use the Windows Forms interoperability feature detailed in Chapter 18 and use the Windows Forms control (because there is no Report Viewer control in WPF). Displaying reports in Silverlight applications is a bit harder because Silverlight has no Report Viewer control either (nor support for printing). In this case it is probably best to render reports to PDF, stream them through to the client using a HTTP handler, and display them in a different browser window.
Now you need to add some assembly references to your project that are required for using the Report Viewer control and the report engine. If you are working with an ASP.NET project you will need to add a reference to Microsoft.Reporting.WebForms.dll, or if you are working with a Windows Forms project you will need to add a reference to Microsoft.Reporting.WinForms.dll. Alternatively, the Report Viewer control should be in your Toolbox for both project types, and dropping it onto your report will automatically add the required assembly reference to your project.
Now add a report definition file to your project. Add a new item to your project, and select the Reporting subsection as shown in Figure 30-1.
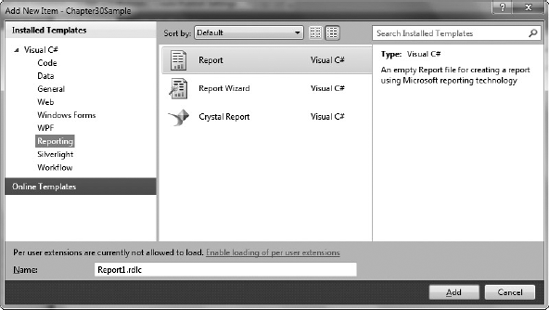
Two items here are of interest: the Report item and the Report Wizard item. Selecting the Report item creates an empty report definition file — essentially a blank slate that you can start working with. Selecting the Report Wizard item creates a report definition file and automatically starts the Report Wizard (detailed later in this chapter), which will design a report layout for you based upon your choices. You will generally want to start your report by using the Report Wizard, and then modify its output to suit your requirements.
Before you get into designing the report, it is important to clarify the different parts of a reporting system, the terms you use when you reference each, and how they hang together (because this can be somewhat confusing initially). There are six main parts:
You use the report designer to design the report definition file (at design time), creating its structure and specifying the various rules of how the report will be laid out. At run time, you pass the report definition file and one or more data sources to the reporting engine. The reporting engine uses the two to generate the report, which it then renders in the Report Viewer (or a specified alternative output format such as PDF).
Note
Where this can become confusing is that the Report Viewer is the local report engine. So you are passing the report definition file and the data sources to the Report Viewer and it then both renders and displays it. From a conceptual perspective, however, it's probably best to think of these as separate components and it will make more sense.
Take a look now at how to go about designing a report. You will look at the manual process of designing a report, and then later take a look at how the Report Wizard automates the design process. For now, you will be working with an empty report that was created by adding a new item to the project and using the Report item template. When you create this item it will immediately be opened in the report designer as shown in Figure 30-2.
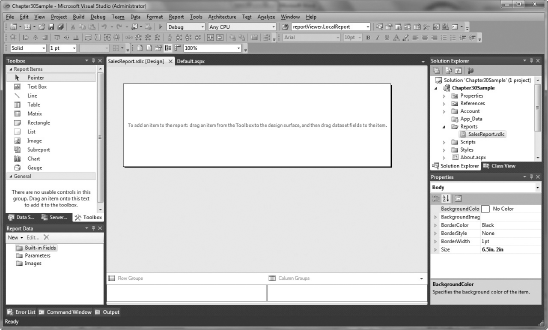
In the document area you have the design surface upon which you lay out the report. On the bottom left is the Report Data tool window, which will contain the data fields that you can drag onto your report. If you accidentally close this window you can open it again by using the View
Note
Due to the nature of the local report engine, which can't query data sources itself (as discussed shortly), there unfortunately is no way to preview the report in the designer. This means that in order to view the output of your report you must have already set up a form with a Report Viewer control, and have written the code that populates the data structures and initiates the rendering process. This can make the report design process a little painful, and it is possibly worthwhile creating a temporary project that makes it easy to test your report. You can find the code required to do so later in this chapter.
Before you can design a report you need to start with a data source, because it is the data source that will dictate a large portion of the report's design. At design time the data sources won't contain any data, but the report needs the data sources for their structure.
An important concept to understand when starting with the local report engine is that you must pass it the data when generating the report — it doesn't query the data sources itself. The upside of this is that the data can come from a wide variety of sources; all you need to be able to do is to query the data, and you can then manipulate it and pass it to the report engine in a structure that it understands. The main structures you can use to populate your report that the report engine will understand include DataSets, objects, and Entity Framework entities.
Note
The server report engine (SQL Server Reporting Services) can query SQL Server databases itself (and some other various data sources via OLEDB and ODBC), and the query to obtain the data used by the report is stored in the report definition file. You can spot report definition files that are for use by SQL Server Reporting Services fairly easily because they will have an .rdl extension, whereas the files for use by the local report engine have an .rdlc extension (the c stands for client-side processing). It's reasonably easy to convert reports from using the local report engine to using SQL Server Reporting Services, because the underlying file formats are based upon the same Report Definition Language (RDL). The reason you might use SQL Server Reporting Services over the local report engine is to reduce the load on your server (such as the web server), and offload that to a separate server. Generating reports can be quite resource- and CPU-intensive, so you can make your system a lot more scalable by delegating this task to another server. SQL Server Reporting Services requires a full SQL Server license, but if you're using SQL Server Express Edition you can use a limited version of it if you install the free SQL Server Express Edition with Advanced Services.
You can use an Entity Framework model for the data source for your report; however, a limitation of the local report engine is that you can't join data from separate data sources (in this case entities) in the report, which is often required in reporting (unless you have imported views from your database into your Entity Framework model that align with the requirements for your report). Therefore, you will need to either create a Typed DataSet or create a class to populate with the joined data, which you can then pass to the report engine.
As an example, you will simply be using the AdventureWorksLT Entity Framework model that you created in Chapter 29 as the source of the data for this report. The first step is to add an entity from this model as a data source for the report. To do so, click the New menu in the Report Data tool window, and select the Dataset menu item. This displays the Dataset Properties window shown in Figure 30-3.
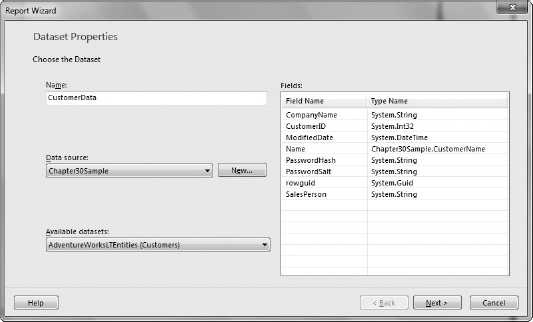
You should give the data source a meaningful name, because you will be referencing the data source name in code when you are passing the local report engine the data to populate it with. Enter this name in the Name textbox. Now you need to select the location of the data source from the Data Source drop-down list. The data source will usually be in your project, so you can select it from the list.
Click the New button to add a source of data to your project (such as to create a new entity model if it doesn't already exist). This opens the Data Source Configuration Wizard detailed in Chapter 27. You will assume the Entity Framework model of the AdventureWorksLT database that you created in Chapter 29 already exists in your project, so you can skip this step and simply select the type of entity objects that you will be passing to the report (for this example you want the Product entities) from the Available Datasets drop-down box. Finding which item to select when dealing with Entity Framework entities can be rather confusing initially, but the parent entity is the first part of the item name, and the name of the actual entity you want to use in the report is in the brackets following it. So to select the Product entity in the AdventureWorksLTEntities model you select the AdventureWorksLTEntities (Product) item. When you select the item the list of the fields it contains are displayed in the Fields list. This data source will now be displayed in the Report Data tool window, and will list the fields under it that you can use in your report.
If this data source changes (such as if a new field has been added to it), right-click it and select the Refresh item from the context menu to update it to its new structure.
If you take a look at the Toolbox tool window you will see that it contains the various types of controls that you can use in your report, as shown in Figure 30-4.
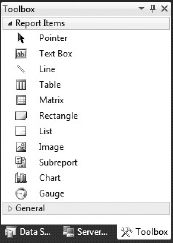
To use a control, simply drag and drop it on your report at the required position, and then you can set its properties using the Properties tool window. Alternatively you can select the control in the Toolbox and draw the control on the report design surface. Another method is to right-click anywhere on your report, select the Insert submenu, and select the control you want to insert.
Now take a closer look at each of these controls.
The name of the Text Box control is a little confusing because you probably immediately think of a control that the user can enter text into (which makes little sense in a report) like the Text Box control in Windows Forms and other platforms. This mental image is also backed up by its icon (which shows a textbox with a caret in it), but in fact this control is only for displaying text, not for accepting text entry. The Text Box control isn't used just for displaying static text, but can also contain expressions (which are evaluated when the report is being generated, such as data field values, aggregate functions, and formulas). Expressions can be entered directly into the textbox, or they can be created using the expression builder (discussed later in this chapter) by right-clicking the textbox and selecting the Expression menu item.
When you drag a data field onto the report, a textbox is created at that location containing a placeholder. The placeholder has an expression behind it, which will get and display the value for that field. A placeholder is essentially a way of hiding expressions in textboxes in order to reduce the report design's complexity. You could think of it like a parameterless function, which has a name (referred to as a label), and contains code (known as an expression). In the report designer the textbox will display the label instead of the (potentially long and complex) expression.
Note
If you drag a data field onto your report and it displays <<Expr>> this means it has had to create a complex expression to refer to that field (such as getting the field's value in the first row in the dataset), which is hidden behind the <<Expr>> placeholder it has created. Unless this is the behavior you are after (such showing a value in a report header or footer), it probably should be placed in a table, matrix, or a list in order to display the value of that field for each row in the dataset. If this is the behavior you are after, first click the <<Expr>> placeholder, then right-click, select the Placeholder Properties menu item, and give it a meaningful name by entering one in the Label textbox.
You can also drag a data field into an existing textbox. This will create a placeholder with an expression behind it to display the value of that field in the dropped location in the textbox. You may do this if, for example, you wanted to display the value of that field inline with some static text, or even combine the values of multiple fields in the one textbox.
Note
You can quickly create an expression to display a data field value by typing the name of the field surrounded by square brackets (for example, [EmailAddress]). This text will automatically be turned into a placeholder, with an expression behind it to display the corresponding field's value.
To create a placeholder manually, put the textbox in edit mode (where it is displaying a cursor for you to type), then right-click and select the Create Placeholder menu item. Creating placeholders and expressions is discussed in detail later in this chapter.
The format of the text in the Text Box (as a whole) can be set in a number of ways. The formatting properties for the textbox can be found in the Properties tool window, and there is also a Font tab in the Text Box Properties window for the Text Box (right-click the textbox, and select the Text Box Properties menu item). Another way is to use the formatting options found on the Report Formatting toolbar. This is the easiest way, but has another side benefit. If you select the textbox in the designer and choose formatting options from this toolbar, it will apply those formatting options to all its text. However, the text within a textbox doesn't need to be all the same format, and selecting text within the textbox and choosing formatting options using this toolbar will apply that formatting to just the selected text. Of course you can use standard formatting shortcut keys too, such as Ctrl+B for bold text, and so on.
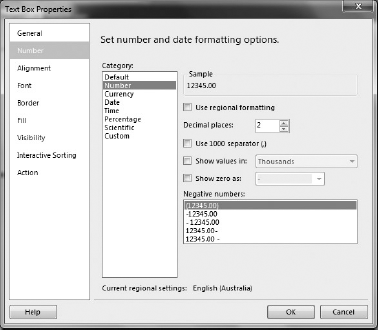
When you are displaying the value of a number or date data field you quite often need to format it for display in the report. If your textbox contains just an expression, select the textbox, right-click, select the Text Box Properties menu item, and select the Number tab (shown in Figure 30-5). Alternatively, if the textbox contains text or other field values, you can format just the value of the placeholder by selecting the placeholder in the textbox, right-clicking, selecting the Placeholder Properties menu item, and selecting the Number tab. Then select how you want the field to be formatted from the options available. If a standard format isn't available, you can select Custom from the Category list and enter a format string, or you can even write an expression to format the value by clicking the fx button.
The Line and Rectangle controls are shapes that you can use to draw on your report. The Line control is often used as a separator between various parts of a report. The Rectangle control is generally used to encapsulate an area in a report. The Rectangle control is a container control, meaning other controls can be placed on it, and when it is moved they will be moved along with it.
The Table control is used to display the data in a tabular form, with fixed columns and a varying number of rows (depending on the data being used to populate the report). In addition to the data, tables can also display column headers, row group headers, and totals rows.
By default, each of the cells in a table is a Text Box control (and thus each cell has the same features described for the Text Box control). However, a cell can contain any control from the Toolbox (such as an Image control, Chart, Gauge, and so on) by simply dragging the control from the Toolbox into the cell.
When you first drop a Table control onto your report you will see that it contains a header row and a data row, as shown in Figure 30-6.
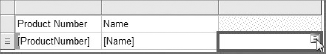
To display data in the table, drag a field from the appropriate data source in the Report Data tool window and drop it on a column in the table. You'll see that it has created a placeholder with an expression behind it to display the value of that field in the data row, and that it has also automatically filled in the header row for that column to give it a title. This header name is the name of the field, but assuming the field name follows Pascal case naming rules you will find spaces have been intelligently inserted into the name before capital letters (so the ProductNumber field will automatically have Product Number inserted as its header). If this header name isn't suitable, you can change it by typing a new one in its place.
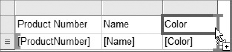
Another means of setting which field should be displayed in a column is to mouse over a cell in the data row and click the icon that appears in its top right-hand corner. This is shown in Figure 30-7. This displays a menu from which you can select the field to display in that column.
Note
If you have multiple datasets in your report and you haven't specified the dataset that is the source of data for the table, clicking this icon first requires you to drill down selecting the dataset first (before the field). The dataset selected will then be set as the source of the data for the table, and the next time you click the icon it will only display the fields from that dataset accordingly.
The table will have three columns when you drop it onto a report, but you can add additional columns by simply dragging another field from the Report Data tool window over the table such that the insertion point drawn on the table is at its right edge (shown in Figure 30-8).
You can insert a column in the table by the same means, but positioning the insertion point at the location where the column should be inserted. Alternatively, you can add or insert a new column by right-clicking on a gray column handle, selecting the Insert Column submenu, and selecting the location (Left or Right) relative to the column that is selected.
To delete an unwanted column, right-click the gray column handle and select Delete Columns from the menu.
Note
Note that tables can only contain data from a single dataset; therefore, you can't join data from multiple data sources in the one table (such as including data from an Orders data source and a Customers data source to show each order and the name of the customer that placed the order in the table). Therefore you will need to do this join in the data that you have passed to populate the report with.
You can find which dataset is the source of the data for a table by selecting it and finding the DataSetName property in the Properties tool window. You can change which data source it uses by selecting an alternative one from the drop-down list.
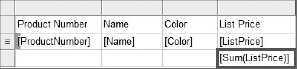
Often you will find that you need to display aggregate values at the bottom of the table, such as in a totals row. There are two ways to implement this. If you have a numeric field that you want to sum all the values in that column, right-click the cell (not the placeholder, but the entire cell) and select the Add Total menu item at the bottom of the menu (this menu item will only be enabled for numeric fields). A new row will be added below the data row to display the totals, and a SUM aggregate expression for that field will be inserted, as shown in Figure 30-9.
Because the Add Total menu item is only enabled for numeric fields, you may need to create the totals row manually (such as if you want a count of items for example). Right-click the data row's handle, and select Insert Row
If you want to change the type of aggregate function used by the total, you will need to modify the expression. Instead of manually making the change, a quicker way to do this is to select the placeholder (and not the cell), right-click, select the Summarize By submenu, and select the alternative aggregate function from the submenu.
A table can filter and sort data from the data source before displaying it. Both of these can be configured in the Tablix Properties window (right-click the gray handle area for the table and select the Tablix Properties menu item). The Filter tab enables you to specify filters (each consisting of an expression, an operator, and a value). The Sorting tab enables you to specify one or more fields to sort the data by and the sort order for each.
You may also want to group rows in a table, showing a group header between each grouping. For example, you may want to group orders by customer, and show the customer's name in the group header row (which therefore doesn't need to be displayed as a column). You can have multiple levels of grouping, enabling complex nested hierarchies to be created. Again, there are multiple ways to set the grouping for a table. One is to select the table and drag a field from the Report Data tool window onto the Row Groups pane at the bottom of the report designer above the (Details) entry already there. Another way (that gives you additional options for the grouping) is to right-click the data row's gray handle and select Add Group
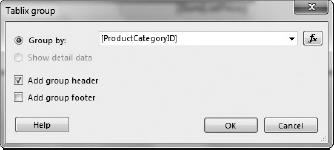
Here you can select the field or an expression to group by, and there is also the option to add a group header and/or footer row. For example, these additional options may be useful if you want to display the value of the group field in a header above the data for a group, and totals in the footer below it.
By default (even if you select to create a group header row or if there is a column displaying the group field's value) a new column will be inserted to the left of the data configured to show the value of the group field. You can safely delete this column without affecting the grouping if this is not the behavior you are after.
Note
When you add a group that has a group header row, here are some things that may improve your report layout. First delete the column it added, and then set the first cell in the group header row to display the value of the field it is grouping by. Then select all the cells in the group header row, right-click, and select the Merge Cells menu item to turn them into a single cell (enabling the grouping field's value to stretch across the columns). You may also want to add a border or background color to the group header row so it stands out.
By default there is no formatting applied to the table apart from a solid light gray border around the cells (or technically the control in each cell). Often you will want to have a border around the table, between columns, or even between individual cells. Or perhaps you want a line between the table header and the data, and/or the table footer and the data. In all of these cases the easiest way to set the borders is to select the cells to apply a border to and use the Report Borders toolbar (as shown in Figure 30-11) to set them.
Often you will also want to set a background color for the header row (and a foreground color to match). The easiest way to do this is to select the cells and use the Background Color/Foreground Color buttons from the Report Formatting toolbar to select the color to use (shown in Figure 30-12).
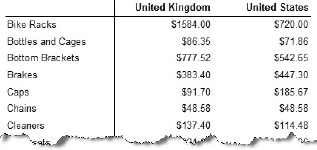
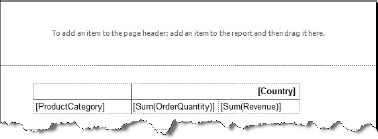
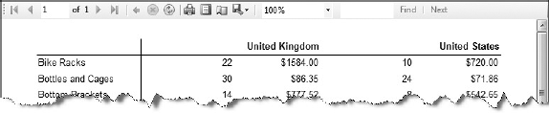
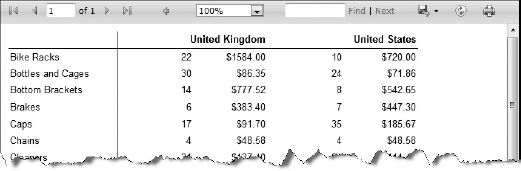
The Matrix control is used for cross-tab reports (similar to Pivot Tables in Excel). Essentially, a Matrix control groups data in two dimensions (both rows and columns), and you use it when you have two variables and an aggregate field for each combination of the two. So, for example, if you wanted to see the total sales per product category in each country, this would be the perfect control to use (see Figure 30-13). The variables would be the product category and the country, and the aggregate is the total revenue (of the products in that category to that country). Matrices are one of the most important and powerful controls in reporting, because they really help enable useful information to be extracted from raw data.
What stands out about using the Matrix control (over the Table control) is that you don't know what columns there will be at design time. Both the number of rows and columns for the matrix (and their headers) will be dictated by the data.
Note
The matrix is closely related to the Table control, and in fact both (along with the List control discussed shortly) are the same core control under the covers (called a Tablix). However, they are templated as separate controls in order to distinguish their different uses. If you were to delete the column group (and its related rows and columns), you effectively turn the Matrix control into a table.
When you drop a Matrix control on your report you will see that it contains both a column header and a row header that intersect on a data cell (as shown in Figure 30-14), and that both the Row Groups and Column Groups panes at the bottom of the designer have grouping entries (whereas the Table control only had a row grouping entry).
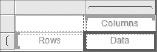
For this example, you will be using the example of displaying the total sales per product category in each country described earlier. Your data source (a collection of custom objects specifically created and populated as the source of data for this report) contains four fields: ProductCategory, Country, Revenue, and OrderQuantity. What you need to do is drag the ProductCategory field from the Report Data tool window onto the row header (marked Rows), and the Country field onto the column header (marked Columns). Then drag the Revenue field (or the OrderQuantity field — either one) onto the data cell (marked Data), and you're done! Assuming the field you are aggregating is numeric, it will have automatically applied a SUM aggregate to the Revenue field.
Note
The designer will have automatically inserted a header label into the top left-hand cell, but generally you will want to delete it.
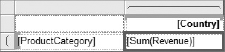
The matrix in the report designer will now look like Figure 30-15, and after adding some formatting you will get an output similar to that shown previously in Figure 30-13 when you generate the report.
Like with the Table control, you can display totals, but the Matrix control enables you to have column totals as well as row totals. When you right-click the data cell you will find that the Add Total menu item is actually a submenu (unlike the Table control), from which you can select a Row total or a Column total.
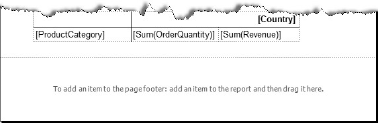
The Matrix control doesn't limit you to having just one aggregate per "intersection." For example, you may want to show both the total revenue and quantity for each country/product category. Simply drag another field to aggregate (such as the OrderQuantity field) next to the Revenue field in the matrix, and it too will appear for each country (as shown in Figure 30-16).

You can also extend the matrix to show additional "dimensions" by having multiple row or column groups. Again, simply drag the additional fields to group by into the appropriate position in the row/column grouping header area.
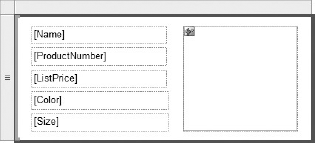
Lists are a more freeform means of displaying data than the Table and Matrix controls, and thus provide a lot of flexibility in the display of the data. If you were to drop a field directly onto a report you would find that it only displays the field's value in the dataset's first row, but the List control enables you to define a template (as shown in Figure 30-17), and enumerates through the data source, populating and displaying that template for each row (or group).
Being yet another form of the same base control used by the Table and Matrix controls, you will find that the List control shares many of the same features that they have.
The Image control is used to display an image in your report. The source of this image can be from within your project (as an embedded image resource in your project), an external image (specified by a file system path or URL), or from a database field (a blob). When you drop this control on a report, a window is displayed enabling you to set these options (and others such as its size, border, and so on) as shown in Figure 30-18.

The options that appear will depend on the source you have selected for the image from the Select the Image Source drop-down box.
If you want to show external images (for example, from a file path) there are two things you must note. You must add a protocol prefix to the location you specify (for example, file://, http://, and so on), and you must also set the EnableExternalImages property on the LocalReport object to true because this is not enabled by default.
reportViewer.LocalReport.EnableExternalImages = true;
The Subreport control is used as a placeholder where the contents of another report can be inserted into this report (enabling complex reports to be created). This is discussed in detail later in this chapter.
Charts provide a much more visual representation of data, enabling patterns and anomalies in the data to be easily identified.
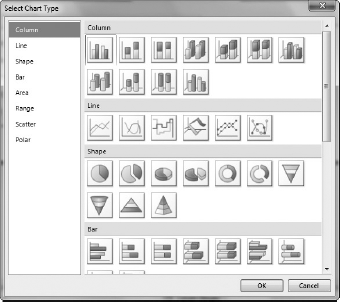
When you drop a Chart control onto a report it will immediately open the Select Chart Type window (as shown in Figure 30-19), allowing you to select from a wide range of available chart types.
You can always change the type of chart at a later point by right-clicking it and selecting the Change Chart Type menu item.
Double-clicking a chart will (like other controls) put it into edit mode (as shown in Figure 30-20), and you will find it consists of a number of sub-controls. Depending on the type of chart you choose it will have different controls arranged on its surface. All chart types, however, have a title and legend in addition to the chart itself. You can rearrange these components (or delete them) as you see fit.
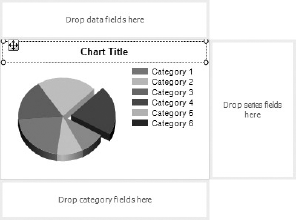
Charts consist of categories, series, and data — each essentially representing an axis. Categories are used to group data, data specifies the source of the values to display, and series add additional "dimensions" that will be determined when the report is generated (the same concept upon which the Matrix control works). For simple charts you will just configure the categories and data axes, and more complex charts will use the series axis also.
When the chart is in edit mode it displays drop zones (one for each axis) alongside the chart, upon which you can drop the fields that each should use. For more advanced charts you can drop multiple fields in each drop zone for multiple groupings/value displays.
Using the same source of data that you used when generating the matrix report, you will start by generating a simple bar chart (the total sales per product category). Drop the Chart control onto the report, set it to be a 3-D Clustered Bar chart, and double-click it to put it into edit mode. Drop the ProductCategory field onto the Category zone, and the Revenue field onto the Data zone. Change the chart and axes titles as you see fit, and another thing you will want to do (in order to show a label for every product category) is to right-click the vertical axis, select Axis Labels from the menu, and change the Interval from Auto to 1. Now when you generate the report you will get an output similar to Figure 30-21.
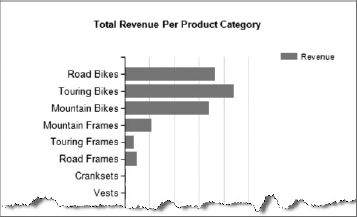
Note that currently the legend is of no real value, because in a bar chart it is designed to show the series group values (which you aren't using in this chart).
Now generate a chart that works much like the Matrix control, by setting the series grouping to add an additional dimension to your previous chart (so that it now displays the total quantity of sales for each product category per country). Drag the Country field onto the Series zone and run the report again. Now you will have the total sales for each product category split out per country, as shown in Figure 30-22.
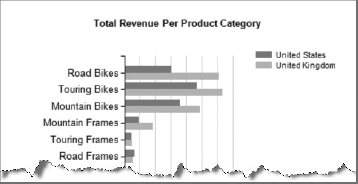
Note how the legend now shows which bar color represents each country, because you are now making use of the series axis.
The Gauge control is yet another means of visually representing the data. Gauges are generally designed to display a single value (although some gauges can each display a fixed number of separate values). This can be quite useful in displaying Key Performance Indicators (KPIs), for example.
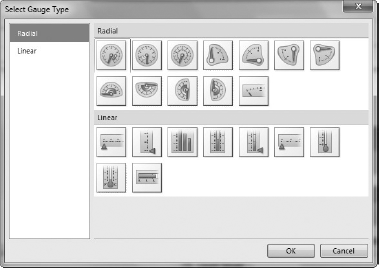
When you drop a Gauge control onto a report it immediately opens the Select Gauge Type window, as shown in Figure 30-23, allowing you to select from a number of different linear and radial gauge types.
Note
Note that, unlike the Chart control, you cannot change the type of gauge once it has been created.
For this example you will use the Radial with Mini Gauge gauge. When you put the gauge into edit mode (by double-clicking it) it displays a drop zone above it (as shown in Figure 30-24), which will have one or more field placeholders (depending on how many values the gauge can display). Your selected gauge can display two values (one in the main gauge and one in the mini gauge), so it will have two field placeholders. When you drop a field from the Report Data window onto a field placeholder, you will note that it automatically applies an aggregate because it is only displaying a single value in its related gauge. Numeric fields will automatically have a SUM aggregate applied, and other fields will have a COUNT aggregate applied.

Gauges have a fixed scale, and you must specify the minimum and maximum values that it will display. The nature of the Gauge control means that it won't automatically determine these values. To change these values you will need to select the scale itself (as shown in Figure 30-24), then right-click and select Scale Properties from the menu. This brings up the window shown in Figure 30-25.
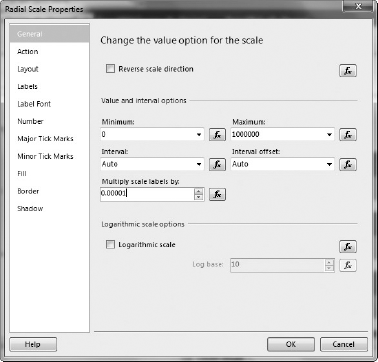
Your example will have expected values of up to 1 million, so you will set that as your maximum value. You will leave the interval options to be automatically determined (this will alter which scale labels are displayed), although you can change these if the output is not as you desire. When dealing with very small or very large values (as you are with this example), it may be useful to set the value of the Multiply Scale Labels By option. Instead of showing large numbers on the intervals, you can set that the value labels be multiplied by 0.00001, meaning that it will display 1 instead of 100000, 2 instead of 200000, and so on (making for a much less cluttered gauge). In this case it would be important to add a label to the gauge (right-click it and select Add Label from the menu) showing the multiplier that should be used with the label values to get the real value being represented.
You can also add one or more ranges to your gauge. For example, you might want to indicate that a range of values is acceptable by shading an area under the scale green, and shade another area red indicating the value should be of concern. Right-click your gauge and select Add Range from the menu. This automatically inserts a range into your gauge — to configure it right-click and select Range Properties from the menu. From this window you can enter at what values the range should start and end, and you will most likely (depending on your needs) want to change the start and end width of the range (generally so they are the same value). From the Fill tab you can change the color of the range to match its meaning (generally green = good, red = bad).

The final output of your gauge is shown in Figure 30-26.
Expressions provide the flexibility and power in your report, and are used everywhere from getting a value from a dataset, aggregating data, transforming data, and performing calculations, through to decision-making processes using conditional statements (IIF, and so on). Anything dynamically inserted into the report when it is being generated is handled by an expression. You might think of expressions as a formula that returns a value. Almost everything in a report can be controlled by an expression, including most control properties. So far you've already seen the expressions generated when you drag a field onto the report, and how the expression is "hidden" behind a placeholder, which can be used to hide its complexity. All expressions start with an equals (=) sign and return a single value.
Expressions can be categorized into simple expressions and complex expressions. Simple expressions refer only to a single field, which may have an aggregate function applied. Simple expressions will display a simplified version of the underlying expression as the label of the placeholder when displayed in the report designer. An example of a simple expression is:
=Fields!Revenue.Value
This will display in the report designer simply as [Revenue].
Complex expressions, however, either reference multiple fields or include operators, and appear in the report designer with <<Expr>> as their default placeholder label (although this can be changed in the placeholder properties to something more meaningful). Complex expressions essentially use VB for their syntax, although they still must consist of only a single line of code that returns a value. They can, however, make calls to more complicated multiline functions if necessary, as will be discussed in the next section. An example of a complex expression is:
=Fields!ProductCategory.Value + " sold to " + Fields!Country.Value
Now take a look at the process of creating an expression. As previously noted, when you drop a field onto a report it creates an expression that returns the value of that field from the dataset. To see this in action, drop a table on a report and then drop a field from the Report Data window into one of its cells. As discussed earlier in the chapter, what is being displayed in the cell is a placeholder label. When you right-click the placeholder you can select Expression from the menu to view and edit its underlying expression. This displays the Expression Builder window as shown in Figure 30-27.
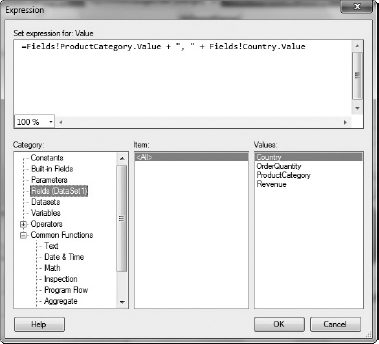
As its name might suggest, the Expression Builder helps you build expressions. At the top is the code area where you can type in the expression, and below it is the category tree, category items list, and a values list (which is only shown when values are available). The code area supports IntelliSense, tooltips (displaying function parameters), and syntax checking (squiggly red underlines to show errors), although unfortunately it doesn't support syntax highlighting. The lower "builder areas" help you build an expression, which is especially helpful when you don't know the syntax or what functionality is available. The Category tree allows you to drill down to select a category (such as a dataset, an operator type, a function type, and so on). The Item list displays what is available in that category, and the Values list (if values are available) displays the values for that item. For functions and operators it will display some helpful information on the selected item (what it does and examples of how it is used) in place of the Values list.
You will note when you are creating a report that many properties have an fx button next to them (in the dialog windows), or an Expression entry (in their drop-down list in the Properties tool window). This means that those properties can have expressions assigned to determine the value that should be applied to them, and clicking this button or selecting this item from the drop-down list will open the Expression Builder window in which you can create an expression to control the value of that property. This is extremely useful in conditional formatting scenarios, such as toggling the visibility or color of a control based upon the data being displayed.
Note
In conditional formatting scenarios you will find the IIF function (Inline If) very useful to choose between two values based upon the result of a given expression (with the result being applied as the value of the property). Other "program flow" functions that you will find useful are the Choose and Switch functions.
Sometimes you want to use a calculated value in multiple places in a report, and rather than have the report recalculate the value multiple times, you'd like to calculate it once and reuse the value (speeding up the generation of the report in the process). This is where variables can be useful. Being named variables you may think that you can change their values (such as using them in a running totals scenario), but unfortunately that isn't the case. Their value can only be set once, and then this value is used from that point on without it needing to be recalculated.
Note
Running totals are actually implemented in a report using the RunningValue function (built into the reporting engine) in an expression.
There are two types of variables: report variables and group variables, with their name matching their scope. The value of report values are set in the Report

The variables defined here will be available anywhere in the report. A new entry will be created when you click the Add button, where you can give the variable a name and a value. If it's a constant value you can specify its value there, or you can click the fx button to create an expression that calculates the value. This calculation will only be performed once, and the value will be reused on subsequent references of the variable.
Note
The variables that are available to an expression can be found in the Expression Builder under the Variables category.
So if you've created a variable called testVar, you can use it in an expression like so:
=Variables!testVar.Value
Another use for report variables is to define constant values for use in your report, enabling you to centrally define values that are used in multiple places in your report without "hard coding" them in those places.
The other type of variable is the group variable. This works in much the same way as the report variables, except the scope of the calculated value is just the current grouping in a Table/Matrix/List control (and any child groupings). Its value is calculated each time the grouping changes, so if you have a calculation to make for each grouping (whose value is reused throughout that grouping), this is how you would implement it. To create a group variable, open the Group Properties window, go to the Variables tab, and then create and use the variable in the same way as demonstrated for the report variable. You can test the behavior of how the calculated value is reused and subsequently recalculated when the group changes by creating the following expression and seeing when its output changes:
=Round(Rnd() * 100)
Sometimes the built-in functions of the reporting engine are not enough to suit your purposes. When you need a complex multiline function to perform a calculation or make a decision, this must be written outside the expression builder (because expressions can only exist on a single line). You have two ways to achieve this: by embedding the code in the report itself, or by referencing an external .NET assembly that contains your custom functions. You can set up both of these options at the report level from the Report
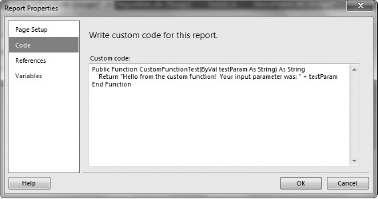
When you select the Code tab you will see what is shown in Figure 30-29 (a custom function is already entered for demonstration).
As you can see, this is a very sparse code editor. There is no syntax highlighting, error checking, or IntelliSense, so it isn't very friendly to use. If there is an error in your code it will be caught when the project is compiled and the compilation will fail (pointing out the cause of the error in the Error List tool window). After you've written your functions in here (using VB as the language) you can add a textbox to your report, open the expression builder, and call them like so:
=Code.CustomFunctionTest("Test Input")Note
Note that the IntelliSense in the expression builder doesn't show the available function names when you type Code. in the editor, nor does it show what parameters the function takes. In addition, the only assemblies automatically referenced for use are the System.Convert, System.Math, and Microsoft.VisualBasic — if you need to use assemblies other than these you will need to add references to them in the References tab, which is discussed shortly.
Calling the function shown in Figure 30-29 with this expression displays the following in the textbox:
Hello from the custom function! Your input parameter was: Test Input
If you want to reuse the custom functions among multiple reports you are better off writing the code in a .NET assembly, and referencing it from each report that requires its functions. You can create a Class Library project, write the code (in either VB or C#), and then reference it in your report. Unfortunately, you will face a few difficulties in ensuring that the report can find the assembly and configuring its code access security settings so that the report has the permissions to execute its functions — so it's not a completely straightforward process. However, you are about to walk through the process required to get it working here.
Create a new project using the Class Library template called CustomReportingFunctions. Create a class called MyFunctions, and add the following function to it:
- VB
Public Shared Function CustomFunctionTest(ByVal testParam As String) As String Return "Your input parameter was: " + testParam End Function- C#
public static string CustomFunctionTest(string testParam)
{
    return "Your input parameter was: " + testParam;
}
You will also need to add the following attribute to the assembly to enable it to be called by the reporting engine. This is added to AssemblyInfo.vb for VB developers (under the My Project folder, requiring the Show All Files option to be on in order to be seen), and to AssemblyInfo.cs for C# developers (under the Properties folder).
- VB
<Assembly: System.Security.AllowPartiallyTrustedCallers>
- C#
[assembly: System.Security.AllowPartiallyTrustedCallers]
In order for the report to find the assembly, it must be installed in the Global Assembly Cache (GAC). This means you need to give the assembly a strong name, by going to the Properties of the custom functions assembly, opening the Signing tab, checking in the Sign the Assembly checkbox, and choosing/creating a strong name key file. Now you can compile the project, and then install the assembly in GAC by opening the Visual Studio Command Prompt, entering
gacutil -i <assembly_path>
and replacing <assembly_path> with the actual path to the compiled assembly.
Note
Each time you update this assembly, remember to install it into the GAC again.
Now you can reference the assembly in the report. Open up the Report Properties window and go to the References tab (as shown in Figure 30-30). Click the Add button, then click the ellipsis button on the blank entry that appears. Find the assembly (you may need to browse by file to find it) and click OK.
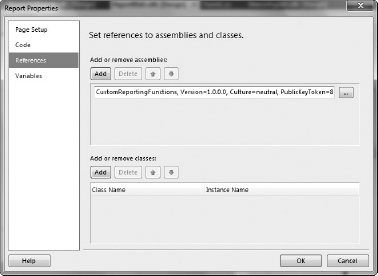
Note the Add or Remove Classes area below the Add or Remove Assemblies area. This is used to automatically create instances of classes in the referenced assemblies. You made your function shared (or static as it is referred to in C#) so you don't need an instance of the MyFunctions class. However, if the function was not shared/static and you needed a class instance you need to configure these instances here (because a class cannot be instantiated in an expression). To do this, specify the class name (including its namespace) and give it an instance name (that is, the name of the variable that you will use in your expressions to refer to the instance of the class). The reporting engine will handle instantiating the class, and will assign the reference to a variable with the given name so you can use it in your expressions.
Now you are ready to reference your function in an expression, although slightly differently from how you used the function when it was embedded in the report. You need to refer to the function by its full namespace, class, and function name. For example:
=CustomReportingFunctions.MyFunctions.CustomFunctionTest("Test Input")You are almost done, but not quite. The final piece of the puzzle is to specify that the assembly should be run with full trust in the domain of the report engine. This is done when initiating the report rendering process (which is covered later in this chapter) and requires the strong name of the assembly.
- VB
Dim customAssemblyName As String = "CustomReportingFunctions, Version=1.0.0.0, " & "Culture=neutral, PublicKeyToken=b9c8e588f9750854" Dim customAssembly As Assembly = Assembly.Load(customAssemblyName) Dim assemblyStrongName As StrongName = CreateStrongName(customAssembly) reportEngine.AddFullTrustModuleInSandboxAppDomain(assemblyStrongName)- C#
string customAssemblyName = "CustomReportingFunctions, Version=1.0.0.0, " +
                             "Culture=neutral, PublicKeyToken=b9c8e588f9750854";

Assembly customAssembly = Assembly.Load(customAssemblyName);
StrongName assemblyStrongName = CreateStrongName(customAssembly);
reportEngine.AddFullTrustModuleInSandboxAppDomain(assemblyStrongName);
There are two things you will note from this code. The first is that you are loading the custom assembly from the GAC using its name (in order to obtain its strong name so you can notify the reporting engine that it's trusted), including its version, culture, and public key token. This string can be obtained by copying it from where you added the assembly reference to the report in its Report Properties dialog box.
The second is the use of the GetStrongName function to return the StrongName object, the code for which is below:
- VB
Private Shared Function CreateStrongName(ByVal assembly As Assembly) As StrongName
    Dim assemblyName As AssemblyName = assembly.GetName()

    If assemblyName Is Nothing Then
        Throw New InvalidOperationException("Could not get assembly name")
    End If

    ' Get the public key blob
    Dim publicKey As Byte() = assemblyName.GetPublicKey()

    If publicKey Is Nothing OrElse publicKey.Length = 0 Then
        Throw New InvalidOperationException("Assembly is not strongly named")
    End If

    Dim keyBlob As New StrongNamePublicKeyBlob(publicKey)

    ' Finally create the StrongName
    Return New StrongName(keyBlob, assemblyName.Name, assemblyName.Version)
End Function
- C#
private static StrongName CreateStrongName(Assembly assembly)
{
    AssemblyName assemblyName = assembly.GetName();

    if (assemblyName == null)
        throw new InvalidOperationException("Could not get assembly name");

    // Get the public key blob
    byte[] publicKey = assemblyName.GetPublicKey();

    if (publicKey == null || publicKey.Length == 0)
        throw new InvalidOperationException("Assembly is not strongly named");

    StrongNamePublicKeyBlob keyBlob = new StrongNamePublicKeyBlob(publicKey);

    // Finally create the StrongName
    return new StrongName(keyBlob, assemblyName.Name, assemblyName.Version);
}
Now when you run the report you will have the same output as when you embedded the code in the report, but in a more reusable and maintainable form.
Generally reports are produced in order to be printed, therefore you must consider how the printed report will look in your report design. The first thing to ensure is that the dimensions of your report match the paper size that it will be printed on. Open the Report Properties window via the Report
Many reports tend to extend beyond one page, and it can be useful to show something at the top and bottom of each page to show which company and report it belongs to, and where that page belongs within the report (in case the pages are dropped, for example). So far you have been dealing just with the body of the report, but you can add a page header and footer to the report to use for these purposes. Page headers tend to be used for displaying the company logo, name, and information about the company (like a letterhead). Page footers tend to be used to display page numbers, the report title, and perhaps some totals for the information displayed on that page.
Add a page header to your report via the Report
Adding a page footer is much the same process. Select the Report
You can use the built-in report fields to display information such as the page number, number of pages, report name, the time the report was generated, and so on, which can be used anywhere in your report. You can find them in the Report Data tool window, under the Built-in Fields category.
Note
The value for the Report Name field is retrieved from the filename of the report with the extension removed.
Generally you will want to show the page numbers in the form as Page 1 of 6. However, the page number and page count fields are separate, so it's best to drop a textbox in the footer and drop both fields in that:
Page [&PageNumber] of [&TotalPages]
The values in the square brackets will automatically turn into placeholders with the correct expressions behind them (the & specifies that these are global variable references) that get the values from the built-in fields. You can alternatively drag these fields from the Report Data tool window into the textbox and add the static text in between.
Note
Be careful that you don't remove the page header or footer once you've created it (by selecting Remove Page Header or Remove Page Footer from the Report menu) because this will delete the content of the header/footer and adding it back again won't restore its content. There is no warning displayed when you do this, so if you do so by accident use the Undo function to restore it to its previous state.
One question you may now have is how to create report headers and footers (that only appear on the first/last page of the report, rather than each page). An example of a report header would be to display the title of the report and other report information at the top of the report (on the first page only), and an example of a report footer would be to display some totals at the end of the report (on the last page only).
The report designer doesn't support report headers/footers as special areas of the report in the same way it does for page headers/footers because you can simply include them in the body of the report. By putting the report header content at the top of the body of your report it will only display once, then it will display the content (which may expand to cover multiple pages), and finally at the bottom of your report you can put the report footer content. The only issue to deal with is that you won't want the page header on the first page of your report (because you will only want the report header), and you won't want the page footer on the last page (because you will only want the report footer). To do this, right-click your report header and select Header Properties from the menu. From the General tab (which will be the one selected), uncheck the Print on First Page checkbox. The process is much the same for the page footer: right-click your report footer, select Footer Properties from the menu, and then uncheck the Print on Last Page checkbox.
The final thing you must consider with your report layout is where the page breaks will occur. For example, you may want a table to appear all on the same page where possible rather than half on one page and half on another. Or perhaps you have its data grouped, and you want each group to start on a new page. You can do this by setting page break options on the controls that support them (Table, Matrix, List, Rectangle, Gauge, and Chart). Each of these controls has the PageBreak property (select the control in the report designer and find the property in the Properties tool window). This gives you the option to start a new page before it displays the control, after it displays the control, or both before and after it displays the control. You can set KeepTogether to true so that if the output of the control stretches across two pages it will attempt to display it all on the one page by starting it on the next page instead. When you are grouping data in a table, matrix, or list, you can also set the page break options for the group. When you view the properties of a group (right-click the group in the Row Groups pane at the bottom of the designer and select Group Properties from the menu) you will note a Page Breaks tab. Here you can select whether there should be a page break between each group, and you can also select whether there should be an additional page break before and/or after each group.
Subreports is a feature that enables you to insert the contents of one report into another. You can insert the contents (excluding headers and footers) of any report into another by adding a Subreport control to your main report and setting its ReportPath property to the path of the other report to display in that area. By merging a number of reports into a single output report you are able to create quite complex report structures. Other uses of subreports include creating master-detail reports, drill-down reports, and splitting reports into predefined "components" that can be used by multiple reports — enabling each component to be defined once and used multiple times. This also has the advantage that changes can be made in a single place and automatically picked up by the other reports (such as a standard report header with company information, used by all the reports).
First look at a scenario where the contents of the subreport are not linked to the "master" report. Create a new report, and simply put a textbox on it with some text. Now add a Subreport control to your main report, and set the ReportName property to the filename of the other report (but without the extension).
Note
Unfortunately the report to be used as the subreport must be located in the same folder as the main report.
When you run the project and view the report you will see that the contents of the subreport are merged into the main report.
Getting a little more complicated now, hook up a data source to the subreport and show some data in it (in a standalone fashion from the main report). The issue now is, because the data sources aren't shared between the main report and the subreport, how do you pass the data to that report? You do this by handling the SubreportProcessing event on the LocalReport object in the code that configures the Report Viewer control (discussed in full later in this chapter). You will need to add an event handler for this event like so:
- VB
AddHandler reportViewer.LocalReport.SubreportProcessing, AddressOf ProcessSubreport
- C#
reportViewer.LocalReport.SubreportProcessing += ProcessSubreport;
and add a function for this event handler that adds the data to the SubreportProcessingEventArgs object passed in as a parameter (including the name of the dataset), like so:
- VB
Private Sub ProcessSubreport(ByVal sender As System.Object, ByVal e As SubreportProcessingEventArgs) e.DataSources.Add(New ReportDataSource("DataSetName", data)) End Sub- C#
private void ProcessSubreport(object sender, SubreportProcessingEventArgs e)
{
    e.DataSources.Add(new ReportDataSource("DataSetName", data));
}
When you run the project now the subreport will be populated with data.
Now take a look at the slightly more complex scenario where what is displayed in the subreport is dependent on data in the main report. Say, for example, the main report is displaying the details of each customer, but you also want to show the orders each customer made in the last month underneath their details using a subreport. So that the subreport knows which customer to retrieve the order details for, you need to make use of Report Parameters.
Note
Note that there are a lot of overheads in implementing this scenario in this way. There will be multiple calls to the database — one for each customer to return their order details, which will put strain on the database server. A better, more efficient way for this scenario would be to return a joined customer details + orders dataset from the database, and use the Table control to group by customer and display their order details. However, this scenario is just used as an example of how to pass information from the main report to subreports.
Create a report (which will be the main report) to display the details of each customer (in a list), and another report (the subreport) that displays the orders that a customer has made. Under the customer details fields (but still in the list), add a Subreport control that points to the subreport you created, and hook up the code-behind as previously described. What you will note is that when handling the SubreportProcessing event to return the order details data to the subreport, you need to know which customer to return the data for (the subreport will be rendered for each customer, therefore this event handler will be called to return the order details for each customer). This is where you need to create a Report Parameter for the subreport that the main report will use to pass the current customer's ID to it.
To add a new parameter to the subreport, go to the Report Data tool window, right-click the Parameters folder, and select Add Parameter from the menu. Create the parameter with CustomerID as its name, and set its data type to Integer.
Back on the main report, select the Subreport control in the designer, right-click and select Subreport Properties from the menu, and go to the Parameters tab. Click the Add button, specify CustomerID as the parameter name, and enter [CustomerID] as its value. Now each time it renders the subreport, it will pass it the current value of the customer ID field.
The final thing to do is retrieve the value of that parameter in your ProcessSubreport event handler, and filter the results returned accordingly, like so:
- VB
Private Sub ProcessSubreport(ByVal sender As System.Object, ByVal e As SubreportProcessingEventArgs) Dim customerID As Integer = Convert.ToInt32(e.Parameters("CustomerID").Values(0)) Dim fromDate As DateTime = DateTime.Today.AddMonths(-1) Dim qry = From co In context.SalesOrderHeaders Where co.CustomerID = customerID AndAlso co.OrderDate > fromDate Select co e.DataSources.Add(New ReportDataSource("OrderData", qry)) End Sub- C#
public void ProcessSubreport(object sender, SubreportProcessingEventArgs e)
{
    int customerID = Convert.ToInt32(e.Parameters["CustomerID"].Values[0]);
    DateTime fromDate = DateTime.Today.AddMonths(-1);

    var qry = from co in context.SalesOrderHeaders
              where co.CustomerID == customerID && co.OrderDate > fromDate
              select co;

    e.DataSources.Add(new ReportDataSource("OrderData", qry));
}
The easiest place to start when designing a report is to make use of the Report Wizard. The Report Wizard leads you through all the main steps to generate a report, and based upon your input will generate the report for you that you can then customize to your needs.
The Report Wizard takes you through the following steps:
Choosing/creating a data source: Enables you to select an existing data source or create a new one as the source of data for the report. This step is exactly the same as was detailed earlier in the "Defining Data Sources" section of this chapter.
Arranging fields: Drag fields into the Values list to create a simple table, add fields in the Row Groups list to group the rows of the table by those fields, and add fields to the Column Groups list to group the columns by those fields (which will turn it into a matrix).
Choose the layout: Gives you the option to add subtotals and grand totals rows/columns.
Choose a style: Allows you to choose different colors and styles used in the output. If you want to create your own color scheme you can do so by modifying the
StyleTemplates.xmlfile in theC:Program FilesMicrosoft Visual Studio 10.0Common7IDEPrivateAssemblies1033folder on your machine (this path may differ on your machine based upon where Visual Studio has been installed).
To start the Report Wizard you will need to create a new report file (you cannot use the Report Wizard on an existing file or after it has already been run). Add a new item to your project, and from the Reporting subsection add a new Report Wizard item.
The Report Wizard takes you through its series of steps to generate a basic report. Once you have completed the steps, it generates the report and opens it in the report designer for you to modify as required.
Note
This is a great place to start when learning how to design reports, and when you become more familiar and comfortable with the process and designing more complicated reports you will find yourself using it less and less.
Now that you have designed your report, it's time to actually generate it by populating it with data. This is where the Report Viewer control is used, because it contains the local engine for generating the report from the report definition files and the data sources.
There are two versions of the Report Viewer control: one for use in web applications and one for use in Windows applications. However, the way you use them to generate and display reports is virtually identical.
The Windows version of the control is shown in Figure 30-33.
The Report Viewer contains a toolbar with various functions (such as Refresh, Export, Print, and so on), and a view of the report (page by page). Individual functions on this toolbar can be turned off via properties on the Report Viewer control, and each raises an event when clicked (although the corresponding behavior is performed by the Report Viewer control automatically unless cancelled in the event handler).
To use the Report Viewer control in your Windows Forms project, simply drop it on your form from the Toolbox.
The web version also looks quite similar (shown in Figure 30-34), but displays the report output in a browser.
To use the web version of the Report Viewer control, you can drop it on a page from the Toolbox (in the Reporting tab). This adds a namespace prefix (rsweb) for the Microsoft.ReportViewer.WebForms assembly/namespace, and the following tag to use the Report Viewer control:
<rsweb:ReportViewer ID="reportViewer" runat="server" />
The web version of the Report Viewer control also requires a Script Manager to be on the page. If you don't have one on the page already, drag this from the Toolbox (under the AJAX Extensions tab) and onto the page.
When you display a report in the web version of the Report Viewer control you will find that it displays a Print button on the toolbar only in Internet Explorer (IE), and not in other browsers such as Firefox. This is because, in order to print the report from the browser, the Report Viewer needs an ActiveX control to do the printing and ActiveX controls only work in IE. Because printing can't be done from other browsers the Print button won't be displayed. When you click the Print button in IE the first time it will ask you for permission to install the ActiveX control.
The process of generating a report is essentially to tell the report engine which report definition file to use, and pass it the data (objects, entities, data tables, and so on) to populate the report with.
By default the report definition file is embedded into the assembly, although it often is best to have it as a separate file so it can be easily updated when necessary without having to recompile the assembly. However, embedding it into the assembly means that there are fewer files to distribute, and it may in some circumstances be preferable that the report definition file cannot (easily) be tampered with. Set the Build Action on the report definition file to Embedded Resource in order for it to be embedded in the assembly (which is the default value), or otherwise set it to be Content.
The following code is what is required to generate a report from a file-based report definition file and populate it with some data (the data variable contains a collection of entities from the Entity Framework model, which is used to populate the CustomerData data source in the report):
- VB
Dim reportEngine As LocalReport = reportViewer.LocalReport reportEngine.ReportPath = "CustomerReport.rdlc" reportEngine.DataSources.Add(New ReportDataSource("CustomerData", data)) reportViewer.RefreshReport() 'Only for Windows Report Viewer- C#
LocalReport reportEngine = reportViewer.LocalReport;
reportEngine.ReportPath = "CustomerReport.rdlc";
reportEngine.DataSources.Add(new ReportDataSource("CustomerData", data));
reportViewer.RefreshReport(); // Only for Windows Report Viewer
Here you get the existing LocalReport object from the Report Viewer control, assign values to its properties, and then use the RefreshReport function on the Report Viewer control to start the report engine generating the report.
If you have chosen to embed the report in your assembly, then instead of setting the ReportPath property on the LocalReport object you will need to set the ReportEmbeddedResource property instead. This must be the qualified resource path (which is case sensitive), including the namespace and the extension of the report like so:
- VB
reportEngine.ReportEmbeddedResource = "Chapter30Sample.CustomerReport.rdlc"
- C#
reportEngine.ReportEmbeddedResource = "Chapter30Sample.CustomerReport.rdlc";
If you have one or more subreports in your report you will also have to handle the SubreportProcessing event of the LocalReport object as was demonstrated when discussing the Subreport control. If you are using custom assemblies, you will need to include the code to specify that the custom assembly is trusted. In addition, you may need to set the properties on the LocalReport object to enable the report to use external images, hyperlinks, and so on. However, the code provided here is the core code required to generate a report and display it in the Report Viewer control.
It's not necessary to display a report in the Report Viewer control. In some instances you may want to generate the report and e-mail it as a PDF without any user interaction, or return a PDF'd report as a result of a web service call. The Report Viewer control enables you to export the report to various formats (Excel, PDF, Word, and so on) as an option on its toolbar, and this can also be done via code. This is possible by creating a LocalReport object, setting the required properties, and then using the Render function on the LocalReport object to render it to a specified format (which is output to a stream or byte array).
The Render function has a number of overloads, but the simplest one to use is to just pass it the output format (in this case PDF) and it will return a byte array containing the report. For example:
- VB
Dim reportOutput As Byte() = reportEngine.Render("PDF")- C#
byte[] reportOutput = reportEngine.Render("PDF");
The report engine can generate the report in a number of formats. Valid values include:
PDF: Output to an Adobe Acrobat file
Word:- Output to a Microsoft Word document
Excel: Output to an Microsoft Excel spreadsheet
Image: Output to a TIFF image file
To output to a stream (such an HTTP Response stream or a file stream) you can turn the bytes into a stream:
- VB
Dim stream As MemoryStream = New MemoryStream(reportOutput)
stream.Seek(0, SeekOrigin.Begin)
- C#
MemoryStream stream = new MemoryStream(reportOutput);
stream.Seek(0, SeekOrigin.Begin);
Alternatively, for larger reports (where this may be too memory-intensive) you can write directly to a stream from the Render function using one of its overloads, passing in a callback function that creates and returns the stream to write to as the value for the createStream parameter:
- VB
Private Function CreateReportFileStream(ByVal fileName As String, ByVal extension As String, ByVal encoding As Encoding, ByVal mimeType As String, ByVal willSeek As Boolean) As Stream Return New FileStream(fileName & "." & extension, FileMode.Create) End Function- C#
private Stream CreateReportFileStream(string fileName, string extension,
                                 Encoding encoding, string mimeType, bool willSeek)
{
    return new FileStream(fileName + "." + extension, FileMode.Create);
}
Then you can call the render function like so:
- VB
Dim warnings As Warning() = Nothing reportEngine.Render("PDF", Nothing, AddressOf CreateReportFileStream, warnings)- C#
Warning[] warnings;
reportEngine.Render("PDF", null, CreateReportFileStream, out warnings);
Now that you've designed your report you can deploy it to users as a part of your application. However, the Report Viewer control is not a part of the .NET Framework, and thus it needs to be installed separately. A search for "Report Viewer redistributable" on the Web should help you find the installer for the Report Viewer assemblies.
An alternative is to simply distribute the Report Viewer assemblies that you have referenced with your application. Note, however, that this won't include the .cab installer for the ActiveX control that, when using the web report viewer control in web applications, will enable reports to be printed (in IE only). If this is a feature you require in your application then it's best to use the Report Viewer redistributable installer instead.
In this chapter you've seen how to use Visual Studio's report designer to design a report, populate it with data, and display the output to the user. Unfortunately, reporting is an incredibly complex topic, and it is impossible to cover it completely and go through every option available in one chapter. Hopefully this has been a good introduction to the topic, however, and will guide you in the right direction for designing your own reports.