
Testing web and windows applications
Identifying relationships between code and tests
Planning, executing, and coordinating testing tasks
Managing test environments
You can test an application in many ways. Chapter 11 introduced the concept of unit tests, which are small executable pieces of code that verify a particular aspect of behavior for a single method or class. The first part of this chapter examines the advanced tools built into Visual Studio that are available for other testing tasks, including testing web applications and databases. You also learn how to track the relationships between tests and code.
The 2010 release of Visual Studio also contains a new product called Test and Lab Manager. This tool is designed for testers to interact directly with Team Foundation Servers and manage test plans, suites, and cases. Test and Lab Manager is available with the Ultimate edition of Visual Studio and as a part of a separate pack called Test Elements.
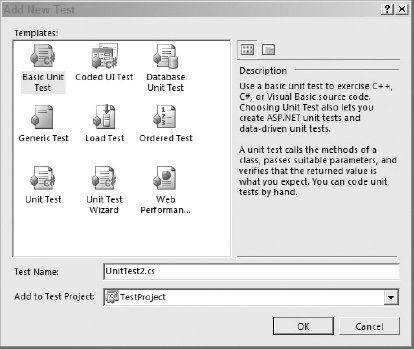
An automated test is a piece of code that verifies the behavior of your application without any user input or control. Once the system has been asked to run an automated test, it can be left unattended until it has completed. To create a new automated test from Visual Studio 2010, use the Test
Note
Depending on which edition of Visual Studio you have, you might not have all of the tests shown in Figure 56-1. Coded UI Tests and Database Unit Tests are only available in the Premium and Ultimate editions. Web Tests and Load Tests are only available in the Ultimate edition. The rest of the automated tests are available in all three editions.
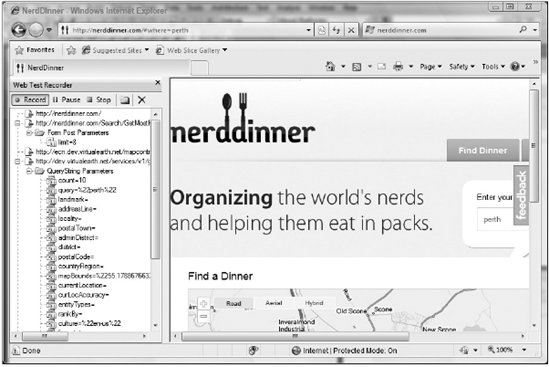
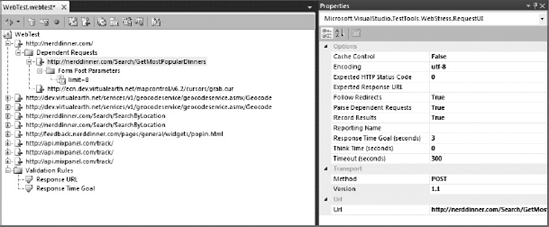
This type of automated test simulates web requests and allows you to inspect the responses and evaluate different conditions to determine if the test passes. When you create a new Web Test, Internet Explorer opens with the Web Test Recorder enabled, as shown in Figure 56-2. Navigate to and around your site as if you were a normal user. Once done, simply click Stop. This opens the Web Test's designer shown in Figure 56-3. There you can customize your test, adding validation and extraction rules, context parameters, comments, data sources, and calls to other Web Tests, or inserting transactions. You can also specify response time goals for requests.
You will often need to run the same set of tests against different web servers; to do this you configure which server the test runs against as a context parameter. From the Web Test Designer you can right-click the main node and select Parameterize Web Servers. Visual Studio will inspect the URLs in each request and determine the context parameters it will need to create.
You can link your requests using the output from one of them as input for the next; to do this, you add extraction rules to a specific request. You can extract from fields, attributes, HTTP headers, hidden fields, and text, or even use regular expressions. The result of an extraction will set a context parameter, which can then be used, for example, as a form or query string parameter in further requests. You could add a product and then search for it using the ID in another request.
You can add form and query string parameters from the context menu of a request. By selecting a form or query string parameter from the properties window, you can set its value to a context parameter or bind it to a data source.
No test framework would be complete without validations. When you record a test, a Response URL Validation Rule is added asserting that the response URL is the same as the recorded response URL. This is not enough for most scenarios. From the context menu at a Web Test or request level, you can add validation rules. You can check that a form field or attribute has a certain value or that a particular tag is included, find some text, or ascertain that the request doesn't take more than a specified length of time.
Double-clicking the .testrunconfig file in Solution Explorer allows you to further customize how Web Tests are run. There you can choose the number of iterations, the browser and network type, and whether the test engine should simulate think times. You can have many Test Run Configurations and from the Test menu select the active one.
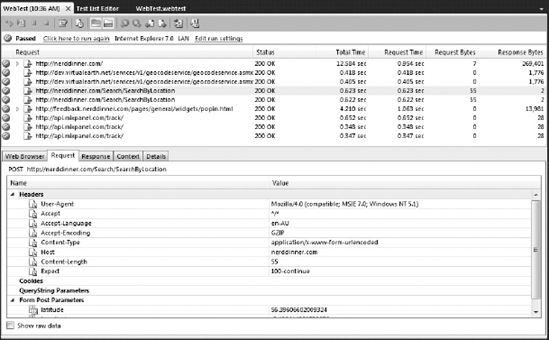
Web Tests, as well as any other type of test, are displayed in the Test List Editor window as you saw in Chapter 11. From there you can run your Web Test and group it inside a particular test list. You can also run it directly from the Web Test Designer. Once a test is run you can see its details by double-clicking it in the Test Results window. To open this window, select Test Results from the Test Windows menu. There you can see each request's status, total time, and bytes. When you select a request you will see the details of the selected request and received response, values of the context parameters, validations and extraction rules, and a web-browser-like view displaying the web page. An example is shown in Figure 56-4.
If you need additional flexibility, you can code the Web Tests using .NET and the Web Testing Framework. The best way to learn how to use the framework and start coding your test is by generating code for a recorded Web Test. You have this option in the Web Test context menu.
Whereas web and load testing are meant to test functional requirements, Load Tests will run a set of tests repeatedly so you can see how your application will perform. When you create a new Load Test, you are presented with a wizard that guides you through the necessary steps. First, you need to create a scenario; here you will define if you want to use think times. When you recorded the Web Tests, the time you took between each request was also recorded and can be used as the think time. It can be edited for each Web Test request in the properties window.
As part of the scenario, you will define the load pattern; for example, a constant load of 100 users or a load incrementing by 10 every 10 seconds until you get to 200 users. The next steps, Test, Browser, and Network Mix, define how tests will be run by virtual users, specify which browsers will be used to run the tests, and determine the kinds of network that will be simulated. In the Test Mix step you can add Generic, Ordered, and Web Tests.
In the Counter Sets step, you add the computers that you want to monitor and the performance counters you are interested in. For example, you can monitor your Database Server and IIS. In the last step, Run Settings, you can specify the test duration or test iterations, how often samples will be taken for performance counters, a test description, how many identical errors will be recorded, and the validation level. We defined a validation level for each Validation Rule in our Web Tests. Because evaluation of these rules can be expensive, in Load Tests only rules with a level equal to or below the specified validation level will be evaluated.
When you click Finish, you are presented with the Load Test Designer as shown in Figure 56-5. There you can add additional scenarios, counter sets, or new run settings.
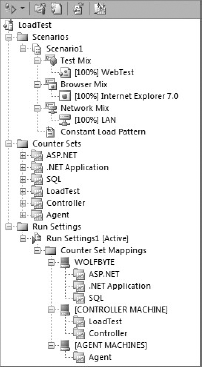
When you run the tests, you will see the Load Test Monitor; by default it will show the Graphs view. In the left-side pane you have a tree view of the counters that are being collected. You can select items there to add them to the graphics. From the toolbar, you can change to Summary or Tables view, export to Excel or CSV, and add analysis notes. In the Graphs view at the bottom, you will have a legends pane as shown in Figure 56-6. There you can select/deselect the counters that you want to include in the graphs. While the test is running, the monitor is updated on each sample interval. In the Tables view, you can see the Requests, Errors, Pages, SQL Trace, Tests, Thresholds, and Transactions.
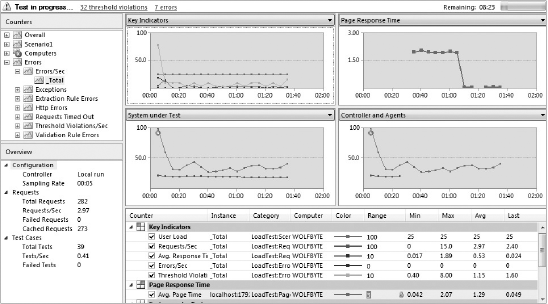
Thresholds are particularly important. These are values for each performance counter that will allow you to spot problems. In the graphs, you can see points where violations occurred marked with a warning or error icon.
For large-scale applications, one computer might not be enough to simulate the desired load. Visual Studio Team System 2010 Test Load Agent can distribute the work across different machines. It can simulate approximately 1,000 users per processor. This product requires a separate installation and requires one controller and at least one agent. To configure the environment, select Administer Test Controller from the Test menu. There you can select a controller and add agents. Then, from the Test Run Configuration window in the Controller and Agent node you can select to run the tests remotely and select the configured controller.
You already looked at unit testing in Chapter 11; this section expands the topic to databases. This kind of test is useful to verify the functionality and design of your schema objects and can work hand-in-hand with your Data Generation Plans and Schema Database Projects. To create a new Database Unit Test, from the Tests menu select New Test and choose the template for Database Unit Test, then create a new project if needed. For the first DB Unit Test in the project you will be prompted for a database to run the tests against. You can change this later from the Database Test Configuration option under the Test menu. It's highly recommended to have a dedicated database for test purposes for each developer. You can also select to deploy the project before running the tests. This will guarantee you are always running the tests against the latest version of the schema. Finally, you can select to use a Data Generation Plan to re-create the data for the unit tests.
To create and edit the tests, you have a designer (Figure 56-7). From there you can select the different test methods or create new ones and add new test conditions. The conditions available are Empty ResultSet, Execution Time, Inconclusive, Not Empty ResultSet, Row Count, and Scalar Value. When selected, you can configure them from the properties windows — for example, to set the value for the row count. You can also create your own test conditions. The Data Checksum and Expected Schema test conditions that were previously released as a part of the Power Tools pack are now also available by default.
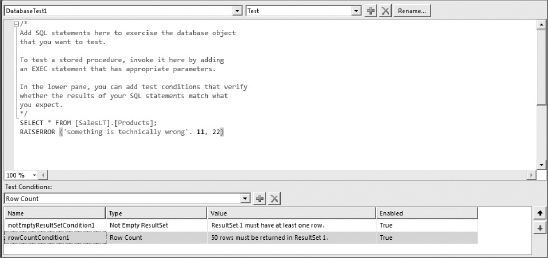
You have two other ways to verify your tests. One is by raising errors from your T-SQL code. The RAISERROR function will take an error message (this will be displayed on the Test Results window in case of failure), error severity, and error state. If error severity is above 10, it will cause the unit test to fail.
The other way to verify tests is from your C# or VB.NET script. If you right-click your test and select View Code, you will see it's structured as a regular unit test as explained in Chapter 11 and simply has methods that call SQL scripts. When you execute a script, you will get back in your .NET code an ExecutionResult array; each ExecutionResult object will contain a DataSet, number of rows affected, and the Execution Time. Using those properties you can make your assertions. The Execute method of the TestService also takes SqlParameters that could be passed to your script and can be returned to your C# code for further verification.
Sometimes the best way to test an application is to drive it from the outside as a user would.
When you create a new Coded UI Test, it starts the Coded UI Test Builder (Figure 56-8). Once you click the Start Recording button, the Coded UI Test Builder tracks all of the actions that you take with the mouse and keyboard.
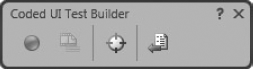
Open your application and use it to get into the state that you'd like to test, then click the Generate Code button. This prompts you to name your recorded method, which will be saved in the test project as a part of the UI Map. This map is a description of actions and assertions that you can use to automate and test your application.
Once your application is in the desired state you can create assertions about different parts of the user interface. To do this, drag the cross-hair icon from the Coded UI Test Builder over the part of the UI that you want to make an assertion about. When you release the mouse button, the Add Assertions dialog is displayed as in Figure 56-9.
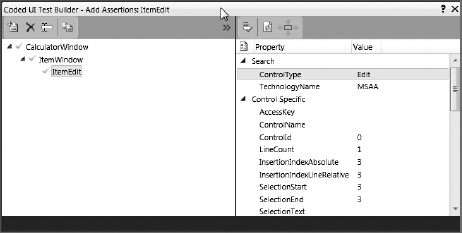
On the left is a collapsible panel showing the UI control map, which displays the hierarchy of all controls that have been identified so far. On the right is a list of properties that the Coded UI Test Builder has been able to identify along with their values. To make an assertion about one of these properties, you can right-click it and select Add Assertion. Each assertion has a comparator and a comparison value to be tested against.
Not every kind of test is covered in Team System. This is why Microsoft included the concept of Generic Tests so that you can easily use custom tests, but still be able to use the rest of the features like Test Results, Test List, Assign Work Items, and Publish Test Results.
To configure a Generic Test, you need to specify an existing program and optionally specify its command-line arguments, additional files to deploy, and environment variables. The external application can communicate the test result back to Team System in two ways. One is with the Error Level, where a value of 0 indicates success and anything else is considered a failure. The other is to return an XML file that conforms to the SummaryResult.xsd schema located in Visual Studio's installation path. In MSDN you can find information about this schema and how to report detailed errors using XML.
Ordered Tests are used when you need to group tests and run them as a whole, or if tests have dependencies on each other and need to be run in a particular order. It's a good practice to create atomic Unit Tests to be able to run them in isolation with repeatable results. I don't recommend using Ordered Tests just to deal with dependencies between Unit Tests. A good reason for creating Ordered Tests could be to create a performance session for more than one test.
In the Ordered Test Editor you will have a list of the available tests that you can add to the Ordered Test — the same test can be added more than once. You can also choose to continue after a failure. When the test is run, it executes each of the selected tests in the specified order.
Tests and code are heavily interconnected. Tests have no reason to exist without the code that they verify and code that is not verified by tests is potentially incorrect. Visual Studio contains two tools designed to make the link between tests and code more explicit. Code Coverage is able to determine which areas of your code are executed during a test run, which tells you if you need to add more tests to your solution. Test Impact Analysis enables you to determine which tests need to be re-run based on the areas of code that you have modified.
Note
Both Code Coverage and Test Impact Analysis are available only for the Premium and Ultimate editions of Visual Studio 2010.
This is a very useful tool. It will instrument the code being tested to help you see which lines of code are really being executed. First, you need to have a Test Project on your solution. To demonstrate this, you can refer to the example described under "Your First Test Case" in Chapter 11. Assuming you have already created the SubscriptionTest class and CurrentStatusTest is passing, you will now activate Code Coverage.
To open the Test Run properties window, you can double-click the Local.testsettings file in Solution Explorer or go to the menu Test
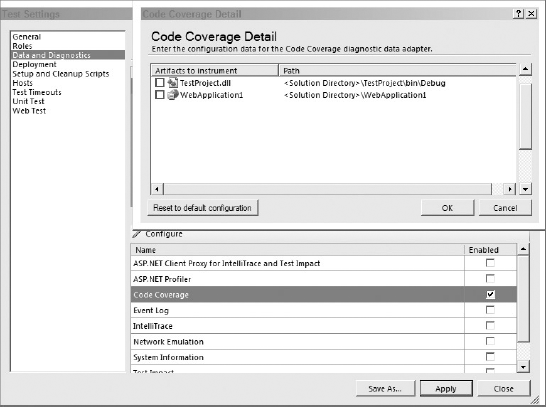
You need to select the assemblies to instrument. In case you are signing your assemblies, similar to the procedure when you are profiling using instrumentation, you need to resign them.
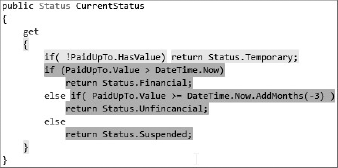
Now, simply run your test and from the Test Results window right-click it and select Code Coverage. Figure 56-11 shows the Code Coverage window, indicating the not-covered and covered blocks for each assembly, namespace, type, and member. Double-clicking a member opens the code file with the executed lines highlighted in blue (light shading in the figure) and untouched lines in red (darker shading in the figure) as shown in Figure 56-12.
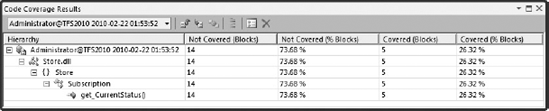
As you can see in Figure 56-11, the get_CurrentStatus() has 73.68 percent in not-covered blocks. The first option is evaluated and returned, so the remaining branches are never being touched. This is an indication that you will need additional test cases. This was covered in the "Data" section in Chapter 11, where you specify a DataSource with the additional input.
When you have code that is never touched, this can lead you to think three things:
It is code that really isn't used and is only getting in your way, decreasing your project's maintainability. Solution: simply delete it.
That code isn't being tested. Solution: create a new test.
The code is so simple that there's probably no need to test it. Think twice about this, even for simple properties or methods. The code is likely to be referenced elsewhere in your application, in which case any errors in the code may cause issues elsewhere in your application. This is a good reason to write a new test case. Right-clicking the member and selecting Find All References can help you see if this is unused code, but it won't find references from data-bound properties or projects not in the solution.
It's not necessary to take this practice to an extreme and look for 100 percent Code Coverage. In many projects it's not worth it, especially if you have legacy code or you didn't start using unit testing. What you need to keep in mind is not to let your code coverage go down. Iteration after iteration, or better yet (if you are using continuous integration), check-in after check-in, your percentage should increase, or at least remain constant. Most important, rather than looking at the numbers at a test suite level, it's useful to look at them at the code level to see if you're missing critical test cases.
It is a good idea to run all of your unit tests fairly regularly as you develop new features and fix bugs to ensure you have not broken anything. Having said that, not every test needs to be re-run each time you make a change to the code. Once it has been enabled, Test Impact Analysis is able to determine which tests will be affected by changes in your code base. The Test Impact View (Figure 56-13) is split into two sections. The top section shows the list of tests that need to be re-run based on the changes you have made to the source code. When you select a test (or tests) in the top section, the bottom section shows the method or methods that have changed.
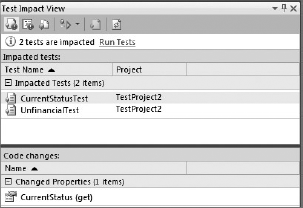
Test impact data is not kept up to date with every change that you make, because this would be too much of a performance drain on your development environment. This data is instead refreshed every time you build your solution and when you run tests. When test impact data is out of date, a refresh button becomes available on the Test Impact View.
Note
The Test Impact View has a run button that allows you to run all of the impacted tests.
The easiest way to manage your tests in Visual Studio is through the Test List Editor explained in Chapter 11. There you can add the tests to lists, select the tests or lists to run, sort, group, filter, and enable or disable them. To display the Test List Editor, select it from the Test Windows menu.
Another option is to use the Test View window, which is simpler than the Test List Editor. From there you can also run tests and filter tests, but can't group them in test lists.
When you run a set of tests you are presented with the Test Results window. In case it doesn't appear automatically, you can open it from the Test
From the Test Results window, you can export the Test Result to save a .trx file containing all the details and a folder with the test output. You can simply send the files to someone else who can import them from the Test Results window by selecting the .trx file. This person can see the same results the tester saw and even rerun the tests to reproduce the error on his or her machine. The latter is possible because the binaries are included with every test output.
Instead of passing Test Result files from one computer to another, it would be better to publish them to Team Foundation Server. This option is available in the Test Results window's toolbar. You will be prompted to select a team project. The team project must have a build configured, as you will see in Chapter 57 in the section "Team Foundation Build." The benefit of publishing, besides making the data available to other people, is that the data can also be used for reports.
Test and Lab Manager (Figure 56-14) is a new tool for you to plan, execute, and track your testing activities. It integrates directly with a Team Foundation Server and enables you to create, update, and query work items directly.
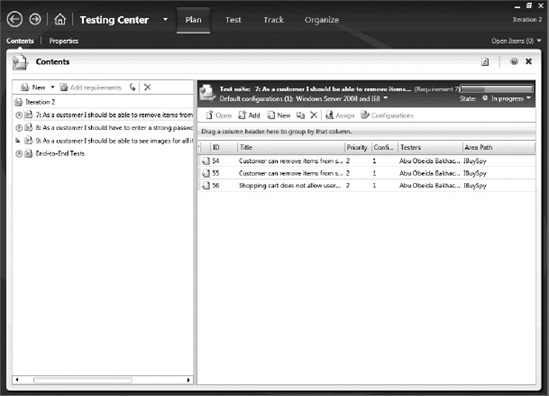
There are two UIs for Test and Lab Manager. When you first open the application it will look like Figure 56-14. This is the Testing Center. It has four tabs along the top that relate to the basic types of activities that the Testing Center provides for creating and running suites of tests.
When you first start Testing Center you are asked to create a new plan. All tests in Testing Center are organized into test plans and it is recommended that you create a test plan for each releasable version of your application. Once you have a test plan you will see the Contents View, which is shown in Figure 56-14. From here you can create new tests, add existing tests, and assign testers and configurations to your tests.
Note
Each plan has a state, which can be In Planning, In Progress, or Complete. This information is stored in the Team Foundation Server and can be surfaced in reports. When a plan is in progress, a percentage of how many of the planned test cases are complete is also available.
If you open an existing test case or create a new one you will see the Test Case window shown in Figure 56-15. Each test case is made up of a number of actions, which are shown toward the bottom of the window. Each action comes with a description of what the tester should do, along with a description of how to verify that the action has completed successfully.
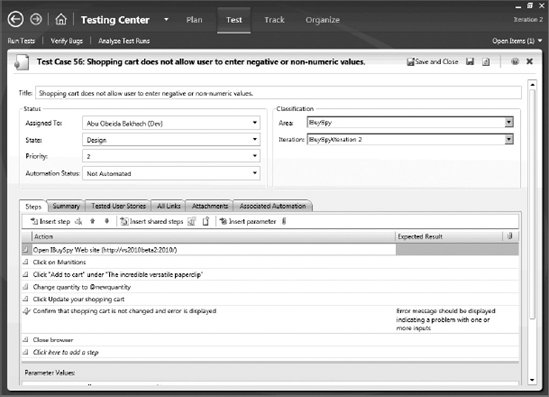
Actions can have parameters like the one in the fourth step of Figure 56-16. Each parameter can have multiple values defined, and there will be one iteration of the test for each value.
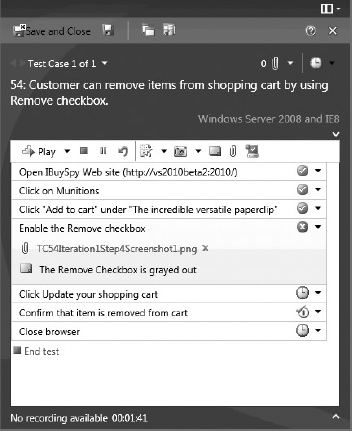
To run a test case, select it on the Test tab and click the Run button. This opens the Test Runner window (Figure 56-16). This window shows a list of steps and marks the progress of the tester. As you complete each step, you can mark it as passed or failed.
Note
You can record the steps of a manual test as you go through, which allows you to automate the process when you want to re-run the test later.
On the toolbar of the Test Runner window are buttons that allow you to attach items to the results of this test run, including comments, screenshots, files, and even a whole snapshot of the system that developers can use later to help in debugging issues. You can create bugs directly from this toolbar as well.
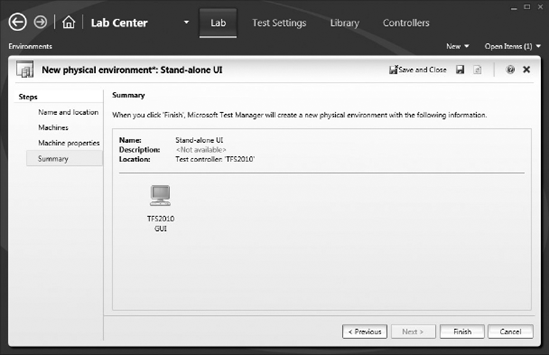
If you click the Testing Center heading you can switch over to the Lab Center (Figure 56-17). The Lab Center is used to manage the environments that you will be running tests on. This can include information on physical and virtual environments.
To use the features of Lab Center, you need to install a Test Controller and associate it with a project collection in your Team Foundation Server. Once your Test Controller is available, you are able to use the Lab Center to maintain a collection of Physical Machines, Virtual Machines and Virtual Machine Templates. When a tester starts up a test he will be connected to one of these machines and if he spots an error he can take a system snapshot, which will be attached to the bug report. When a developer retrieves the bug, he can reconnect to the test machine and have it be put back into this state by the test controller.
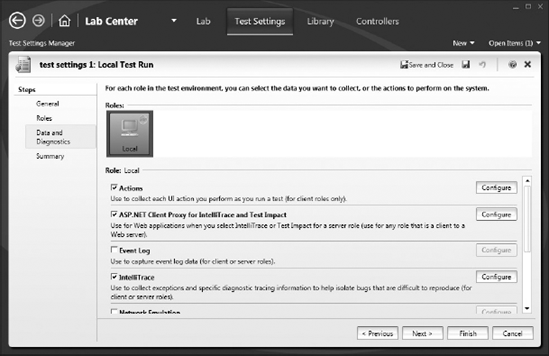
To configure the data that is collected on each machine in the environment, use the Data and Diagnostics page on the Test Settings tab (Figure 56-18). You can collect many different kinds of data, from mouse clicks and keyboard strokes to full video of the desktop during the test.
In this chapter you saw the different types of automated tests included in Visual Studio 2010. You started with Web Tests, which allow you to reproduce a set of requests, and then you continued with Load Tests, which help to simulate several users executing your tests simultaneously to stress your application. You also looked at automating your application with Coded UI Tests, which helps to test the ways in which your user will interact with your system. Generic Tests can be used to wrap existing tests that are using other mechanisms, and Ordered Tests can help you run a set of tests sequentially. You learned how to map unit tests onto the code that it tests with Code Coverage tools and how that information is used to determine which tests need to be run when the code changes. Finally, you looked at options to manage your tests, like grouping them in lists and publishing the results to Team Foundation Server.
The new Test and Lab Manager is a tool that is targeted at helping testers do their jobs. By creating test cases and organizing them into plans you can more easily manage testing tasks, and integration with Team Foundation Server makes it easy to track progress and communicate results with the rest of the team.