Everyone would like their PC to be faster. Good news: Windows 8.1 is faster, and it does a great job of keeping your PC running smoothly. The casual user should never need to think about their PC’s performance.
Some of us, however, are a bit obsessed. We strive to get the best performance possible out of our PC’s hardware. We obsess over processor, memory, and disk usage, and we scrutinize apps and services that might be slowing down our PC. This chapter is for those obsessed readers; it’s a practical guide to making your PC faster without spending a penny.
First, I’ll discuss how to use benchmarking tools to assess your PC’s performance. Then, I’ll cover some common performance troubleshooting scenarios, including finding and stopping troublesome apps. Next, I’ll describe how to tune your PC to start as fast as possible. Finally, I’ll describe two important performance tools: Task Manager and Performance Monitor.
Benchmarking tools give you a sense for your computer’s overall performance. It’s a great way to see how much faster your new computer is than your old one or how much of a difference upgrading a hard disk, processor, or your computer’s memory made.
Windows 8 (as well as many earlier versions of Windows) included the Windows Experience Index tool. This tool has been removed from Windows 8.1. Fortunately, you can still use the third-party PassMark PerformanceTest tool to benchmark your PC. You can download a free trial at http://www.passmark.com/products/pt.htm.
PerformanceTest runs a series of tests on your PC and calculates individual scores for different components and a composite score that summarizes your PC’s speed. Figure 26-1 shows PerformanceTest’s analysis of my tablet PC’s processor performance. The top number is the most important: 2565.
This score isn’t unlike WEI, but PerformanceTest has a really useful feature that WEI lacks: online comparisons. With online comparisons, you can see how your PC compares to other people’s, allowing you to determine whether your PC is performing like it should, which components might benefit the most from an upgrade, and how other people are putting together their PCs to get better performance.
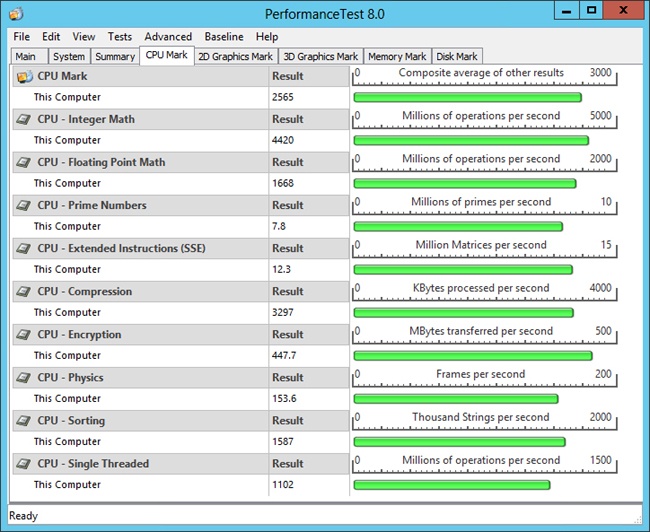
Figure 26-1. PassMark PerformanceTest provides a detailed analysis of your PC’s hardware performance.
For example, by visiting http://www.cpubenchmark.net/high_end_cpus.html (shown in Figure 26-2) or by clicking View Online Comparison Charts on the PerformanceTest Baseline menu, I can see that the fastest of the high-performance desktop CPUs has a rating of 16,629. By comparison, my tablet PC’s performance of 2565 seems pitiful. Of course, I’m confident nobody with the high-end processor is lounging on their couch with their PC in their lap.
To upload your own PC’s benchmarks, choose Upload Baseline To Web from the Baseline menu.
Perhaps it’s fun to see how fast other people’s PCs are, but I generally find it a bit torturous to know that my video rendering could be happening faster if only I was willing to spend $5,000 on a new PC. However, these benchmarks do have a very practical purpose: verifying that your PC components are performing as expected.
For example, if your hard disk seems slow, it’s entirely possible that it’s in the process of failing. In the past, I’ve seen hard disks that continue to function, but simply do a worse job of it. With PerformanceTest, you could test the performance of your hard disk and then look up how the same hard disk performs in other people’s computers.
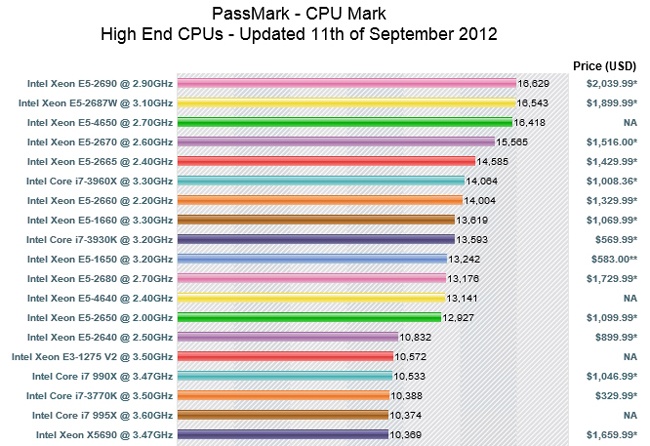
Figure 26-2. Because PassMark is a popular test, it’s easy to compare different components of your PC with those of other people around the world.
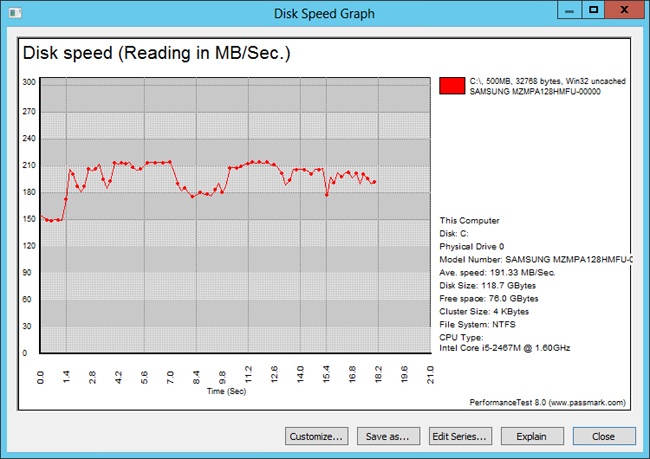
To look up how your disk performs in benchmarks, first run PerformanceTest. Then, click the View menu and click Disk Read Graph. As shown in Figure 26-3, the graph shows the number of megabytes (MB) your PC could read from the disk in a second (my tablet averaged 191 MB/sec). In the upper-right corner, you’ll find your hard disk model. In my case, it’s the Samsung MZMPA128HMFU. You can also view information about all system components on the System tab of the main PerformanceTest window.
With that information, click Close, click the Baseline menu, and then click View Online Comparison Charts. At the PassMark website, select the Hard Drive Benchmarks tab. Then, click Search For Your Hard Disk Drive and type your model number. If your performance doesn’t match up with what you see on the website, it doesn’t necessarily indicate a problem; it could just be that your PC has a slower bus speed. However, if a benchmark drops over time, that probably does indicate a problem.
HD Tune is a free app for benchmarking your disk performance. Whereas WEI gives you a single and rather vague number to summarize your disk performance, HD Tune can measure the exact read and write speeds, as well as the disk latency.
For more information about HD Tune and disk performance, read Choosing a new drive in Chapter 12.
WEI makes no mention of network performance, which I think is odd because that’s the most important performance factor for those of us who spend time on websites, use cloud services like SkyDrive, connect to other PCs with Remote Desktop, stream video, or transfer large files between PCs.
For detailed information about benchmarking your network’s performance, including your Internet connection, and improving that performance, refer to Chapter 21.
Often, there’s a single app on your computer that’s doing something processor intensive. While Windows is quite good at sharing processor time between multiple apps, a single busy app can slow down every other app on your PC.
A busy app can have other bad side effects, too. It can drastically reduce your mobile PC’s battery life. It can also increase the temperature of your PC, possibly causing your PC to slow the processor down, further reducing your PC’s performance.
Use Task Manager to find a busy app. Launch Task Manager, click More Details (if you need to), and then select the Processes tab. Click the CPU column heading to display the busiest apps at the top of the list. As shown in Figure 26-4, Task Manager shows you which app is using your processor time the heaviest.
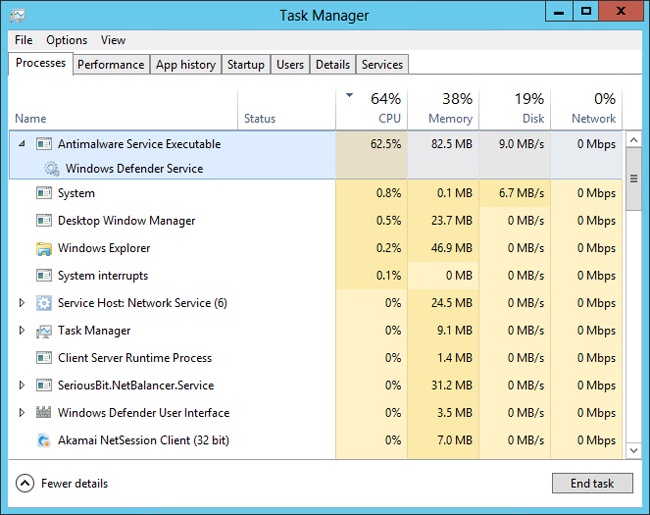
You can stop the app by right-clicking and then clicking either End Task or Stop. Don’t be too hasty, though. First, you should stop the app by closing the window if you can; ending a task from Task Manager doesn’t allow the app to save its data. Second, the app might be doing something important. In Figure 26-4, the app is Windows Defender performing a scan for malware.
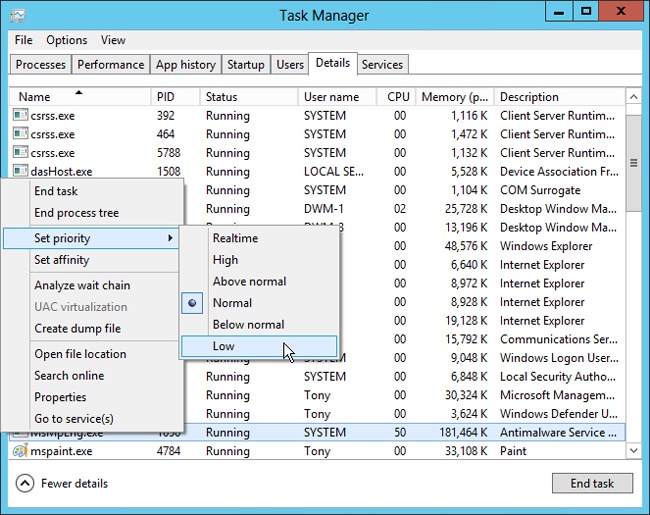
If you want to allow the app to continue running, you can minimize the impact it has on your PC’s performance by lowering its priority. On the Processes tab, right-click the app and then click Go To Details. This selects the app on the Details tab. Now, right-click the process name (which might be different from the name displayed on the Processes tab), select Set Priority, and click Below Normal or Low, as shown in Figure 26-5.
Windows uses priorities to determine which apps receive the most processor time when multiple apps need to use all the processing time available. If you have a single app using your processor time, changing the priority won’t impact that at all. However, if you have an app running in the background and it’s slowing down the app you’re using in the foreground, lowering the priority of the background app can make your foreground app seem faster.
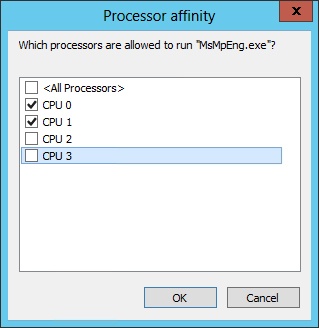
If you want to prevent an app from using 100 percent of your processor time, even if it’s the only app running, you can adjust the processor affinity. Follow the series of steps described earlier to find the process on the Details tab. Then, right-click the process and select Set Affinity. As shown in Figure 26-6, use the Processor Affinity dialog box to specify which processors the app is allowed to use. To limit an app to half your total processing time, select only half of your processors.
Windows doesn’t remember your priority or affinity settings after you close an app. The next time you start it, Windows will run the app at normal priority on all processors. To manually set the priority or affinity for an app, use the Start command-line tool. For example, to start Notepad with low priority and allow it to run on only one processor, you would run the following command at a command prompt:
start /low /affinity 0x1 %windir%System32Notepad.exeTo have Notepad run with below normal priority on two processors, you would run the following command:
start /belownormal /affinity 0x3 %windir%System32Notepad.exeYou can see full instructions by running the command start /? at a command prompt. The only tricky part about using Start is setting the affinity, which requires a binary mask that needs to be specified in hexadecimal format. Rather than teaching you Boolean and base-16 mathematics, I’ll just tell you the codes to use to enable different numbers of processors (Table 26-1).
If you regularly start an app with a manually defined priority or affinity, create a shortcut for it. From your command prompt, press the Up Arrow key to recall the last command you ran. Then, press the Home key to move the cursor to the beginning of the line. Type echo and add a space before the command. Then, press the End key, and type > slowapp.bat. Press Enter. Your command should resemble the following:
echo start /belownormal /affinity 0x3 %windir%System32Notepad.exe > slowapp.batThe Echo command simply echoes whatever you write. If you were to run the command echo hello world, the command prompt would repeat “hello world” back to you. However, adding the > symbol to the end of the command redirects the output to the file specified. So, that command writes a batch file named slowapp.bat with your previous command. Now, you can run the entire command by running slowapp.bat from your current folder, and you can use that batch file to create a shortcut.
To create a shortcut to your new batch file and run your app with your specified priority and affinity, right-click your desktop, click New, and then click Shortcut. Click Browse and select the batch file you created, as shown in Figure 26-7. If you didn’t change your current folder at the command prompt, it’s probably in your Users folder.
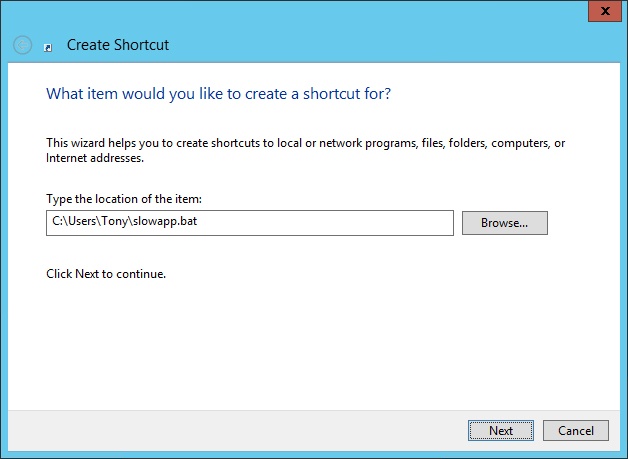
Figure 26-7. Create a shortcut using a batch file and the Start command to easily start an app with a custom priority and affinity.
Finish the remaining steps in the wizard, and you’ll have a shortcut you can run from the desktop. From the Start screen, type the name of your shortcut (such as slowapp) to run it.
The sections that follow describe several different ways to make your PC start faster.
Previous versions of Windows struggled with long startup times after users had installed a few apps. In earlier versions of Windows, apps often created agents that started automatically and slowed down the startup process even if the user never accessed the app.
The style of app designed for Windows 8.1, described in Chapter 2, does a great job of reducing the impact apps have on startup time. Basically, very few (if any) Windows 8.1 apps will increase your startup time.
You might still have desktop apps that start automatically. To view those apps, launch Task Manager, click More Details, and then select the Startup tab. If you understand what an app does and you don’t want it to start automatically, select it and then click Disable. For more information, refer to Startup tab in the Task Manager section later in this chapter.
It doesn’t hurt to simply uninstall any apps you aren’t using. You can remove Windows 8.1 apps by selecting them on the Start screen and then clicking Uninstall. To remove a desktop app, search from the Start screen for programs and features, select that tool, and then use it to remove the desktop app.
Services are apps that run in the background without a user interface. Many services start automatically so they can do important things in the background while you use your computer. For example, the Windows Search service indexes new files that you save to your PC, and the Print Spooler service waits for you to print something. These services start automatically, and they need to use your processor, memory, and disk a bit when they start, which can slow down your PC a little as you try to launch your first app.
Therefore, if your startup speed is slow, you might check your services to see if there are any services you don’t need to start automatically. To view the services on your PC, open the Computer Management console by running compmgmt.msc from the Start screen or by using the WinX menu. In Computer Management, select Services And ApplicationsServices, as shown in Figure 26-8.
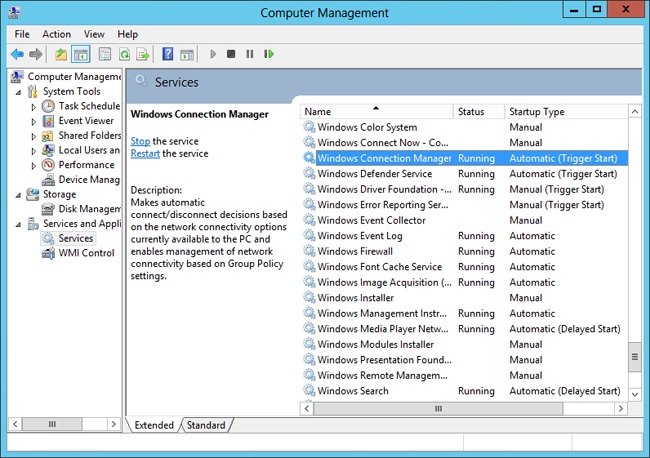
The only services that will impact your startup time are those that have Startup Type set to Automatic. Services that have a startup type of Automatic (Trigger Start) or Manual start only when they’re needed, and services that have a startup type of Automatic (Delayed Start) start after you’ve had a chance to open your first app.
To prevent a service from starting automatically, double-click it and change Startup Type to Manual, as shown in Figure 26-9, or Automatic (Delayed Start). The next time you restart your computer, the service won’t start automatically.
Choose Manual if you don’t want the service to run automatically; you’ll be able to start it manually whenever you need it. Choose Automatic (Delayed Start) to allow the service to start shortly after startup so that it won’t impact your startup time but will still be available when you need it—as long as you don’t need it immediately after logging on to your PC.
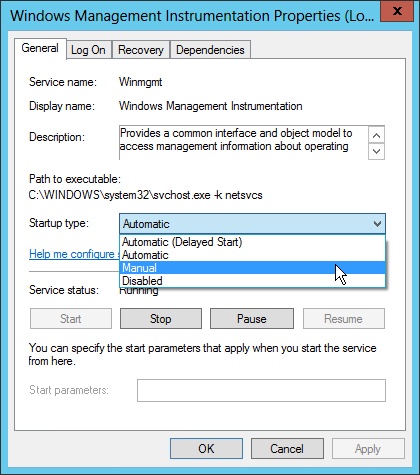
Figure 26-9. Change the startup type of a service to prevent it from slowing down your PC’s startup time.
Please don’t change the startup type for services if you don’t understand what they do. Windows 8.1 already minimizes the number of services that start automatically. For your reference, Windows 8.1 comes preconfigured to start the following services automatically. If you change their startup type, something won’t work right:
Background Tasks Infrastructure Service
Base Filtering Engine
COM+ Event System
Cryptographic Services
DCOM Server Process Launcher
DHCP Client
Diagnostic Policy Service
Distributed Link Tracking Client
IP Helper
Local Session Manager
Multimedia Class Scheduler
Network Location Awareness
Network Store Interface Service
Power
Print Spooler
Program Compatibility Assistant Service
RPC Endpoint Mapper
Security Accounts Manager
Server
Shell Hardware Detection
Superfetch
System Event Notification Service
Task Scheduler
Themes
User Profile Service
Windows Audio
Windows Audio Endpoint Builder
Windows Event Log
Windows Firewall
Windows Font Cache Service
Windows Image Acquisition (WIA)
Windows Management Instrumentation
Windows Modules Installer
WLAN AutoConfig
Workstation
Additionally, Windows will configure other built-in services to start automatically if you add or configure different features. For example, if you share a network connection as described in Chapter 22, Windows will set the Internet Connection Sharing (ICS) service to start automatically.
To summarize, services with Startup Type set to Automatic contribute to a longer startup time. However, most automatic services are important, and you shouldn’t change their startup type. Some desktop apps will install services that start automatically but aren’t necessarily required for how you use your PC, such as services that check for app updates. Therefore, by carefully choosing apps and services and changing their startup type, you can speed up your startup time without losing important functionality.
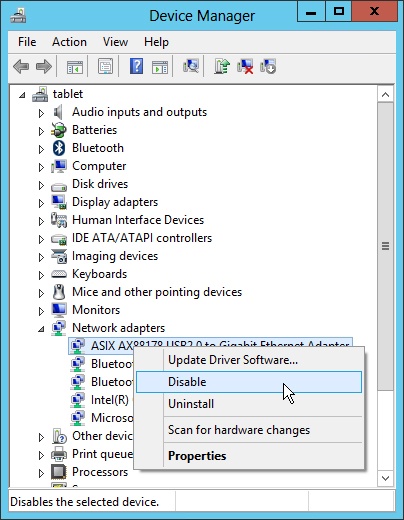
When Windows starts, it loads software drivers that allow it to communicate with every hardware component in your PC. If your PC has hardware components you never use, disabling them in Device Manager can improve your startup time, if only by a few milliseconds.
To disable a hardware device, launch Device Manager by running devmgmt.msc at the Start screen. Then, right-click your device and click Disable, as shown in Figure 26-10. To use it again, right-click it and then click Enable.
One last suggestion for speeding up PC startup times: upgrade to a new solid state drive (SSD). For more information, refer to Chapter 12.
Task Manager gives you detailed insight into the inner workings of your computer and the power to prioritize and stop processes. The redesigned Windows 8.1 Task Manager is both easier to use and more powerful.
Task Manager is a quick way to answer 90 percent of the performance-related questions you might have about your PC, including:
Why is my PC so slow right now?
What exactly is my PC doing instead of what I asked it to do?
Is anything using the network now?
What’s using my network connection now, and how much bandwidth is it using?
Which app is to blame for that data usage bill I just got?
Which desktop apps are making my PC so slow at startup?
Which services are running right now?
Note
Monitoring Windows 8.1 with Task Manager Watch the video at http://aka.ms/WinIO/taskmanager.
You can open Task Manager by pressing Ctrl+Shift+Esc on a keyboard or Windows+Power on a tablet and then clicking Task Manager. You can also open Task Manager from the WinX menu.
Windows 8.1 starts Task Manager with a simplified interface, as shown in Figure 26-11, that displays a list of applications and the End Task button. This interface (which replaces the Applications tab in earlier versions of Task Manager) is ideal for casual users, but it does not allow the user to stop the Explorer task and lacks the level of detail that power users might have become accustomed to in earlier versions of Windows.
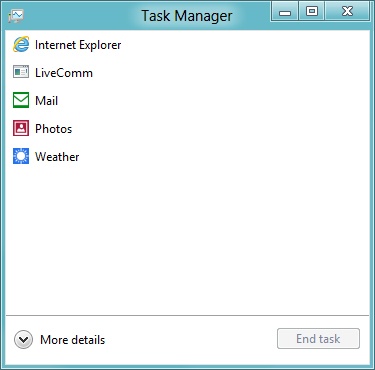
Click the More Details link to view expanded information about running applications and the operating system’s state. This view of Task Manager displays seven tabs, as described in the following sections.
All apps and many different components of Windows run in a process. A process is the container Windows uses for an app that’s running. Processes have a set of instructions to run (the app’s code), a block of memory, and privileges to other system components, such as storage, network, and hardware devices.
Some apps use multiple processes, but typically, each app has a single process. There are quite a few processes running in Windows that aren’t for apps you started, however. For example, every background service (such as the Print Spooler, which manages print jobs) runs within a process. You’ll see many different processes that you don’t recognize, but they’re probably OK, and you definitely shouldn’t start ending processes without understanding what they are.
You can view every process running on your PC by clicking the More Details link in Task Manager and then selecting the Processes tab. Windows 8.1 introduces the option to organize apps into groups such as Apps, Background Processes, and Windows Processes when processes are sorted by name. Switch between grouping or a simple list by clicking the View menu and then selecting Group By Type.
If a single application or service runs multiple processes and you have Group By Type selected, Task Manager groups those processes together, as shown in Figure 26-12. Task Manager also displays the status of an application if it is not responding. To end a process, select the process and then click End Task.
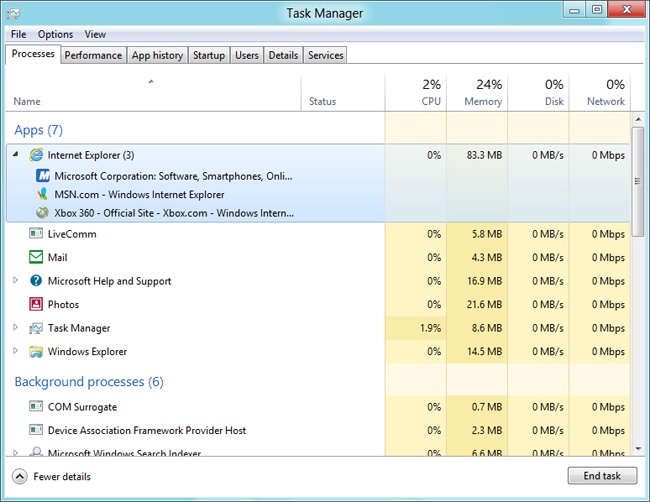
There’s another option you should enable: click the View menu, select Status Values, and then select Show Suspended Status. This shows which Windows 8.1 apps you’ve opened but are suspended. Suspended apps won’t consume any processor time and consume very little memory. For more information about suspended apps, refer to Chapter 2.
The Processes tab is useful for identifying which process is slowing down a computer. To identify which processes are using the most resources, click each of the column headings to sort the list so that the processes consuming the most CPU, memory, disk, or network resources appear at the top of the list.
To view more information about each process, right-click the column heading and select one of the following columns:
Type. Indicates whether a process is an app, a background process, or a Windows process. If you sort by name, Task Manager groups processes according to the type, making this column unnecessary.
Publisher. The publisher that signed the executable running within the process.
PID. The process ID, which uniquely identifies a specific process.
Process Name. The name assigned to the process, which is typically based on the executable file name.
Command Line. The command line used to run the process, including any parameters.
The Processes tab is also useful for finding more information about a specific process. To find a process’s executable file, right-click it and then click Open File Location. Often, the name of the folder an app is located in gives you more detail about the app itself.
The Performance tab, as shown in Figure 26-13, gives you an overview of the amount of CPU, memory, disk, and network resources that Windows 8.1 and your applications are currently using. By checking this tab, you can determine which resources are limiting your computer’s performance and use that information to identify the best way to upgrade your computer. For example, if memory utilization is consistently above 75 percent when your computer seems slow, adding more memory might improve the performance.
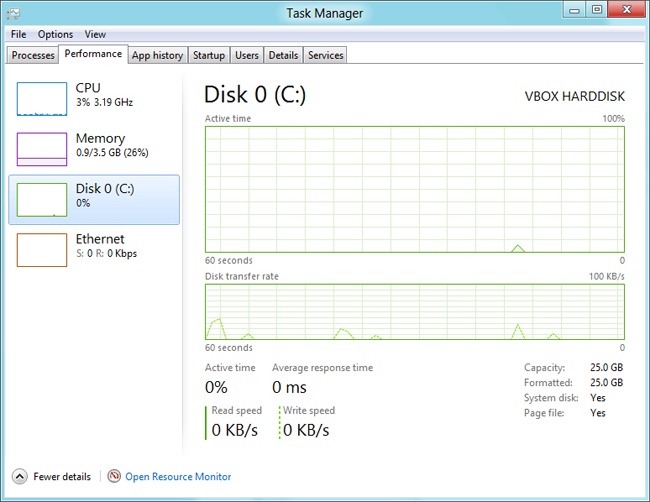
The Performance tab combines information from both the Performance and Networking tabs of the Windows 7 Task Manager. It also adds detailed information about disk utilization, including the average response time, read speed, and write speed. If you determine that one of the resources is near peak utilization, switch to the Processes tab and click a column heading to determine which processes are using the most of that resource. If you no longer need a process, you can then close the associated application or end the task to free up those resources.
Windows 8.1 adds the App History tab to Task Manager. The App History tab, as shown in Figure 26-14, shows you the CPU and network resources that applications have used, even if the application has been closed. This information is useful for troubleshooting problems users had earlier that can no longer be reproduced. For example, if someone complains that their computer often runs slow, but it is not currently running slow, check the App History tab to determine if an application used excessive processor time.
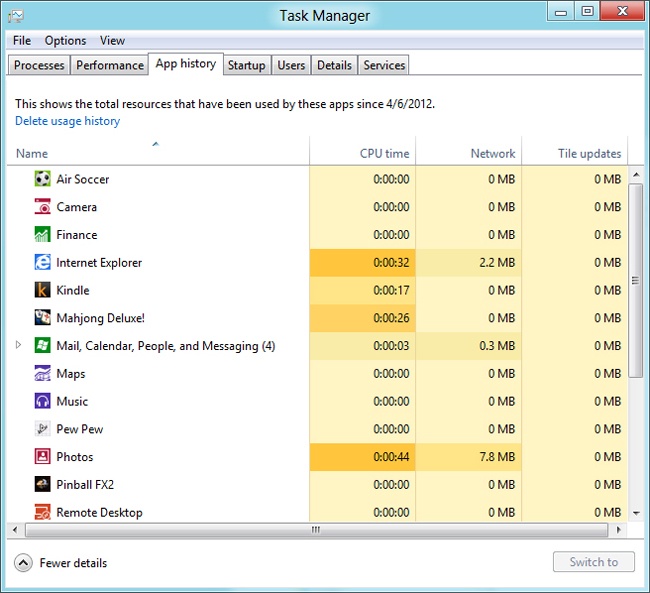
In addition to viewing the standard columns, you can right-click a column heading to add columns for non-metered network utilization, bytes downloaded, and bytes uploaded.
For privacy, click Delete Usage History to clear the history.
Desktop apps can start automatically when Windows starts, which makes them instantly available. However, each app that starts automatically also slows down the PC and increases the time it takes to manually start your own apps. Therefore, you want as few apps as possible to start automatically.
You can use the Startup tab (as shown in Figure 26-15) to control which applications start automatically. To remove a startup application, select it and then click Disable.

If you’re not sure what an app does, you shouldn’t simply disable it, because you could cause an app or hardware accessory to not work properly the next time you start your computer. Spend a few moments to research what the startup app does. Task Manager makes this easy; simply right-click the app and then click Search Online.
To create a startup task, open Task Scheduler, create a basic task, and specify the trigger as When The Computer Starts. For more information about configuring startup apps, refer to Chapter 6. For information about starting desktop apps automatically, read Configuring HTPC software to start automatically in Chapter 17.
The Users tab, shown in Figure 26-16, displays running and suspended applications for each logged-in user. You can use this tab to sign off other users or close their applications, freeing any resources they might be using, which can potentially improve your computer’s performance. Most of the time, it’s easier to simply restart your PC, however.

To log off a user, select the user and then click Sign Out. To close a process, select the process on the Processes tab and then click End Task.
To create users, open the Users tool within PC Settings. To switch users, click the currently logged-in user in the upper-right corner of the Start screen, and then click the user you prefer to log in as. For more information about users, refer to Chapter 18.
The Details tab, shown in Figure 26-17, displays in-depth information about every process running on the computer, similar to the information provided by the Processes tab in the Windows 7 Task Manager. Click a column heading to sort the processes by that column. To view other information about each process, right-click the column heading and then click Select Columns.
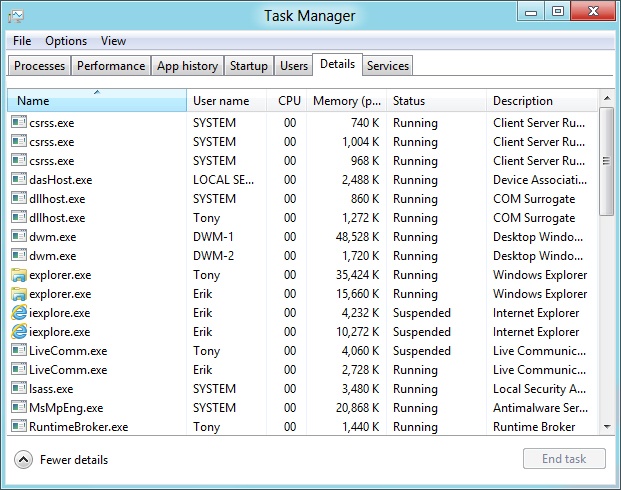
In practice, the Processes tab displays the most commonly accessed information about each process. However, if you have a detailed understanding about operating system resources, you can use the Details tab to understand each process’s utilization.
Services are processes that run in the background without a user interface. In typical usage, you will never need to interact directly with a service. The Services tab, shown in Figure 26-18, displays all services installed in Windows, whether or not they are running. You can start and stop services by right-clicking them.
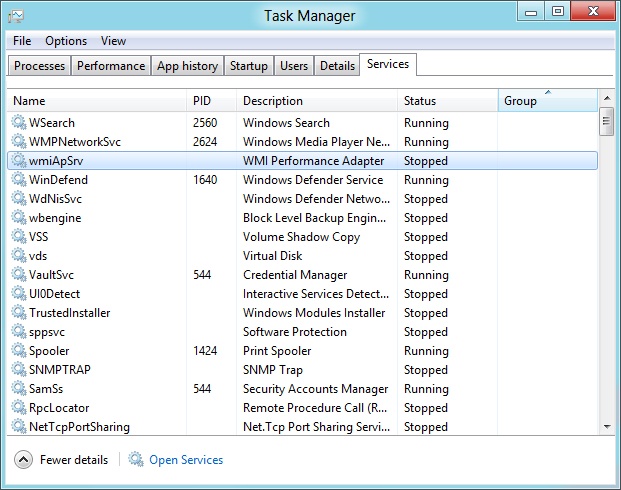
To better manage services, click Open Services at the bottom of the Services tab.
Task Manager shows you just about everything you might want to know about your PC’s performance. However, if you have a solid understanding of the inner workings of an operating system and you want even more detail, or if you want to log performance data over time, you can use the Performance Monitor tool.
Note
Monitoring Windows 8.1 with Performance Monitor Watch the video at http://aka.ms/WinIO/performance.
To start Performance Monitor, type perfmon at the Start screen and then press Enter. In the Performance Monitor window, select PerformanceMonitoring ToolsPerformance Monitor. Figure 26-19 shows the Performance Monitor graph after adding counters.
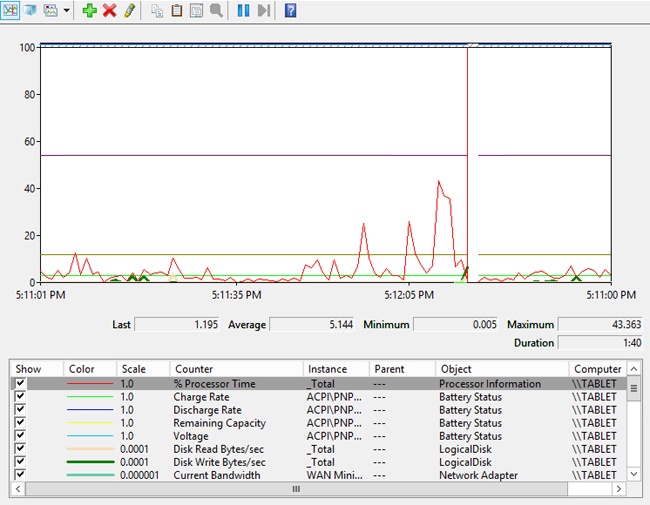
By default, Performance Monitor simply charts the PC’s processor usage, which you can see more easily by using Task Manager. However, you can add hundreds of different counters to the Performance Monitor chart and even log the data to a file for later analysis.
To add counters to the chart, click the green Add button on the toolbar. You’ll see the Add Counters dialog box, as shown in Figure 26-20. Select the Show Description check box to view information about each counter. Then, select a counter, select an instance of the counter (if available), and click Add. Repeat the process until you have added all the counters you want to monitor.

I can’t possibly describe every performance counter, but they’re well organized and they each have a useful description, so if you’re looking for something specific, you can probably find it. Some of the more useful counters include:
Process\% Processor Time. An indication of how much processor time a specific process is consuming. You might want to use Task Manager to identify the process name so that you add the correct process to Performance Monitor.
ProcessWorking Set. The amount of memory an app is currently using. Use this to reveal apps that use the most memory. If you chart a desktop app over a long period of time and it has a gradually increasing memory set, the app might have a memory leak, which is a problem the developers should be able to solve.
Processor Performance\% of Maximum Frequency. To reduce heat and power usage, processors do not always run at full speed. This shows how fast your processor is currently running. The busier your PC is, the faster the processor will run, and the more power it will consume.
Battery Status. These counters provide detailed information about your battery, including how fast it is charging or discharging and the estimated time left on the battery (in seconds). It might take several minutes after disconnecting or reconnecting power for you to see the counters updating.
Power MeterPower. For mobile PCs, this shows the power consumption in milliwatts.
Logical Disk\% Disk Time. Shows how busy the selected disk is.
Logical Disk\% Free Space. Shows how much of a disk is occupied.
Logical DiskDisk Read Bytes/sec and Disk Write Bytes/sec. Shows the number of bytes per second currently being read from or written to the disk.
Network AdapterBytes Received/sec and Bytes Sent/sec. Shows the number of bytes per second currently being read from or written to the network adapter. Note that this is bytes per second, whereas bandwidth is usually measured in bits per second. To determine the number of bits per second, multiply this value by eight.
Paging File\% Usage. The amount of the paging file currently in use. Windows uses the paging file to store data from the memory in the hard disk. Though the paging file is used even under ideal situations, high paging file usage can indicate that the PC is running more apps than it has memory for, and a memory upgrade would benefit the PC.
ServerBytes Transmitted/sec. Shows the number of bytes per second currently being sent using shared folders or homegroups. To determine the number of bits per second, multiply this value by eight.
By default, Performance Monitor updates the counters every second and displays 100 seconds of data in the graph. Though each counter can have a different behavior, the value displayed for each one-second sample is usually the average value of that counter over that time.
Updating the graph every second can lead to very spikey charts, limiting the usefulness of the maximum and minimum values. If you want to see the graph updated less frequently (resulting in smoother charts), you can edit Performance Monitor properties to update the graph less frequently. Figure 26-21 shows Performance Monitor configured to update the graph every minute and display the last hour of data. To edit Performance Monitor properties, click the Action menu and then click Properties.

When you add counters to Performance Monitor, you can view the data in real time. If you want to view the data over a long period of time, you can decrease the sample frequency so that all the data shows on the chart at once.
There’s a better way, though: logging the performance data to the disk and then analyzing it in Performance Monitor. This allows you to collect as much data as you’d like, over a long period of time, and then analyze it at your convenience. Logging performance data is the right choice for any scenario where you don’t plan to be staring at the graph the entire time the PC is on.
To log performance data, start Performance Monitor and then right-click PerformanceData Collector SetsUser Defined, click New, and then click Data Collector Set. On the first page of the Create New Data Collector Set wizard, select Create Manually, and then click Next.
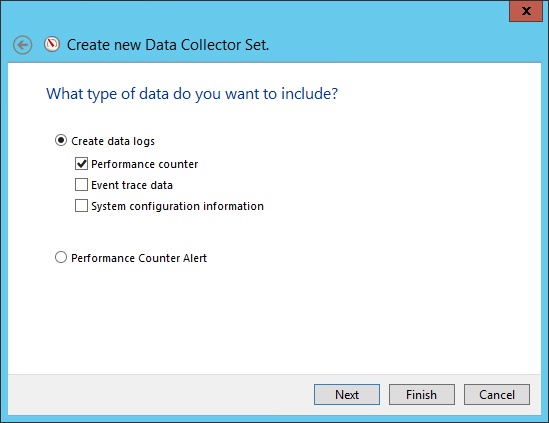
On the What Type Of Data Do You Want To Include page, as shown in Figure 26-22, select the Performance Counter check box and then click Next (but don’t click Finish). Note the Performance Counter Alert option, which is useful if you want to be notified when a performance counter goes above or below a threshold.
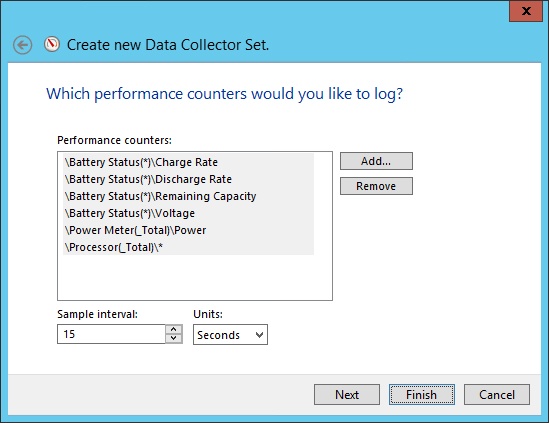
On the Which Performance Counters Would You Like To Log page, click the Add button and add the counters you want to monitor, as shown in Figure 26-23. The counters are the same as those you use with Performance Monitor in real time. Also set the sample interval. Use the longest sample interval you’re comfortable with to reduce the amount of storage space required for logging. Click Next.
The rest of the wizard is self-explanatory. On the last page, you can leave Run As set to the default; this just specifies the user account the data collector set should use to gather the data. You can also choose to start the data collector set immediately or save it for later use.
If you don’t start your data collector set immediately, you can start it later by selecting it within PerformanceData Collector SetsUser Defined and then clicking the Start The Data Collector Set button.
When you’re done gathering data and want to analyze it, click the Stop The Data Collector Set button. Then, select PerformanceMonitoring ToolsPerformance Monitor and click View Log Data on the toolbar (or press Ctrl+L). Select Log Files, click Add, and then select your log data file. By default, it will be buried a few folders deep within the Admin folder.
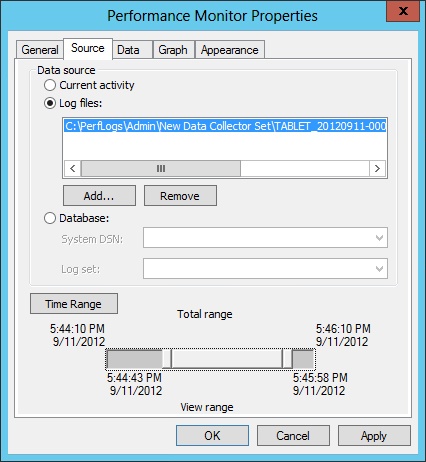
As shown in Figure 26-24, click the Time Range button and set the time period you want to analyze if you want to see data from a specific period of time. That’s useful if you’re troubleshooting a performance problem that seems to appear randomly; create and start a data collector set, and once the problem occurs, analyze just the data from that time period to determine the source. You can also adjust the time range after you click OK by dragging the bar beneath the graph.
Now, you can analyze the logged data within Performance Monitor. To examine data from a specific time range, simply drag your pointer across the chart to select that time period. Note the Average, Minimum, Maximum, and Duration fields below the graph, which provide detailed information about the counter selected at the bottom of the window.
If your PC seems slow and you want to track down the source of the problem, create a System Performance report. A System Performance report includes detailed information about your PC’s current state that you can analyze at a later time. The information includes:
Number of processors
Processor utilization overview
Interrupts per second
Which processors were the highest utilized
Speed at which different processors were running
Which services and apps used the most processor time
Disk utilization
Which files are accessed the most
Which disks are used the most
Memory utilization
Processes using the most memory
Network utilization
Top IP addresses sending and receiving network data
Amount of network data sent and received
Number of active and failed connections
To run the report from Performance Monitor, select PerformanceData Collector SetsSystemSystem Performance. Then, click the Start The Data Collector Set button on the toolbar.
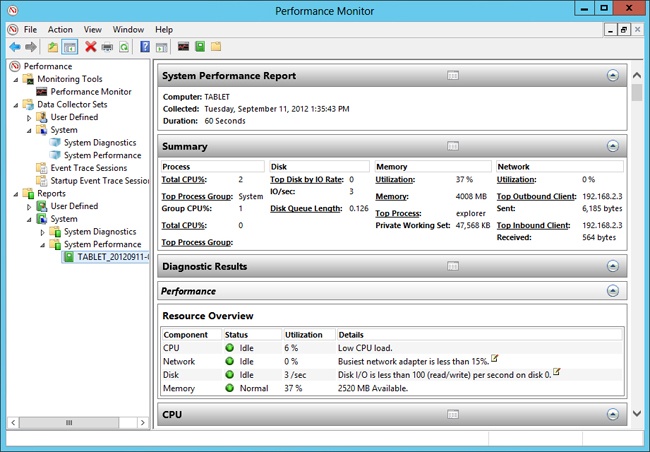
The test takes one minute to run. After a minute, select PerformanceReportsSystemSystem Performance<computer name> to view the report. The report, as shown in Figure 26-25, contains a great deal of information about your PC.