
11.5 The Data Collection Plan
We have now decided what to measure, developed a measurement system for it, corrected for bias, and identified and quantified important sources of error. Before proceeding with the actual measurements we should now formulate a data collection plan. As this plan should be based on the particulars of your measurement system it will be unique for each experiment. It is simply a written description of how the measurements are to be carried out in order to obtain representative data of good quality. As the input–output diagram lists noises and background factors it is a good starting point for the plan. The purpose is to specify practical procedures for diminishing such influences.
Background factors can sometimes be controlled, for example by isolating the measurement system from them. In other cases we can make corrections, for example by calibration. If they vary predictably we can attend to them by blocking. If they are expected to drift slowly with time we may have to calibrate at regular intervals during the measurements. It is more problematic if they vary quickly in an unpredictable way. In such situations we may measure the background factor and record it as a covariate, which can then be used for corrections of the data during the analysis phase. Remember that some background factors will remain unknown; this is why it is recommended that the run order of the measurements is randomized.
Although external noises are random effects they can often be reduced. Example 11.4 showed one example of how the influence of external noise in the form of vibrations could be decreased. The measurement procedure is often an important source of external noise, since there is always some variation in how the experimenter makes settings or creates the conditions for the measurements. For example, the measurement system analysis section in Chapter 8 showed that the two operators obtained different results from what should have been identical experimental conditions. Such differences are often due to differences in the subjective understanding of how the measurements are to be made. In the example, the difference could be due to one operator running the engine warm for a longer time before taking the measurement. We cannot blame people for making personal interpretations if we did not specify the measurement procedure it in detail. For this reason, a detailed and standardized procedure for measurement is a central part of the data collection plan. Even if only you make the measurements, you must decide on how to proceed. Otherwise, measurements made when you are tired towards the end of the day may be quite different from those made in the morning.
Example 11.5: In the diesel engine experiment, the lift-off length is sensitive to the gas temperature in the cylinder. This, in turn, is affected by heat transfer from the cylinder walls. To avoid uncertainties due to varying cylinder wall temperatures, the engine coolant was preheated to a specific temperature prior to engine start and kept constant during operation by means of a thermostat. The piston was not actively cooled and, to avoid effects of varying piston temperatures, the engine was always run for a specific period before each measurement. These steps were part of the standardized operating procedure developed to provide the same in-cylinder conditions during each measurement.![]()
The remaining part of the uncertainty is due to internal noises. These are almost always impossible to avoid. They contribute to the overall variation in the data, which should always be continuously monitored during a measurement campaign. There are two reasons for this. The first is that the variation during the actual measurements gives us a relevant measure of the measurement precision, which will be useful in the error analysis. The second is that this monitoring shows us if the measurement system is stable or not. This aspect was discussed in the measurement system analysis section of Chapter 8, where a control unit broke down halfway through a series of engine measurements. By comparing measurements made at identical conditions before and after this incident it was confirmed that exchanging the control unit did not have a measureable effect on the data. Sometimes equipment fails more slowly, or unknown background factors affect the data in a subtle way. A good general recommendation is therefore to run a stability check at regular intervals when collecting data. Depending on the nature of the measurement system, “regular” could mean once a minute, once a day, or even longer intervals.
The stability check consists of repeated measurements at one or several specified conditions. It could be the baseline operating condition of your process, if there is one, or any condition where the system is expected to behave repetitively. These measurements are plotted as a function of time in a control chart, which is a graphical tool commonly used to monitor the stability of processes. Each time a new stability measurement has been made it is added to the chart.
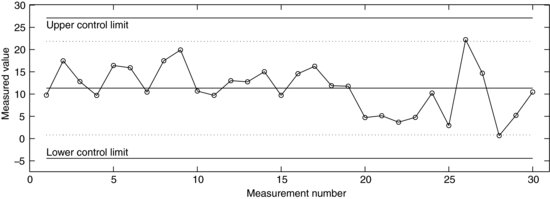
As shown in Figure 11.7, a control chart contains a centerline that represents the mean value of a measured characteristic. The chart also has two lines representing the upper and lower control limits. These are usually plotted three standard deviations above and below the centerline. Assuming that the error is normally distributed, it is very unlikely to find points outside the control limits. All the points should therefore plot between the lines and the variation should be completely random. If points plot outside the control limits, this is taken as an indication that a background factor influences the result – an influence that must be found and eliminated in order for the system to be considered stable. Note that, since the standard deviation is calculated from all the points in the chart, the control limits will move slightly when a new measurement is added, especially when there are few measurements in the chart.
Figure 11.7 Control chart for a stable system. The control limits are three standard deviations from the centerline. The dotted lines are two standard deviations from it.
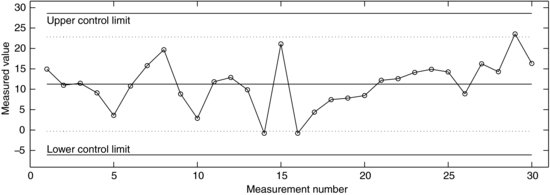
There are several indications of background effects besides points plotting outside the control limits. We should be watchful of any indication of non-random behavior. For example, if 18 out of 20 points were to plot above the centerline we would be very suspicious that something was wrong, even if all the points were within the control limits. It would suggest that a shift had occurred in the system. Consecutive points that either increase or decrease in magnitude could indicate drift; a periodic pattern is also an indication of non-random effects. Montgomery [1] gives the following criteria for detecting background effects in control charts:
- One or more points plot near or outside the control limits.
- At least eight consecutive points either increase or decrease in magnitude.
- At least eight consecutive points plot above or below the centerline.
- Two of three consecutive points plot more than two standard deviations from the control line, but within the control limits.
- Four of five consecutive points plot more than one standard deviation from the control line.
- An unusual or non-random pattern in the data.
Figure 11.8 Control chart with two causes for concern.
When formulating the data collection plan it is important to consider all parts of the data collection. As mentioned in previous chapters, there is a risk in putting all the efforts into a single experiment. The reason for making an experiment is that we do not know exactly how, or even if, the factors will affect the response. For this reason, the actual experiment is often preceded by a screening phase where the important factors are identified. Experimental results may be so unexpected that the experiment has to be redesigned before continuing. We should, therefore, make a plan where the data collection moves through a number of phases with gradually increasing level of detail. If you are making an experiment based on a factorial design, sequential experimentation (described at the end of Chapter 9) is a good example of this approach. Through the various measurement phases, the plan should specify how the measurements are to be made to mitigate effects of background factors and noises, when and how to run stability checks, and so on. If there are several operators, the plan should also involve practical training to ensure that they collect the data in the same way.
The actual data collection is not particularly challenging. There are, of course, practical problems to be considered but once the data collection plan has been established and everything is working as intended, the measurements generally require little intellectual effort. As always, things can and will go wrong. Having worked through the steps in this chapter, however, we have increased our chances of obtaining data that are useful for our purposes. In the next chapter, we will take a look at the phase where our data are turned from numerical values into carriers of meaning and significance. This involves connecting the measurements back to the research question and to that larger body of knowledge called theory.