
8.1 A Teatime Experiment
This example is borrowed from Fisher's classical book [1], as it presents some important ideas in an everyday context that requires no previous knowledge. Once you understand this simple example you will also understand why statistics is useful in the planning and interpretation of many experiments.
Imagine a lady who likes to take milk with her tea and claims that she can taste whether the milk was added to the cup before or after the tea. Our aim is to design an experiment to test this ability. We explain to her that we are going to prepare eight cups of tea. The milk will be added first to four of them, and after the tea to the other four. These two ways of preparing the tea will be called two experimental treatments. We will then present the cups to her in random order and ask her to find the four where the milk was added first.
Even if she does find the right cups, this could of course be a lucky coincidence. It is therefore useful to think about the all the possible outcomes and decide how to interpret them. Since her task is to choose four cups to put in one category, leaving the remaining four in the other, this particular experiment has 70 possible outcomes. This is because the first cup can be chosen in eight different ways, the second in seven ways and so on, yielding 8 × 7 × 6 × 5 = 1680 possible sets. However, many of these sets will contain the same cups, only arranged in different order. There are 4 × 3 × 2 × 1 = 24 ways of arranging a set of four cups, as the first can be chosen in four ways, the second in three and so on. Dividing 1680 by 24 we get 70 possible outcomes.
Out of these outcomes, only one is completely correct. A person that entirely lacks the ability to taste the difference between the treatments is thereby expected to make a correct classification once in about 70 trials.
In how many ways can she get three cups right? There are four ways to pick three cups from the correct set, and four ways to pick the remaining cup from the wrong set. This means that there are 4 × 4 = 16 ways to get three cups right. If our lady lacks the ability to discriminate between the treatments, she is still expected to get three cups right in 16/70 of the trials.
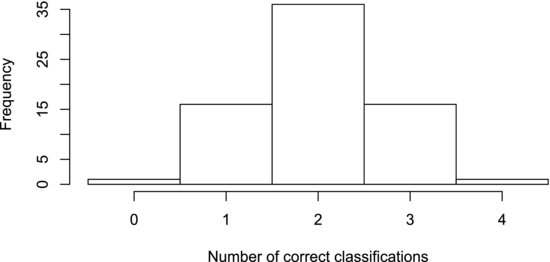
By similar reasoning we may find that there are 36 ways of getting two cups right, 16 ways of getting 1 cup right, and only one way of getting none of them right. This defines the frequency distribution that the experiment follows in the case that the outcome is completely governed by chance. It is shown graphically in Figure 8.1 and, no, it is not called the “tea” distribution!
Figure 8.1 Frequency distribution of the possible outcomes of the teatime experiment. This is the expected distribution if the outcome were governed completely by chance.
Now, would the interpretation of the experiment be different if we had used only six cups? With three cups belonging to each treatment the experiment would have 20 possible outcomes. As one of them is correct, 5% (one in twenty) of the trials is expected to produce the correct classification if the experiment is governed completely by chance. As we mentioned in the last chapter, experimenters often choose a confidence level of 95% to judge if a result is statistically significant. An experiment utilizing six cups is thereby not capable of producing a significant result. With eight cups, however, the probability of obtaining the correct result purely by chance is 1/70. Being much less than 5% this result is significant at the 95% confidence level.
This analysis helps us realize that no experiment is capable of proving the existence of any phenomenon, because there is always a slight chance that the “correct” result occurs by chance. You may recall from Chapter 2 that one of the problems with the inductive method is that we cannot logically prove a statement, regardless of how many observations we have to support it. We cannot exclude the possibility that a future observation may disprove it. Instead of aiming to prove our conclusions we should use an experimental procedure that is capable of providing a statistically significant result. This means that the probability that the result has occurred purely by chance falls below a specific limit, called the significance level.
Let us say that our lady claims that, although she has the ability to taste the difference between the treatments, she does not expect to be 100% right. How should we interpret the outcome if she classifies three cups correctly? The frequency distribution tells us that the probability of getting three or more cups right by chance is 17/70 (there is one way of getting four cups right and 16 ways of getting three right). This is more than 5% and, consequently, such a result cannot be considered to be statistically significant. If we want to improve the sensitivity of the experiment, allowing our lady to make a mistake, we have to increase the size of the experiment. For example, with twelve cups (six belonging to each treatment) the probability of classifying at least five cups correctly can be calculated to be 37/924, which is less than 5%.
The test of significance is the central element when interpreting the experimental result. It divides the outcomes into two classes: those that support the hypothesis that she lacks the ability to taste the difference between the treatments and those that support her having this ability. The first hypothesis is called the null hypothesis. It assumes that the outcome of the experiment is governed by chance and is directly coupled to the distribution of possible outcomes in Figure 8.1. The null hypothesis cannot be proven by our data, but it may be rejected on the basis of our significance test. The central idea behind this type of statistical analysis is that the experiment is conducted only to give the facts a chance to reject the null hypothesis. In fact, this idea is the statistician's version of the hypothetico-deductive method introduced in Chapter 2: if the data do not support our hypothesis we reject it, otherwise we keep it and subject it to further tests.