Chapter 15
Estimating and Scheduling Projects
In This Chapter
![]() Projecting time and cost from the bottom up
Projecting time and cost from the bottom up
![]() Reducing the uncertainty of your estimates
Reducing the uncertainty of your estimates
![]() Accelerating a project or reducing its scope
Accelerating a project or reducing its scope
When projects are late, over budget, or both, the problems are often a result of faulty estimates for the work involved and the related costs at the beginning of the effort. A vital part of project management improvement is finding a way to gather accurate estimates.
Estimating how long a project or task will take seems to be particularly difficult. Many students find that the initial timing estimates used for their projects (such as starting up new businesses) are gross underestimates. Some of this is because people have not systematically thought through all the activities needed to complete their project and have missed a number of them. Some of it arises from project managers being overly optimistic in their estimates.
A major, but subtle, problem with estimations is that you can delay some activities in a project without delaying the entire project. But this doesn’t apply to all activities. Telling the difference between the two types of activities is extremely difficult without the proper tools and techniques.
This chapter presents the basics of making accurate project estimates. We describe techniques for estimating cost and timing for the project from the bottom up and figuring out which activities can be delayed safely and which can’t. We tell you how to work with uncertain aspects of a project. We also point out how to avoid estimation pitfalls and accelerate the pace of completing a project.
Estimating Time and Cost
Somewhere between two-thirds and three-quarters of all projects are late, over budget, or both (see Chapter 14) — usually because of poor planning. But that’s not the whole story. Too often, estimates related to timing and cost are faulty from the beginning, which makes hitting the estimates nearly impossible.
Unlike processes, which occur over and over (and over), projects are one-time gigs. Estimating the time and cost of a process that has tons of backstory is pretty simple because you can just look at the historical data and work it out with math. But building accurate estimates for a project — work that has never been done before — is challenging. There’s little data to guide the predictions.
Grasping for context or boundaries, people often make estimates based on how much time and money is available. They fail to put enough consideration into the specific tasks involved in the work. This approach generates nearly useless estimates.
So what’s the answer? Where do accurate estimates come from? The first step is planning — from the bottom up. In this section, we tell you how to break down a project into the tasks it requires and then use that information to connect the dots of costs and timing to reveal a clear picture of the project at hand.
Compiling a list of tasks
Building estimates from the bottom up is better than working from the top down because it’s so easy to forget key things that need to be done when working from the top down. Similar to the process of building physical structures, you want to start conceptualizing a project by developing a solid foundation and gathering the components you’ll need for construction — before you start building. List all the activities, or operations, that the project requires, using as much detail as possible.
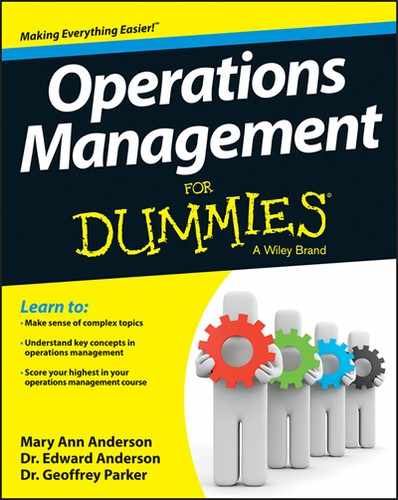
You can do this in a spreadsheet, but the task of compiling the individual components of a project is usually done in a work breakdown structure (WBS). Figure 15-1 shows a classic table version of a typical WBS. This example describes the activities required to host a business banquet — by category.
Here are some guidelines for creating a WBS:
![]() A WBS is hierarchical. At the top is a description of the entire project, and each category of activities is identified under the project title. Under each category is a lineup of specific tasks.
A WBS is hierarchical. At the top is a description of the entire project, and each category of activities is identified under the project title. Under each category is a lineup of specific tasks.
 Name each task or activity and category with a verb and an object to ensure the item is descriptive and easy to take in at a glance. Don’t worry too much about using any specific wording. The important thing is to provide a quick and easy reference.
![]() To estimate the time it takes to complete an activity, determine how many hours or minutes it would likely take one person (or other appropriate resource) to complete the activity if he were working 100 percent of the available time on that activity. This is not calendar time. If you think it will take 40 hours of work to complete an activity over a two-month period, write down 40 hours on the WBS, not one week or two months.
To estimate the time it takes to complete an activity, determine how many hours or minutes it would likely take one person (or other appropriate resource) to complete the activity if he were working 100 percent of the available time on that activity. This is not calendar time. If you think it will take 40 hours of work to complete an activity over a two-month period, write down 40 hours on the WBS, not one week or two months.
![]() Break down the project into enough detail that allows you to present activities that each take somewhere between 8 and 80 hours to complete. If any single operation requires more than 80 hours, further segment it into two or more smaller activities. Note that this rule works best for middle-sized projects. If your project is huge, like designing a new jumbo jet, you’ll have to aggregate more.
Break down the project into enough detail that allows you to present activities that each take somewhere between 8 and 80 hours to complete. If any single operation requires more than 80 hours, further segment it into two or more smaller activities. Note that this rule works best for middle-sized projects. If your project is huge, like designing a new jumbo jet, you’ll have to aggregate more.
![]() List activities in chronological order, if possible and appropriate, but don’t obsess over this. Often, activities overlap or occur as possible; sequencing isn’t that important for a WBS.
List activities in chronological order, if possible and appropriate, but don’t obsess over this. Often, activities overlap or occur as possible; sequencing isn’t that important for a WBS.
 Be sure that your WBS includes a category that contains all the upfront and ongoing planning and supervisory activities for the project. These operations require time and money, too! In fact, planning can take up to a quarter of a project’s budget. And that’s okay. What’s not okay is skimping on these tasks because you fail to budget for them or simply forget them during the madness of executing the project.
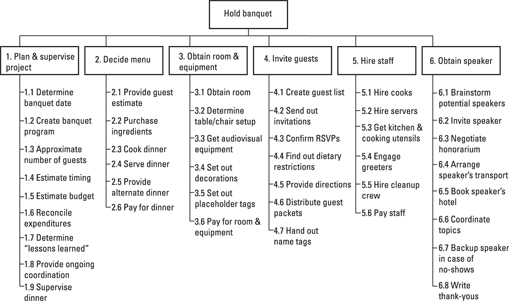
Illustration by Wiley, Composition Services Graphics
Figure 15-1: Example of a work breakdown structure (WBS) in table format to hold a business banquet.
Getting stakeholder input
Forgetting to account for an activity in work-breakdown structures is a common and potentially painful mistake. To ensure that you include all the operations that a project requires, gather appropriate stakeholders (such as representatives for each of the activity categories; see more on stakeholders in Chapter 14) and ask each person in the group to name a task that needs to be done to complete the project. Use a white board to record this information. Often, a suggestion by one person triggers a cascade of ideas from others. Continue this process until the group is out of new ideas. When a list of tasks is complete, ask the project stakeholders to cluster the activities into groups of five to eight tasks and then name the categories.
If you can’t hold such a group meeting, you can create the document and route it by e-mail for input from the category representatives. In fact, even if you do have the meeting, one of the first things you need to do after you create an initial WBS document is to ask stakeholders to review it and provide feedback. No question, stakeholders will identify activities that you haven’t thought of, and you need to add these activities to the WBS.
Formatting the WBS
For some projects, using a list format (instead of a table) for the WBS makes it easier to present the details of the operations (see Figure 15-2). You can create a list format with a standard word-processing program and include notes for individual items if needed.
Just keep in mind that the WBS is a living document and will likely change over time as a project evolves.
 The Project Management Institute, an international standards organization for promoting good project management, calls individual activities work packages and groups of activities summary tasks. In Figure 15-2, Decide menu is a summary task and Provide guest estimate is a work package.
The WBS has a natural hierarchy associated with it. It’s customary to number each of the activities and titles to show a sequential order. In other words, Send out invitations in Figure 15-2 has a two-level number, 4.2, because it’s the second task of the fourth category in the hierarchy. It’s important to point out that the numbers are simply used for reference; 4.2 is not more important than, or doesn’t necessarily need to happen before, 4.3 or 6.3.
For really complex projects, like building an offshore oil extraction platform, the number of levels in the hierarchy can get quite high. A not-so-complex example of deepening the hierarchy is to consider all the actual steps of creating a guest list for a wedding. For example, you need to secure names and addresses from the bride and the groom, as well as names and addresses for guests that the bride’s parents want to invite and the same for the groom’s parents. Then the primary stakeholders (that’s the bride and groom and their parents) must negotiate to create a final list of guests.

Illustration by Wiley, Composition Services Graphics
Figure 15-2: Paragraph (or list) version of a work breakdown structure (WBS) to hold a business banquet.
If Create guest list is a 4.1 operation that’s comparable to the item 4.1 in Figure 15-2, then here’s how this additional layer to the WBS for a project titled Host Wedding may look:
![]() 4.1.1 Create bride’s guest list
4.1.1 Create bride’s guest list
![]() 4.1.2 Create groom’s guest list
4.1.2 Create groom’s guest list
![]() 4.1.3 Create bride’s parents’ guest list
4.1.3 Create bride’s parents’ guest list
![]() 4.1.4 Create groom’s parents’ guest list
4.1.4 Create groom’s parents’ guest list
![]() 4.1.5 Combine all guest lists
4.1.5 Combine all guest lists
![]() 4.1.6 Figure out how many guests the budget can accommodate
4.1.6 Figure out how many guests the budget can accommodate
![]() 4.1.7 Adjust guest list to hit target number
4.1.7 Adjust guest list to hit target number
In short, if estimating the timing and/or cost of an activity is easier by breaking it down into finer details, then break it down. If aggregating two or more activities makes estimating easier, then aggregate. Ultimately, the purpose of the WBS is to account for all the activities in a project and to generate accurate estimates for the project’s timing and cost.
Adding up the project costs
For each activity in the work breakdown structure, you need to calculate a cost. For example, Get audiovisual equipment may simply be a cash transaction with the banquet venue. Or you may need to bring in a computer and rent a projector. In that case, you need to consider the cost of renting a projector as well as costs to pay someone to acquire the audiovisual equipment, transport it to the venue, hook it up, and make sure it works.
 A reality is that the bulk of the budget for many business projects goes to paying for the time people spend working on the project. Even if you’re already paying these people a salary, if their work time is devoted to one project, then they’re not available for other operations.
Calculating the probable cost of a project is vital, and the pivotal tool is a good WBS. With a comprehensive list of activities that a project requires, you can begin identifying what resources (both people and equipment) you need to accomplish each task — and then how much the resource costs.
For example, say that the rental fee for audiovisual equipment for the banquet illustrated in Figure 15-1 is $500. On top of that, you need someone to pick up the equipment, transport it, set it up, and monitor it during the banquet. If these tasks require 12 hours of work and the cost of labor is $25 per hour, then the cost for this activity increases by $300. This brings the total cost for Get audiovisual equipment to $800 — and don’t forget that there’s probably a cost for someone to make sure that this person completes the audiovisual work, which needs to be budgeted as part of the ongoing coordination activity.
Go through this type of process to develop a cost estimate for each of the other activities in the WBS — and then add them to get the total project estimate up!
Large projects with very long time horizons may experience inflation (or in some cases, deflation) for supplies and labor during the life of the project. Estimating inflation and deflation incorrectly contributes to costing error.
Figure 15-3 shows a cost estimate for an electronics-module development project. The salary per person for each month of work on each operation on this project is $4,000 (except activities 1.1 and 3.3). This means that activity 2.1, Internal design, costs $20,000 for five months ($4,000 · 5).
Note that Eamonn, the internal design resource, may take eight calendar months (not five) to complete the internal design operation because he gets interrupted by other projects, training classes, and so forth. But this project is only charged for the actual time this resource spends working on it.
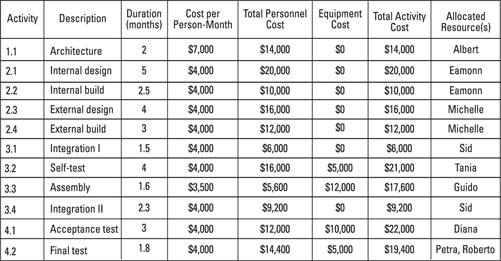
Illustration by Wiley, Composition Services Graphics
Figure 15-3: Cost worksheet for an electronics development project.
Activity 3.3, Assembly, requires a bit more calculation. Guido spends 1.6 months working to complete the activity at $3,500 per month. Equipment costs are also associated with assembly. So the total cost for activity 3.3 is $5,600 (1.6 · $3,500) plus $12,000 = $17,600.
Watch out for activities that require multiple employees. For example, activity 4.2, Final test, uses Petra and Roberto; both need to be paid, so the total cost for this activity is 2 · $4,000 = $8,000 · 1.8 months = $19,400.
To get the estimated cost for the entire project, just add up all the activity costs. Doing this in Figure 15-3 results in a total cost for the project of $167,200.
Timing: The critical path
Unlike estimating cost for a project, timing estimates aren’t a matter of simple addition — chiefly because some activities can happen at the same time. Figuring out how much time you need for various activities and what can happen when is tough to do in your head. So don’t try.
Instead, develop a critical path diagram. A critical path diagram identifies which activities need to be completed before other activities begin. These activities are also called predecessors and must be carried out before the subsequent dependent activities can begin. The critical path diagram is an important reference for determining which operations can happen at the same time and which can be scheduled independently. It also tells you which activities can be delayed without delaying the entire project — and which ones can’t.
Activities that can’t be delayed without jeopardizing the project schedule overall are called critical path activities; their sequence is called the critical path. The critical path determines the shortest possible timing of the project. A project always has a critical path. It’s neither good nor bad. What’s important is that you identify it correctly.
Consider a volunteer project to build an outdoor sitting area with several benches. The activities related to this project are described in Table 15-1. Sometimes, you may see activities labeled with letter identifiers instead of numbers, so we use letters here.

To begin the process of determining timing requirements for this project, look for activities without predecessors — activities that can begin without any other activity being completed beforehand. In Table 15-1, activities A, B, and D qualify; they can start before any other activities are complete.
Next, identify activities that do have predecessors. In the outdoor sitting area project, volunteers supply the landscaping tools, so activity C is dependent on activity B. Activity E is also dependent on activity B for the labor. Activity G needs to be preceded by both Activity A (because the size of the site determines how much material is required) and D (because you need money to buy materials). Activity I requires completion of activities B, C, F, and H.
If you have any doubt about whether an activity is a predecessor, go ahead and list it as one. Adding a predecessor unnecessarily won’t affect your timing calculations, but missing a necessary dependence will almost always mess up your calculations.
Now you’re ready to draw a critical path diagram. Follow these steps to create a diagram for the outdoor sitting area project:
1. Put each activity with no predecessors in a circle.
Arrange these circles in a vertical line if you can, although this isn’t critical. In Figure 15-4, these activities are A, B, and D.
If you don’t have enough space in the circles (called nodes) to list the title of an activity, use its label.
2. Label each activity with an estimated duration inside the circle.
In Figure 15-4, time is presented in units of days.
3. Draw a new circle to the left of the circles showing activities with no predecessors.
Label it Start, with a duration of 0.
4. Connect the start node to the initial activities with an arrow.
The direction of the arrows indicates which activities are predecessors and which are successors.
5. Then, working sequentially, find the activities that follow the existing activity circles and add them to the diagram, placing them to the right of their predecessor(s).
6. Continue this process until no more activities remain.
7. Add a final node and label it End, with a duration of 0.
Connect all the activities with no successors to the End activity. You now have a complete critical path diagram, also sometimes called a critical path method (or CPM) diagram.

Illustration by Wiley, Composition Services Graphics
Figure 15-4: Critical path diagram for an outside sitting area project.
Performing a forward pass
With a critical path diagram complete, you can calculate a timing estimate for your project. Follow these steps to perform a forward pass analysis, which defines the earliest start times and earliest finish times for each activity. This also identifies the earliest finish time for the project as a whole:
1. Begin by writing the earliest start (ES) time (which is customarily 0) in the upper-left corner of the start node.
2. Add the duration of the start node (0 days) to determine the earliest finish (EF) time for the start node and mark it in the upper-right corner of the node.
That is, EF = ES + Duration.
3. All the activities that can begin right away (activities with no predecessors) have an ES time of 0 because they are successors to the start node.
In Figure 15-5, B’s ES time is 0, as noted in the upper-left corner. The duration of this activity is 21, which means that B’s EF Time = ES Time + Duration = 0 + 21 days = 21 days. This information is noted in the upper-right corner of the activity’s node.
4. Subsequent activities, operations with a predecessor, have an ES time that’s equal to the earliest finish time of its predecessor.
In Figure 15-5, this means that Activity C’s ES is 21. Its duration is 7, so C’s EF time is 28.
5. If an activity has two predecessors, then its ES is the later of the two predecessor’s EF times.
In Figure 15-5, Activity F has two predecessors, B and C, with earliest finish times of 21 and 28, respectively. So F’s ES is 28. Its EF time is 28 + 0.5 = 28.5 days.
6. Continue noting the ES and EF times for all the activities on the diagram.
Note an EF time on the End node. In Figure 15-5, the EF time, 31.2 days, is the minimum time needed to complete the project.
Working backward
When you’ve finished entering timing data for a forward pass analysis, you can create the backward pass analysis, which determines the latest times an activity can be started and finished without compromising the timing of the project as a whole. Follow these steps to complete this part of the diagram:
1. Set the latest finish (LF) time for the project by setting the LF of the END note equal to its EF time.
Mark this time in the lower-right corner of the End node.
2. Subtract the duration of the End node (0 days) from the latest finish time to get the latest start (LS) time.
That is, LS = LF minus Duration. Mark the LS in the lower-left corner of the node.
3. The LF time for all the activities in the diagram is equal to the LS time of its successor activity.
In Figure 15-5, for example, the LF time of activity J is the LS time of activity K, which is 30.9 days. J’s duration is 0.15, so its LS time is 30.9 minus 0.15 = 30.75.
4. If an activity has several successors, its EF time is the earliest of the successors’ LS times.
In Figure 15-5, Activity C has two successors, F and I. F’s LS time is 30, and I’s is 30.5. So C’s LF time is 30.
5. Repeat this process until you get back to the start node.
If the start node’s LS time is something other than 0, you’ve made a mistake.
Pointing out slack
Now you need to calculate slacks. The slack for each activity is the amount of time that its finish can be delayed without lengthening the completion time of the entire project. Find slack by subtracting the EF time from the LF time. That is, Slack = LF minus EF. For example, in Figure 15-5, activity B’s slack is 23 minus 21 = 2.0 days. Note the slack for each activity somewhere convenient.
Finding and using the critical path
The project’s critical path is the sequence of activities with zero slack and is the longest possible path through the CPM diagram in terms of timing. The critical path is what determines the timing of the project. Note that it’s possible to have more than one critical path if the two (or more) longest paths through the CPM diagram have the same duration.
Figure 15-5 shows a completed critical path diagram of the project defined in Figure 15-4.
Ensuring that none of the activities on the critical path is delayed ensures that the work is completed according to time estimates. For this reason, it helps prioritize a project manager’s time by identifying what activities need the most attention at specific periods in the process.
Keep in mind that the critical path diagram, like all other project management documents and tools, is a living thing. If the actual completion time of an activity exceeds your estimates by more than its slack, then you need to recalculate the critical path.
Use the critical path to determine timing. Never use it to determine cost because the critical path does not include all the activities related to a project. And you need to account for all activities when calculating cost. For example, in Table 15-1, activity E (Building park benches) is not on the critical path; it doesn’t affect timing. But if you have to hire someone to complete that activity, you still need to pay the person two days of labor, which must be included in the project cost estimate.

Illustration by Wiley, Composition Services Graphics
Figure 15-5: Critical path diagram with timing data.
Assigning tasks
You must assign someone to be responsible for each activity in a project. Otherwise, it’s unlikely to be completed. Making this assignment through the work breakdown structure (WBS) is a popular technique.
Be sure to watch out for resource conflicts (covered in Chapter 4) when you assign an individual to handle certain activities. A critical job for the project manager is finding and removing hidden dependencies, which are situations when one task is delayed because it shares a resource with another activity.
For example, in Figure 15-6, the critical path seems to be Start-A-B-D-End, which appears to take an estimated 46 days (0 + 14 + 20 + 12 + 0).

Illustration by Wiley, Composition Services Graphics
Figure 15-6: Critical path diagram showing a resource conflict.
But a closer look reveals that Betty is working on Activity B and Activity C. Time estimates in project management generally assume that a resource is working on an activity 100 percent of the time, so Betty can’t work on both B and C simultaneously without stretching out their duration. There is a hidden dependency between B and C!
The actual critical path (because of the shared resource for B and C) is Start-A-B-C-D-End (or Start-A-C-B-D-End), which means the duration of the project is 0 + 14 + 20 + 15 + 12 + 0 = 61 days. The only way to get activity C off the critical path and reduce the timing back down to 46 days is to assign someone other than Betty to perform either B or C.
Presenting the schedule
As discussed in Chapter 14, keeping the client and other stakeholders for your project in the loop with schedules and other project information is critical. However, critical path method diagrams are not useful tools for communicating or visualizing schedules. Something else is needed.
Most project managers use a Gantt chart (developed by Henry Gantt, an early operations management guru) for this purpose. A simplified version of the outdoor sitting area project, which you might present to potential donors or your client, is shown in Figure 15-7. The bars to the right of each activity indicate when the activity will take place. The right side of the rightmost bar in the Gantt chart indicates when the project will be completed.

Illustration by Wiley, Composition Services Graphics
Figure 15-7: Gantt chart for the volunteer project.
Indicating dependencies in a Gantt chart is difficult. Many people show the activities that belong to the critical chain (and hence have no slack) in a different color. In Figure 15-7, this is black. While it doesn’t give any direct information on dependencies, one can get some indication of an activity’s slack from a Gantt chart. So while it is excellent for visualization and communication, it hides much critical information. So it needs to be used in conjunction with a critical path analysis, not instead of it.
Working with Uncertainty
Estimates are uncertain. One wit once commented that “the only certain thing about estimates is that they will be wrong.” So, you may be wondering how you can communicate this uncertainty (and how big it is) to others and how you can reduce the uncertainty in your estimates. In this section, we address these puzzling questions.
Estimating with ranges
All point estimates — estimates that center on a single point, such as 145 days for a project duration as opposed to a range estimate of 140 to 170 days — will almost certainly be wrong. If you say a project is going to be completed in 12 days, you may be done in 12 days, but in most cases, you’ll be much more likely to finish the project in 9, 10, 11, 13, 14, 15, or some other number of days.
Another problem with point estimates is that they imply much more certainty about the completion time than you probably want. The reality is that 12 days — even if calculated with great care — is a guess, and being able to convey the uncertainty inherent in this estimate can set up more realistic expectations among the project stakeholders.
If you use a range estimate, such as “between 10 and 15 days,” then you have a better chance of being correct. And the mere fact that you’re using a range conveys a more appropriate level of uncertainty than a specific number of days. The gap between the lower and upper end conveys how uncertain the estimate is — a 20-day spread is far less certain than a 4-day range.
In the project management world, percentiles are expressed by P followed by the percentile. A P95 estimate of 15 days means that the project has a 95 percent chance of being completed in 15 days or fewer. A P05 or P5 estimate of 8 days means that a project has a 5 percent chance of being completed in 8 days or fewer.
So how do you set the range? The most popular options for timing and cost estimates are ranges defined by the P5 and P95 estimates. Using a P5–P95 range means that your actual timing or cost has a 95 percent – 5 percent = 90 percent chance of falling within the estimate range.
Using historical data
The best way to calculate the end-points of an estimate range, particularly if you’re using a P5–P95 range, is to use any cost or duration data you have on similar activities that you’ve done on other projects in the past. You may have written or computer records. Ideally, if you can find a number of similar activities that would be best, because from this data, you need to find the mean (representing the expected value) and the standard deviation (to determine the range of error) for each activity. Then you can calculate cost and timing estimates for the entire project, as we show later in this section.
The expected value is the mean average of a number of observations. Mathematically, the expected value for a number of observations X1, X2 . . . Xn, is
![]()
A major pitfall when using historical data is assuming that the nature of the activity has stayed the same over time. For example, drilling oil wells now is much more complicated than it was even ten years ago, because drills need to go to much greater depths to extract oil; this raises both cost and duration. Similarly, creating the artistic renderings for videogames on newer platforms is much more expensive and time consuming than it was in the past because the platforms can render almost photorealistic animation. In contrast, paving roads has not changed much in terms of timing over the past several decades, although the labor cost per hour of work has increased.
The standard deviation is the square root of the variance. Mathematically, the variance for a number of observations X1, X2, . . . Xn, is
![]()
where the μ is the expected value (mean) of X. You can think of the standard deviation as roughly speaking the average distance an observation is from the mean. People often confuse the variance and the standard deviation.
Standard deviations are often easier to work with to develop timing and cost estimates because they can be in the same units (days, months, dollars) as the factor you’re trying to estimate, but you can’t add them together. You can, however, add variances.
Figure 15-8 shows the historical data for an electronics project. Use it first to calculate cost of the project. To find the expected cost (mean) for the entire project, add together the mean costs for all the activities in the project. This gives you a sum of $122,800, which is the expected cost of the project.
Getting the standard deviation is trickier because you can’t directly add standard deviations together. You need to square each activity’s standard deviation to get a variance. Then you can add up the activity variances to get the variance for the cost of the entire project, $32002 + $12,0002 + . . . + $16002 = 588,640,000. The square root of 588,640,000 is $24,262, which is the standard deviation of the estimated cost for the project.
So the estimated cost of the project has a mean of $122,800 and a standard deviation of $24,262. With this information, you can calculate the P05, P10, and so forth.
If you add up enough activities, you can obtain a normal distribution for the estimate thanks to the central limit theorem from statistics, which says that if you add up more and more independent random variables, the sum will look more and more like a normal distribution (also called a bell curve).
How many activities is enough depends on the shape of their own historical distributions. A rough rule of thumb is that 30 usually is enough, but if the individual activities have normal distributions themselves, then you can get by with a lot fewer. For purposes of estimation, most real-world projects that are complicated enough to detailed estimation have enough activities to get an approximately normal distribution.
Illustration by Wiley, Composition Services Graphics
Figure 15-8: Historical timing and cost data for example project.
With a normal distribution, you can figure out a particular percentile. Use the following equation, where PXX represents the P5, P50, P90, or other percentile:
PXX = μ + zσ
The μ is the expected value (mean), σ is the standard deviation, and z is the number of standard deviations that the estimate is above (or, if z is negative, below) the mean.
Because the estimates are normally distributed, you can find the value for z in any standard z-chart for the normal distribution. Figure 15-9 presents a table of the z’s for the most commonly used values of P.

Illustration by Wiley, Composition Services Graphics
Figure 15-9: Z values for the most commonly encountered values of P.
In the example in Figure 15-9, the P90 estimate for cost is
P90 = μ + 1.28σ = $122,800 + 1.28($24,262) = $153,855
The P10 estimate is
P10 = μ + (–1.28)σ = $122,800 – 1.28($18,859) = $91,745
When you communicate with your colleagues about the cost of the project, you can just say, “It has a P10 to P90 range of $92 thousand to $154 thousand.” It’s a good idea to round off your figures so that you don’t give the impression that your estimate is more accurate than it really is.
To calculate the time estimate for the project, you need to adjust the critical path method a bit. This adjustment is called the program evaluation and review technique (better known as PERT). The technique was developed originally by the U.S. Navy to manage the building of nuclear submarines.
Here’s the PERT process:
1. Get the mean and standard deviation estimates for each activity.
2. Use the mean timing estimates for each activity to draw a critical path diagram.
3. Identify the critical path.
4. Add up the means of all the activities on the critical path.
This is the mean for your project’s duration.
5. Add up the variances of all the activities on the critical path.
This sum is the variance for your project’s duration; the square root of that variance is the project’s standard deviation.
6. Then you can find the values for P10, P50, and P90 (or alternately P5, P50, and P95) using P = μ + zσ.
Make sure to use the means as the durations in the PERT critical path diagram! If you use a P50, median, or mode for individual activity durations instead, you’ll underestimate the project mean, because activity durations typically are not normally distributed.
Figure 15-10 shows the PERT version of the critical path diagram for the example electronics project. The critical path is Start-A-B-C-F-H-J-L-End. Adding up the expected (mean) durations for each activity on the critical path yields an expected duration for the project of 16.7 months.
Adding up the variances for each activity on the critical path yields a project timing variance of 11.79. The square root of this variance reveals a standard deviation for the project timing of 3.43 months.

Illustration by Wiley, Composition Services Graphics
Figure 15-10: Critical path diagram for example electronics project.
From this, the P90 estimate is
μ + 1.28σ = 16.7 months + 1.28(3.43 months) = 21.1 months.
The P10 estimate is
μ + (–1.28)σ = 16.7 months – 1.28(3.43 months) = 12.3 months.
This tells you that the project has a 90 percent chance of being completed within 21.1 months or less and only a 10 percent chance of being completed within 12.3 months or less. Now you have your range: The project will be complete in 12.3 to 21.1 months according to your P10–P90 range estimate.
Sometimes the PERT assumption that the P90 (or P95, if you use that instead) of the critical path is approximately equal to the P90 of the project as a whole can lead you astray. This, which could result in a significant underestimate, happens most often if a very high-risk activity — one with a large standard deviation — is on a path that’s almost as long as the critical path. To avoid this, calculate the P90 for each path in the project, and use the biggest P90 path estimate as the P90 estimate for the entire project.
For example, the expected duration of the Start-A-D-E-F-H-J-L-End path is 16.2 months (which is a little less than that of the critical path), and the standard deviation is 4.67 months (which is significantly higher than the critical path). Using these numbers yields a P90 for this near-critical path of
P90 = μ + 1.28σ = 16.2 months + 1.28(4.67 months) = 22.2 months.
Because 22.2 months is greater than the critical path’s P90 of 21.1 months, use 22.2 months as your P90 estimate of the project as a whole.
Relying on expert knowledge
Sometimes data for a particular activity doesn’t exist. What do you do then? The rule of thumb that the U.S. Navy developed as part of the PERT methodology is to find the industry expert who is most familiar with the activity. Then have him or her make the following three estimates related to the activity’s time to completion.
![]() Minimum: Estimate the minimum time that it will take to complete the activity. Tell the expert that only a 5 percent chance of completing the activity in less time than this minimum estimate (or 1 chance in 20) should exist. This is the equivalent to a P5 estimate.
Minimum: Estimate the minimum time that it will take to complete the activity. Tell the expert that only a 5 percent chance of completing the activity in less time than this minimum estimate (or 1 chance in 20) should exist. This is the equivalent to a P5 estimate.
![]() Most likely: Estimate the most likely duration for the activity. This is the mode (not the median or mean). In practice, this is the estimate people usually give anyway. They are unlikely to provide the mean, because this isn’t an intuitive number to calculate in your head. But the expert might give you a P50 (median). If this happens, don’t worry because the median usually results in only a slight overestimate, and overestimates are generally much less problematic for project managers than underestimates!
Most likely: Estimate the most likely duration for the activity. This is the mode (not the median or mean). In practice, this is the estimate people usually give anyway. They are unlikely to provide the mean, because this isn’t an intuitive number to calculate in your head. But the expert might give you a P50 (median). If this happens, don’t worry because the median usually results in only a slight overestimate, and overestimates are generally much less problematic for project managers than underestimates!
![]() Maximum: Estimate the maximum amount of time that it will take to complete the activity. Tell the expert that only a 5 percent chance of the project duration exceeding this maximum estimate (or 1 chance in 20) should exist. This is the equivalent to a P95 estimate.
Maximum: Estimate the maximum amount of time that it will take to complete the activity. Tell the expert that only a 5 percent chance of the project duration exceeding this maximum estimate (or 1 chance in 20) should exist. This is the equivalent to a P95 estimate.
After you have these three estimates, use the following two equations to get the PERT 3-point estimates for the expected value (mean) for the activity’s duration and the corresponding standard deviation:
![]()
![]()
For example, assume that you are trying to calculate the mean and standard deviation to remodel a kitchen. The project manager gives you minimum, most likely, and maximum estimates of 2 weeks, 4 weeks, and 10 weeks.
Do you notice that the most likely estimate is significantly closer to the minimum than it is to the maximum? This is typical of most activities. If this isn’t true in your estimates, be suspicious.
In this case, the expected value (mean) estimate of the activity’s duration is (2 weeks + 4 · (4 weeks) + 10 weeks)/6 = 4.67 weeks. The standard deviation is (10 weeks – 2 weeks)/6 = 1.33 weeks. The expected value of 4.67 weeks is greater than the most likely estimate for the activity. This is normal because many things in an activity are much more likely to go wrong than right. (Yes, the great project manager in the sky is a pessimist.) In fact, the gap might be much larger.
With the estimates, you can use them to replace the historical estimates you used in the PERT method. Then calculate the critical path and duration of the project as a whole — just as if you’re working with historical data.
Use the same approach to estimate cost. For example, if your kitchen remodeling has minimum, most likely, and maximum estimates of $13,000, $25,000, and $65,000, then your expected cost is $29,700, and the standard deviation is $8670. You then replace the historical data with your numbers to determine overall project cost estimates.
The PERT 3-point estimates assume that you’re getting the actual minimum and maximum estimate of an activity’s duration (or cost). But research shows that people (even experts) can’t accurately determine these end points very well; they often give you a P5 and P95 when you ask for the minimum and maximum (even if you ask them not to). This causes the mean and the standard deviation to be underestimated.
To address this issue, statisticians often use these formulas instead:
![]() Mean = (0.185 · minimum + 0.63 · P50 + 0.185 · maximum)
Mean = (0.185 · minimum + 0.63 · P50 + 0.185 · maximum)
![]() Standard deviation = (maximum – minimum)/3.25
Standard deviation = (maximum – minimum)/3.25
Note that the P50 is really the P50 estimate (the median) in this formula, not the most likely estimate (the mode).
Putting It All Together
As you make all your calculations for a project, bear in mind that they aren’t set in stone just because they crank out a number. You also have to cope with meeting the expectations of management, which may differ from your estimates. However, you can often adjust the assumptions behind the estimates by adding resources to the project to accelerate it or by reducing the scope of the project, which reduces the number of required activities.
Avoiding the estimation dance
Good project managers are pessimists. Things go wrong much more often than they go right in a project because of unforeseen circumstances. And every estimate is a contract. When estimates are exceeded — because of scope creep or other common issues — clients tend to punish the providers who developed the estimate. Padding estimates with additional time or money is usually much less problematic for contractors than being punished for being late. Many people and companies pad their project estimates to avoid exceeding them.
Here’s how it may go: A well-respected consultant spends a great deal of time setting up his WBS and laboriously works through the critical path to get a timing estimate for a project. Then he multiplies the estimate by 2 before giving it to his client. He says he does this for two reasons: No project ever has the same scope at the end as it does at the start, and clients always want a little more and don’t want to pay for it. So that’s why he multiplies the initial estimate by 2. However, he says that even this doesn’t provide enough padding in case things go wrong, so he multiplies the initial estimate by 3 to provide some padding and give him something like a P90 level of protection.
Padding (also known as sandbagging), however, sabotages the effort of making good project estimates. To avoid the near-endless back-and-forth negotiation process that fake estimates spark, try to keep your estimates clean. Use range estimates; they have some padding already built in. And be very careful about punishing employees for missing their targets if they create a good-faith, workmanlike estimate for their activity.
Accelerating the project
Sometimes a project manager needs to speed up a project. Fortunately, you can often do this by spending money on overtime, extra work crews, and other investments to shrink project duration. Spending money on an activity to accelerate its completion is called crashing the project. The trick is figuring out which activities to crash.
The traditional way to accelerate timing is to hit the cheapest activity to crash on the critical path. This works well in a lot of cases, but the critical path is defined by the expected estimate, not the worst-case estimate, which is probably more important for you to manage in an acceleration situation. So look at high-risk activities that are not on the critical path as candidates for crashing. Almost anything that has to do with the government or technology tends to be high-risk with respect to timing.
One PC manufacturer had a significant technology risk developing a portable with a new type of lithium battery. This was not on the critical path if the technology worked, but if the technology failed, it would have delayed the project. The company’s solution was to spend some extra money developing a more standard old-technology nickel-cadmium battery in parallel to the lithium battery. If the lithium batter failed, the firm would just substitute in the nickel-cadmium battery, preventing a late completion of the project.