
Chapter 19
Ion Exchange Membranes for Low Temperature Fuel Cells 1
19.1. Introduction
Since the 1960s, when Loebe in California first showed the application of cellulose membranes in the desalination of water under high pressure gradients, transport studies in membranes have become a flourishing field of research. The process of desalination under a pressure gradient across membranes is called reverse osmosis. The development of membranes from polymers (polyimides, polysulfones, etc.) with good chemical, mechanical and thermal properties promoted the desalination of water by reverse osmosis at competitive prices, for use in households and industries, overtaking the traditionally used flash distillation process [PUS 82], [BAU 62], [CAB 85].
On the other hand, the synthesis of polyelectrolytes centered the interest of numerous researchers because of the potential of these materials, in the form of ionexchange resins and ion-exchange membranes, offer for ionic separations [SAT 02]. One of the applications which raised great interest was the use of ion-exchange membranes for electrical generation systems.
For the last forty years, polymeric proton exchange membranes (PEM) were proposed to be used as solid polyelectrolytes for fuel cells. Amongst their advantages (with respect to inorganic membranes), the ease of production, flexibility and good mechanical properties stand out [GRE 61]. The development of fuel cells in the last twenty years as an economically interesting alternative for the production of electricity, and their potential use in electric cars caused a burst of interest for ionexchange membranes. At present, great efforts are being focused on the development of ionic membranes that combine two at first sight contradictory properties: high proton conductivity and high selectivity or permselectivity. Because the two types of fuel cells, Polyelectrolyte Membrane Fuel Cells (PEMFC) and Direct Methanol Fuel Cells (DMFC), are used at temperatures near 100ºC, membranes used in these devices must also have high chemical stability in unfriendly working conditions. Cation-exchange membranes can also be used as polyelectrolytes in dry cell batteries.
In general, a polymeric ion exchange membrane is made up of crosslinked polymer chains with ionic groups of acid or base type covalently bonded to the chains. Membranes containing acid groups are called cation-exchange membranes, or negative membranes. In the presence of water the acid group dissociates into an anionic component covalently bonded to the membrane and a free cation. Membranes with fixed base groups are called anion-exchange membranes, or positive membranes. The positive part of the fixed group is covalently bonded to the membrane and the anion becomes mobile. While cation- and anion-exchanged membranes are used in numerous ionic separation processes, in the case of fuel cells (PEMFC and DMFC), only cation-exchange membranes in the acid form are used. This is due to the fact that acid membranes act as electrolyte paths through which protons produced in the oxidation of the fuel in the anode travel to the cathode where water is produced. For this reason, in the following, we particularly focus our attention on cation exchange membranes or negative membranes.
Depending on the ionic nature of the acid groups covalently bonded to the polymer chains, called fixed groups, cation-exchange membranes are listed as strong or weak. Strong acid membranes have, in most cases, fixed sulfonic acid (–SO3H) groups whose apparent pK varies between 0 and 1. However, strong proton exchange membranes can be prepared with fixed phosphonic –PO3H2 groups; these membranes exhibit pK1 = 2–3 and pK2 = 7–8. Acid membranes with much lower pK contain –CF2SOOH fixed groups in their structure. In this case, the high electronegativity of fluorine atoms considerably increases the acidity of the fixed group, the pK reaching the value of −6. Weak cation-exchange membranes contain weak acid fixed groups of type–COOH whose pK lies in the range 4–6. We must point out that the –CF2COOH group is strong and its apparent pK can reach the value of 2 because of the high electronegativity of the fluorine atoms bonded to the carbon in the α position with respect to the acid residue.
From a practical point of view, cation-exchange membranes used as polyelectrolytes in fuel cells must combine the following characteristics:
1) high ion exchange capacity (IEC); this property is measured by titration of the protons released, for example, in the ion-exchange reaction:
![]()
2) high proton conductivity; this is one of the principal properties for membranes used as solid electrolytes in fuel cells;
3) high permselectivity; an ideally permselective membrane is one in which a Faraday of current (96.480C) flowing through the membrane transports the equivalent of one proton. From now on, we shall call co-ions and counter-ions, respectively, the mobile ions of the same and opposite sign to the ions covalently bonded to the membranes;
4) low electro-osmosis; protons (and cations in general) moving from the anode to the cathode drag water, drying the membrane and decreasing its conductivity;
5) weak free diffusion of electrolytes in the membrane; this property, very important in separation processes, is not so important in fuel cells;
6) high chemical stability; ion exchange membranes are used in chemically unfriendly environments;
7) high mechanical resistance and good dimensional stability;
8) high thermal stability; this characteristic is very important in fuel cells;
9) low fuel crossover.
A large number of the properties mentioned above, and which optimize the performance of membranes, are mutually incompatible. For example, a high IEC increases the conductance of membranes but may decrease the mechanical properties and dimensional stability. Consequently, the preparation of membranes requires the reaching, in some cases, of a suitable balance among incompatible properties [KOT 02], [WIH 02], [KOT 01].
For reasons related to osmotic phenomena, which will be discussed later, ionexchange membranes swell in an aqueous medium, a process that, if excessive, decreases the mechanical properties. To decrease membrane swelling, the polyelectrolyte chains of ion-exchange membranes must be crosslinked with crosslinking agents. The crosslinking process reduces the length of the elastic chains of the polyelectrolyte, and consequently, the membrane swelling. Although crosslinking reduces the conductance of polyelectrolytes, this process does not always negatively impact on the permselectivity of membranes because the size of the pores is also reduced. In other words, the optimal density of crosslinking points is the result of an optimal balance between ohmic resistance acceptable to ion transport, permselectivity and mechanical stability. In conclusion, good performance membranes must exhibit excellent selectivity and low resistance to ion transport, combined with high mechanical resistance and a long average lifetime in working conditions.
19.2. Homogenous cation-exchange membranes
The first ion-exchange membranes were developed in the 1930s by the dispersion of ion exchange resins in polymers which act as binders. These membranes are of a heterogenous type. Homogenous membranes are characterized by a homogenous distribution, at the microscopic scale, of ionic groups in the membranes phase. Although the interest for heterogenous membranes is currently growing, most research in cation-exchange membranes has been carried out in homogenous membranes.
Owing to their thermal stability, the most interesting materials for the preparation of homogenous membranes usable in fuel cells utilize perfluorinated polymers [MAU 04], [HICK 04]. The general structure of Nafion, a representative of this type of polymers, is represented in Figure 19.1. The membranes based on these materials contain hydrophobic (-CF2-CF2-) and hydrophilic (-SO3H) regions. The fact that the values of x, y and z in Figure 19.1 can be adjusted allows the properties of the ion exchange membranes to be varied at will. These membranes present good electrochemical properties combined with high chemical stability, but have high cost, poor thermal properties and are environmentally unfriendly. The perfluorinated membranes are only useful in fuel cells which produce electricity from hydrogen. They are easily permeable to fuel reformers, such as methanol. Methanol crossover causes secondary reactions in the cathode that reduce fuel-cell performance.
The use of non-fluorinated polymers such as aromatic polyesthers, polybenzimidazolees, polyimides, polysulfones, poly(aryl sulfone ether) and polyketones containing acid functional groups are alternative materials that awakened the interest of researchers in membranes [HIC 04], [R&D 03], [LI2 03], [MAU 04], [JAN 03]. Good performance membranes can be prepared from polyarylene-ether-sulfone [ZHA 01]. Grafting of polystyrene onto polystyrene sulfonate ionomers allows the preparation of membranes with acceptable electrochemical properties for their use in fuel cells or as polyelectrolytes in dry cell batteries [DIN 01]. Descriptions of the grafting of polystyrene onto partially fluorinated polymers, such as polyvinylidene fluoride, using γ radiation, have been reported. The grafted polystyrene was subsequently sulfonated and used to prepare cation-exchange membranes [ENN 99]. The synthesis of the acid 9.9b (4-aminophenyl) fluorene-2,7-disulfonic has been recently described. The reaction of this product with 1,4,5,8- tetracarboxil naphtalene dianhydre led to the formation of sulfonated polyimides which allow the preparation of high conductivity cation-exchange membranes [GEN 01], [COR 03].
Polymers used in membranes should have high glass transition temperature, good chemical stability and good mechanical properties. The introduction of acid fixed groups in the membrane can be made by sulfonation with concentrated sulfuric acid SO3, chlorosulfonic acid, acetyl sulfate or other methods depending on the membrane [GUO 99], [HAR 03], [GEN 01], [WIL 02]. Whenever possible, it is preferable to use polymers obtained from sulfonated monomers or sulfonated pre-polymers. In this way, membranes with homogenous distribution of ionic fixed groups in their structure can be obtained.
19.3. Heterogenous ion exchange membranes
The development of heterogenous ion exchange membranes has recently awakened great interest. Membranes of this type were prepared by dispersing commercial ion exchange resins, of a sulfonated polystyrene/divinylbenzene type, into perfluoride polymers, such as vinylidene polyfluoride, which act as a binder [LÓP 01]. Mixtures of polyelectrolytes and semicrystalline polymers were also prepared, for example, by blending sulfonated EPDM with semicrystalline polypropylene.
The main obstacle for the large-scale commercialization of fuel cells containing organic membranes as solid electrolytes are the low protonic conductivity of low hydrated cation-exchange membranes, as well as the high methanol permeability and poor mechanical properties of these materials above 130ºC. These drawbacks could be overcome by developing composite membranes consisting of fillers in the shape of small-size particles dispersed in a polymer matrix. The fillers used are silica, heteropolyacids, layered metallic phosphates and phosphonates. In this sense, the preparation of membranes containing high conductivity zirconium phosphonate as filler particles has been reported [YAN 04], [ULB 06], [HOG 05], [ALB 03]. In general, all PEMFC composites are obtained by dispersing organic or organo-inorganic particles (with or without ionic groups) in polyelectrolytes in the acid form On the other hand, conductive membranes can also be obtained from porous non-conductive polymers blended with ionomers or high conductivity particles [HIC 04]. Maurits et al. [MAU 00], [MAU 02], created a wide variety of nanocomposites formed by organic polymers and inorganic oxides in order to increase the quantity of water absorption in the polymer matrix, to reduce the methanol permeability and to increase the mechanical properties of the composite membranes [MAU 00, 02], [MIY 01].
Nano and micro fillers (depending on the particle size) are used in the development of composite membranes. There are two methods to accomplish this task:
a) dispersion of nano or micro particles in a polyelectrolyte solution, followed by the elimination of the solvent by evaporation;
b) growth in situ of particles in a membrane or in a polyelectrolyte solution.
We shall present below a few examples of materials used to obtain composite cation-exchange membranes.
Metal oxides have been used as fillers. Polymeric membranes with silica or zirconia have been prepared in different ways, either by dispersion of particles in a polyelectrolyte solution or by depositing in situ the solid in the polymeric matrix. The conductivities of the composite membranes were higher than those of the pristine polyelectrolytes and other properties around 100ºC, such as methanol crossover and water permeability, improved [KRE 98, 01], [DIM 02], [MIY 01], [HOG 01, 05].
In the group of layered phosphates, phosphate-antimonic acids present swelling properties similar to smectites as well as strong acid character and high proton conductivity. The incorporation of these materials in a polymer matrix, for example in a sulfonated polysulfone, improves the conductivity and reduces both the gas crossover and membrane swelling. In this group of materials, metal phosphates (IV) such as α-ZrP are included. This phosphate does not modify the conductivity mechanism of the hydrated membranes. In the vicnity of 130ºC, the performance of the pristine membrane is better than that of the composite membrane containing the phosphate owing to a better retention of water; in the vicinity of 130ºC the pristine membrane exhibits better retention of water and the deterioration of the membrane decreases [HOG 01, 05].
Finally, metal phosphonates with layered structures exhibit high conductivity [ALB 97]. Up-to-date results indicating the positive effects of these materials as fillers have not been reported, and in some cases the conductivities are lower than those of the pristine membranes. These materials have also been employed as fillers of porous membranes, though their use is limited by the mechanical properties, flexibility and mechanical resistance of the membranes obtained. If this limitation is surpassed, the preparation of composite membranes using these fillers would be interesting owing to the wide variety of composite acid membranes that can be prepared with conductivities of the same order as Nafion in the temperature range 130–160ºC, but at lower cost [HOG 01, 05].
In the efforts that are being made to develop membranes with optimal properties for fuel cells (PEMFC and DMFC), our research group is working on the preparation of composite membranes based on Nafion and styrene-b-(ethylene-1-butadiene)-b-styrene (SEBS). As fillers, sulfonated phenyl silica and sulfonated phenyl-sepiolite are being used [FER 07], [del RIO 05].
19.4. Polymer/acid membranes
Membranes formed by polymers containing groups of the basic type (ether, amine or imine groups) were developed with characteristics good enough to be used in fuel cells. The membranes can be doped with strong acids, such as H3PO4. A polymer of this type is polybenzimidazole (PBI) (pK = 5.5). Membranes obtained by immersing PBI in phosphoric acid noticeably increase their conductivity and thermal stability.
Moreover, the doped polymer presents good mechanical resistance up to 200ºC [BUC 88]. Considering that the modulus of PBI is three times that of Nafion, polybenzimidazole membranes with low hydrogen permeability and thinner than Nafion can be prepared. It has ben shown that membranes of this type can be used at temperatures greater than 150ºC [WAI 95]. Therefore, in these working conditions, fuel cells having doped PBI as solid electrolyte could operate using hydrogen fuel containing about 1% (v/v) of carbon monoxide. It is possible that the dopant phosphoric acid does no shrink from the polymeric matrix as a result of the strong phosphoric-PBI interactions. Moreover, the nitrogen protonation of the imine functions leads to the formation of hydrogen-bonded networks. The lack of data on durability does not permit us to know if the phosphoric acid is mantained for a long time in the membrane. If that were not the case, the conductivity of the membrane would be considerably reduced.
19.4.1. Membranes prepared from polyme blends
In the same way as PBI/H3PO4 membranes, polyelectrolytes based on blends of acid and basic ionomers have been prepared. A representation of how ionomers react is shown in Figure 19.2.
The acid component of the blend can be sulfonated poly(ether-ether-cetone) or polyether sulfone or ortho-sulfone-sulfonated poly(ethersulfone) whereas the basic component can be polybenzimidazole. The membranes present excellent thermal properties, since their decomposition temperature ranges in the interval 270–350ºC, as well as good proton conductivities. However, only limited durability of the order of 300h has been demonstrated in direct hydrogen fuel cells at 70ºC [WAL 99].
Another blend which is subjected to investigations is that composed of sulfonated phenylene polyoxide and poly(vinylidene fluoride). In this case, the non-ionic component noticeably improves the proton conductivity of the blend. It should be noted that the performances of these blends in direct hydrogen fuel cells, at 45ºC, are reported to be higher than that of the Nafion 112 membrane [WAL 99].
19.5. Characterization of membranes
A series of characteristics of membranes involving morphology, chemical structure, concentration of ionic fixed groups, as well as the chemical nature of the filler dispersed in the polymeric matrix in the case of composite membranes, affect the physico-chemical phenomena observed in ion exchange membranes. Among them, the following phenomena can be mentioned: cationic or anionic permselectivity, generation of an electromotive force when the membrane is flanked by solutions of the same nature but different concentration, ionic conductivity, electrolyte diffusion, osmotic and electro-osmotic processes, etc. These phenomena, which characterize the electrochemical behavior of ion exchange membranes, are addressed below.
19.5.1. Nernst-Planck flux equation
In numerous applications, ions travel across ion exchange membranes under combined driving forces of chemical and electrical potential gradients. Let us first consider the flux of an ion i under the action of a unidimensional electrochemical potential gradient dμ/dx. The flux of the ionic particle i, Ji, in a point in the membrane depends on the velocity ui and the concentration ci of the particle in that point such that Ji=ciui. On the other hand, in steady state conditions, the acceleration of the particle caused by the chemical gradient driving force is dissipated by the friction of the particle with its surroundings. In this case, dμi/dx+χiui =0, where χi is the friction coefficient, and the particle flux is expressed by [SCH 62], [YAM 64]:
where the Einstein equation χi =RT / Di which relates χi the ionic diffusion D was used. In isobaric and isothermal conditions, dμi =RT d ln(ciγi), where γi is the activity coefficient of the particle i. Then, Jiμ can be written:
If the driving force responsible for the flux is the electric potential gradient dψ/dx, the electrical charge transported by mol of the particle i is ziF where F and zi are, respectively, Faraday’s constant and valence of the ionic species i. Consequently, the impulsive force by mol of the particle i is ziFψ/dx. In steady-state conditions ziFψ/dx+χiui =0 and the flux of the particle caused by the electric potential gradient is given by:
In this equation, the quantity ![]() represents the ionic mobility of the particle i, which is generally expressed in cm2/V.s units. The total flux of the particle i under the combined action of chemical and electrical potential gradients can be written as: Ji = Jiμ + Jiψ, or:
represents the ionic mobility of the particle i, which is generally expressed in cm2/V.s units. The total flux of the particle i under the combined action of chemical and electrical potential gradients can be written as: Ji = Jiμ + Jiψ, or:
where Ji is generally expressed in mol/(cm2 s). Ion-exchange membranes contain fixed ionic groups covalently bonded to the polymer chains, counter-ions, co-ions and water. Moreover, the electroneutrality principle indicates that the sum of all charges in the membrane phase is zero. Consequently, the concentration of counter-ions is higher than that of co-ions. Then counter-ions impart more moment than co-ions to the liquid located in the pores of the membrane. The result is that under the electrical potential driving force, the center of gravity of the liquid pore moves with velocity v with respect to the membrane and its flux, called convention flux, is Jconv = civ. Taken the membrane as reference frame, the flux of the particle i is:
This expression, named generalized Nernst-Planck equation, describes the absolute flux of the specie i through an ion exchange membrane taking the membrane as reference frame. The convention velocity can be estimated [SCH 62] by assuming that the concentration of ionic charges in the liquid of the membrane is FX/ε, where e is the volume fraction of liquid pore in the membrane. X represents the concentration of fixed ions in the membrane in mol/cm3. As the charge of the liquid pore is ωFX/ε, where by the electroneutrality principle ω is −1 for cation exchange membranes and +1 for anion exchange membranes, the force acting on the liquid pore is F = (ωFX/ε) (dψ/dx). In steady-state conditions, F + ρ0ν = 0, where ρ0 is the specific resistance of friction of the charged liquid pore against the pore walls. In this case, the pertinent expression for ν is:
where ρ0 has g/(s.cm3 of liquid pore) units and ![]() is the liquid pore mobility which can be expressed as:
is the liquid pore mobility which can be expressed as:
In the absence of chemical potential gradients, i.e. when the ionic solutions separated by the membrane have the same concentration, the flux equation for the species i can be written as:
The liquid pore mobility is generally expressed in cm2/ V s units.
19.5.2. Osmotic phenomena and electric potential
Owing to the presence of fixed ions in their structure, ion exchange membranes swell in water until the chemical potentials of this solvent in the membrane phase and in pure water are equal. If the membrane is immersed into an electrolytic solution, water and electrolyte ions of the solution diffuse inside the membrane, verifying at any point the electroneutrality principle:
In isothermal conditions, the chemical potentials of water in the solution which surrounds the membrane, μw, and in the membrane phase, ![]() , are:
, are:
where μ0 is the chemical potential in standard pressure and temperature conditions, VW is the partial molar volume of the solvent, aw and ![]() represent, respectively, the activity of water in the solution and in the membrane. When equilibrium is reached,
represent, respectively, the activity of water in the solution and in the membrane. When equilibrium is reached, ![]() and equations [19.10] and [19.11] lead to the following expression:
and equations [19.10] and [19.11] lead to the following expression:
where π is the osmotic pressure.
Consequently, the immersion of a dry ion exchange membrane in water swells the membrane and can even dissolve it, unless the cohesive forces of the molecular chains are able to support the osmotic phenomena. To avoid this process, membranes are crosslinked with crosslinking agents, thus increasing the elastic modulus and reducing swelling.
In principle, when a membrane separates two ionic solutions of different concentration, the solvent flows from the lower- to the upper concentration solution to balance the difference of chemical potential of the solvent in both solutions. In the case of ion exchange membranes surrounded by electrolytic solutions of the same nature but different concentration, fluxes of solvent larger than those predicted by the chemical potential difference (positive anomolus osmosis) may occur. In some cases, even fluxes of solvent in the opposite direction to that imposed by the chemical potential difference, i.e. from the diluted to the concentrated solution (negative anomolous osmosis) may take place. In general, these anomalous phenomena are observed in very porous membranes with high ion-exchange capacity. Anomolous osmosis is explained by the action of the two forces responsible for the flux of water: the pressure gradient due to the osmotic pressure which causes the solvent flow from the less to the more concentrated solution and the electric potential created in the membrane phase. Actually, the liquid pores of the membrane contain mobile ions which balance the fixed charges covalently bonded to the polymeric chains of the membrane. If the difference of mobility between the counter-ions and co-ions is high, the ion with higher mobility diffuses rapidly through the membrane producing a space charge, with the same sign as the ion, on the side of the membrane in contact with the less concentrated solution; consequently, the space charge on the side of the membrane in contact with the concentrated solution has an opposite sign. In this way, a diffusion potential is created.
To get a deeper insight into this matter, let us assume that the mobility of counter-ions in a cation exchange membrane is higher than that of co-ions. The counter-ions will move rapidly from the membrane phase in contact with the concentrated solution towards the phase in contact with the dilute solution creating a higher electrical potential on the side of the membrane in contact with the diluted solution than on the other one. Since the mobile liquid pore in the membrane phase (water, counter-ions and co-ions) contains on average a net positive charge, the potential created promotes the displacement of the liquid pore from the side of the membrane in contact with the diluted solution (higher potential) to the side in contact with the concentrated solution (lower potential). The liquid transport caused by the electrical potential adds to the osmotic transport arising from the chemical potential; consequently, it is responsible for the positive anomolous osmosis. On the other hand, if co-ions have higher mobility than counterions, a similar reasoning shows that the anomalous osmosis is of negative type whenever the flow arisen from the electric field caused by the mobility of co-ions is larger than that caused by the chemical potential. Negative abnormal osmosis can occur, for example, in anion-exchange membranes (positive membranes) with protons as co-ions. The high mobility of protons leads to the development of a potential which causes the transport of the negatively charged liquid pore from the concentrated to the diluted solution [SAT 02], [YAM 64].
19.5.3. Ionic diffusion in ion exchange membranes
For membranes used in ionic separation processes, free diffusion of electrolyte decreases membranes performance. From the Nernst–Planck equation, the flux of cations, J+, and f anions, J−, can be expressed as follows:
where z+ and z− are the cation and anion valences, respectively, while c+ and c− represent the respective concentrations. If the solutions are sufficiently diluted such that the activity coefficients (γ+, γ−) are equal to 1, the flux of cations is given by
In the development of this equation, the electroneutrality principle which requires that ![]() , where X is the concentration of fixed ions, was considered. By comparing this equation with Fick’s first law, a global diffusion coefficient can be defined as:
, where X is the concentration of fixed ions, was considered. By comparing this equation with Fick’s first law, a global diffusion coefficient can be defined as:
If z+ = z− equation [19.16] leads to:
where ![]() and
and ![]() represent, respectively, the molar fractions of cations and anions in the membrane. Obviously,
represent, respectively, the molar fractions of cations and anions in the membrane. Obviously, ![]() and, in this case, the less concentrated ionic species in the membrane phase controls the diffusion [LAK 69], [SAT 02]. Consequently, the flux of cations in cation exchange membranes is given by:
and, in this case, the less concentrated ionic species in the membrane phase controls the diffusion [LAK 69], [SAT 02]. Consequently, the flux of cations in cation exchange membranes is given by:
In the case of anion-exchange membranes, the equivalent expression is:
19.5.4. Electromotive force of concentration cells and transport number
The interphase separating a bulk solution from a membrane gives rise to a discontinuity in the concentration of electrolyte in the solution-membrane interphase as a consequence of the rejection of co-ions by the fixed ions of the membrane. However, the chemical potential is continuous in this region.
Let us consider an ion exchange membrane separating two solutions of the same nature, but with different concentration. Let us assume further that the electromotive force of the cell is measured with calomel electrodes, using the following configuration: Hg / Hg2Cl2/ bridge of saturated KCl / bridge of the saturated electrolyte / concentration of electrolyte (c1)/ cation exchange membrane / concentration of the electrolyte (c2) / bridge of the saturated electrolyte / bridge of saturated KCl / Hg2Cl2/ Hg. This configuration corresponds to a concentration cell. Owing to the saturation of bridge electrolytes, the electrodes do not contribute to the electromotive force E of the concentration cell. In reversible conditions, ionic transport gives rise to a variation of free energy related to the electromotive force of the cell by:
where F is Faraday’s constant. The transport number of the mobile ionic species i, ti, represents the number of equivalents of the ion i transported by Faraday of current, its maximum value being the unit. The fact that the current in the membrane is transported by counter-ions and co-ions leads to:
The variation of free energy is related to the chemical potentials of the ionic species by:
where zi is the valence of the ionic species i, μi =μ0i + RT ln ai and t/zi represents the moles of i transported by Faraday of current. Equations [19.20] and [19.22] lead to:
To integrate equation [19.23] it is necessary to know the dependence of ti on the concentration of the species i in the membrane. However, for low concentrations, transport numbers can be assumed to be constant, and equation [19.31] becomes:
where a+ and a- are, respectively, the activities of cations and anions in the solutions flanking the membrane. For a 1:1 electrolyte solution (zi = 1) it is assumed (a+)2/(a+)1 = (a−)2/(a−)1 = (a)2/(a)1. For an ideal selective membrane, t+ = 1 and the electromotive force for the monovalent electrolyte reaches its maximum value given by:
Hence the transport number of the monovalent cation is related to the electromotive force of the concentration cell by:
19.5.5. Conductivity
Though proton diffusion in cation exchange membranes is still a poorly understood phenomenon, the process probably involves the dissociation of the proton from the acid site, subsequent transfer of the proton to the aqueous medium, screening by water of the hydrated proton from the conjugate base (i.e the anion of the fixed group) and, finally, diffusion of the proton in the water enclosed in the confined water in the polymeric matrix [PAD 03]. Consequently, the relationship between proton mobility and the quantity of water contained in the membrane is a critical factor in the conductive process. In fuel cells, good performance membranes must remain hydrated in working conditions. At the molecular level, the transport mechanism of protons in hydrated membranes is generally described either by the vehicle mechanism in which the proton diffuses through the media together with the vehicle (i.e. water, with water as H3O+) or by proton hopping (proton transferred from one water molecule vehicle to other) or Grotthuss transport which usually involves the reorientation of solvent dipoles, an inherent part of establishing the proton diffusion pathway [POU 92], [KRE 98, 01], [PAD 03]. This ambiguity poses a problem for the development of models predicting proton transport in new cation-exchange materials [TUC 97]. There are, however, a few empirical rules to predict protons transport in membranes.
As indicated above, the water content of cation-exchange membranes in the acid form governs proton transport in these materials. Water allows the segregation of hydrophilic moieties of the polyelectroyte chains from hydrophobic ones giving rise to the formation of hydrophobic and hydrophilic domains. In high conductive membranes, hydrophilic domains form percolation paths through which protons travel from the anode to the cathode of fuel cells.
It is important to develop new polyelectrolyte materials which combine a good segregation of hydrophilic domains from hydrophobic ones with acceptable water content. For example, the proton conductivity of Nafion at room temperature may vary between between 0.01 and 0.1 S/cm, depending on the humidity of the membrane, but it drops several orders of magnitude when the water content comes near to about two moles of water/moles of fixed anionic groups in the membrane [YAN 04], [ALB 03], [ATK 03]. The transport of protons through membranes is especially related to the diffusion mechanisms of these particles in water that involve transport of the protonic charge between two stables forms of the hydrated proton called the Zundel ion (H5O2+) and the Eigen ion (H9O2+), [PAD 03]. Acid contamination may increase the apparent conductivity of membranes.
In the case of composite membranes, recent studies have shown the difficulty involved in the development of models that explain proton transport in this kind of material. However, some research focused on the understanding of proton transport and the mechanisms involved in this process in nanocomposite membranes have been reported. Interest has been focused on the increase of the membrane wettability by adding hydrophilic fillers, such as organo-organic solids properly functionalized with sulfonic acid groups (for example: silica, sepiolite, SBA-15, among others). These fillers are hygroscopic because they keep water trapped in their cavities at temperatures near 250ºC [FER 07].
There are other types of composite membranes obtained by dispersing conductive fillers in the polymeric matrix (for example: α-ZrP). The fillers decrease the permeability of water and methanol in the membranes as well as the molecular migration of other species. If the humidity of the composite membrane decreases a loss of conductivity is oberved.
A third generation of membranes have been prepared from composites obtained by dispersing proton conducting fillers, such as heteropolyacids and acid doped polybenzimidazole, in polymer matrices [HOG 05]. In this case, an acid of high conductivity is immobilized in the polymeric matrix so that the protonic conductivity is independent of the humidity of the membrane, and the electro-osmotic flux is reduced. In the same way, we can mention the use of acid solids such as zirconium phosphates and their by-products in PEMFCs [ALB 92, 95, 97].
From a phenomenological point of view, the electrical current flux, j, through an ion exchange membrane in equilibrium with an electrolyte solution of concentration c, promoted by an electrical potential gradient dψ/dx, is given by:
Equations [19.8] and [19.27] lead to:
Given that in the liquid pore ![]() , equation [19.28] takes the form:
, equation [19.28] takes the form:
On the other hand, the specific conductance is given by: ![]() and, consequently, this quantity can be expressed in terms of the ionic and pore liquid mobilities by:
and, consequently, this quantity can be expressed in terms of the ionic and pore liquid mobilities by:
19.5.6. Electro-osmosis
An electric current flowing through a membrane which separates two solutions of the same electrolyte, of concentration c, causes a net transport of water from one side to the other side of the membrane. For a cation-exchange membrane, the current is transported by cations from the anodic compartment to the cathodic one. Cations not only carry the hydration water associated with them, but also drag water in their motion in such a way that a large part of the flux of water promoted by the current corresponds to dragged water. The term electro-osmosis describes the total flux of water, independently of the transport mechanism. Electro-osmosis plays a negative role in fuel cells because protons traveling from the anode to the cathode compartments across a cation-exchange membrane in the acid form drag water in the membrane phase, drying it. This phenomenon decreases the conductivity of the membrane. It must be pointed out, however, that the reaction of oxi-ions with protons in the cathodic compartment forms water that back-diffuses across the membrane, thus contributing to its humidification.
Since the sign of the liquid pore in the membrane phase is the same as that of counter-ions, equation [19.6] indicates that the velocity of the pore caused by the electrical potential gradient dψ/dx is given by:
Obviously, the volume of solvent flowing per time unit is:
As indicated in section 19.5.1, ε is the volume fraction of liquid in the membrane and ρ0 the specific friction coefficient.
The electro-osmotic permeability coefficient is defined as:
where j is the current density. From equations [19.29], [19.30], [19.32] and [19.33] the electro-osmotic permeability is expressed in terms of the characteristics of the membrane by:
This equation suggests that Dj is directly proportional to the ion-exchange capacity of the membrane and inversely proportional to the specific coefficient times the conductivity. A balance of matter in the electrosomotic process leads to
The transport number of water, tw, is therefore:
where Vw and Vi represent, respectively, the partial molar volumes of water and and the ionic species i.
19.5.7. Thermodynamics of irreversible processes and transport numbers
Ion exchange membranes are non-ideal barriers through which the solvent and the solution can flow under the action of different forces, such as gradients of concentration, pressure, temperature and electrical potential. In isobaric and isothermal conditions, the forces are reduced to concentration and electrical potential gradients. The model subsequently described expresses the electromotive force of a concentration cell as a function of observable variables only [GAR 92, 94]. The model can also be used in the case of multicomponent systems [GAR 97], [COM 94], but this section will be restricted to the case of a single electrolyte solution.
Let us consider the configuration Ag/AgCl ionic aqueous solution (cL)/cation exchange membrane/ ionic aqueous solution (cR) AgCl/Ag, in which the electrolyte is dissociated in its cationic and anionic components ![]() . From the thermodynamics of irreversible processes, the dissipation of local energy in each point of the membrane Ψ is given by:
. From the thermodynamics of irreversible processes, the dissipation of local energy in each point of the membrane Ψ is given by:
where, i = +, is the electrochemical potential of the ion i, μw and jw are respectively the chemical potential and the flux of the solvent (water), respectively, and ji, (i=+,−), represents the flux of ionic species using the membrane as reference frame.
Let us now assume that the electrodes are reversible to the anion of the electrolyte. The electric potential gradient measured at equilibrium in the interphases solution-electrodes, dΨ/dx, is related to the electrochemical potential gradient of the anion by [GAR 00]:
where F represents the Faraday constant and z- is the valence of the anion. From equations [19.37] and [19.38] we obtain:
where ![]() is the electric current density and
is the electric current density and ![]() is the chemical potential of the electrolyte. From the electroneutrality principle,
is the chemical potential of the electrolyte. From the electroneutrality principle, ![]() and the Gibbs–Duhem equation
and the Gibbs–Duhem equation ![]() , where c2 and c1 are the concentrations of the solution and water, respectively, the dissipation function becomes:
, where c2 and c1 are the concentrations of the solution and water, respectively, the dissipation function becomes:
where:
is the matter flux density of the cation, taking the center of gravity of the solvent as frame of reference.
According to the thermodynamics of irreversible processes, fluxes are linear functions of forces and therefore equation [19.40] allows the following transport equations to be stated:
Since the Onsager coefficient matrix is symmetrical (λ12 = λ21), these equations can be transformed into [GAR 97]:
where D2w is the diffusion coefficient of the electrolyte, t+w is the transport number of cations using the solvent as reference frame, and κ is the electrical conductivity.
If the current density is zero, the previous equation leads to:
where E is the electromotive force of the concentration cell, τ+=t+w / z+ is the reduced apparent transport number which expresses the number of moles of counter-ions transported by a Faraday current and l is the membrane thickness.
Let us analyze the relationship between t+w and the transport number of counterions taking the membrane as a frame of reference, represented by t+. The parameter t+w is given by:
By considering the relationship between the flux of cations with respect to the liquid in the membrane, jw, and with respect to the membrane, j+, equation [19.41] leads to:
where ![]() and tw is the transport number of water associated with the electro-osmotic processes. Accordingly,
and tw is the transport number of water associated with the electro-osmotic processes. Accordingly, ![]() and the difference between these parameters increases as the electro-osmotic permeability increases.
and the difference between these parameters increases as the electro-osmotic permeability increases.
According to equation [19.44], the electromotive force of concentration cells is a complex function of the external concentration profile of salt in the membrane. For homogenous membranes, the electromotive force is simplified to:
In this case the reduced apparent transport number τ+ can be estimated from the equation:
By assuming an average value for τ+ throughout the membrane, equation [19.47]) becomes:
In this equation R is the gas constant, ν = ν++ ν−, τ+ is the average value of the apparent reduced transport number of counterions in the membrane, taking as reference frame the center of gravity of the solvent, whereas aR and aL represent, respectively, the activities of the electrolyte solutions on the right and left compartments of the concentration cell [COM 94].
For a binary electrolyte of monovalent ions, equation [19.49] reduces to:
The advantage of the deduction presented here is that the electromotive force of concentration cells is obtained in a much more direct manner than using other alternative approaches [GAR 00].
19.6. Experimental characterization of ion exchange membranes
The characterization of ion exchange membranes for use in fuel cells involves:
1. Measurement of water sorption.
2. Determination of the ion exchange capacity.
3. Measurement of the transport number of protons.
4. Determination of membranes conductivity.
5. Measurement of the water transported by electro-osmosis.
6. Measurement of reformers (methanol) permeability in membranes.
7. Determination of the morphology of membranes.
8. Thermal stability of membranes.
19.6.1. Water sorption
Membranes previously dried in high vacuum are equilibrated in atmospheres of different relative humidity. The thickness of the membranes may be recorded as a function of the water content of the membrane and the value of this quantity can be further used in experiments related with the assembly membrane electrodes, impedance spectroscopy, etc. To measure the maximum water sorption of membranes, or water uptake, the following methodology is currently used. The dry membrane is weighed and then immersed in distilled water for 72 hours. Then the membrane is gently blotted with filter paper and weighed again. The weight measurement is repeated five times to obtain an average value. The water uptake is calculated by means of the following expression:
Illustrative results obtained for different ion exchange membranes are shown in Table 19.1.
19.6.2. Determination of the ion exchange capacity
The measurement of the ion exchange capacity of membranes gives the number of moles of ionic fixed groups covalently bonded to the polyelectrolyte chains per g of dry membrane. For this purpose, dry membranes are immersed in a solution of HCl 0.5 N for 5 hours, in the case of strong ion exchange membranes, and 5 days for weak ion-exchange membranes. The system is stirred during this interval of time. Then the membranes are washed several times with distilled water and immersed again in a solution of NaCl 1 N for 5 days. During this period the system is stirred. The objective is to exchange the protons of the acid membrane for Na+ ions. The protons released by the membrane in the ion-exchange reaction are then titrated with an alkali solution. From the titration the ion-exchange capacity of the membrane is obtained. For orientative purposes, a few representative results obtained in a few membranes studied by our research group are presented in Table 19.1.
Table 19.1. Sorption of water and ion exchange capacity for different membranes: *[COM 07], **[COM 08],***[PAR 08]
Owing to swelling effects, membranes with high ion-exchange capacity may exhibit in numerous cases a relatively low concentration of protons in the water pores. For example, the ion exchange capacity and water uptake for the PSS membrane in Table 19.1 are, respectively, 2.06 meq H+ and 0.267g H2O per gram of dry membrane. The membrane has 7.72 meq. H+/g H2O, a quantity only somewhat higher than that of Nafion (6.72 meq. H+/g H2O) with IEC =1.35 meq. H+/g dry membrane.
19.6.3. Measurements of transport number and mobility of protons in membranes
An alternative procedure to the Hirthof method [ATK 78] to determine the transport number of protons in cation-exchange membranes in the acid form is the use of concentration cells [SAT 02], [LAK 69] made up of two compartments separated by the membrane. The compartments are filled with HCl solutions of different concentration. Symmetric Ag/AgCl electrodes located in each compartment are used to monitor the electromotive force of the cell. The solutions are strongly stirred by means of magnetic stirrers to reduce the membrane-solution interphase to a minimum. The electrodes are connected to a potentiometer and the electromotive force of the concentration cell is recorded as a function of time.
The potentials of Ag/AgCl electrodes in the previous configuration contribute to the electromotive force (emf) of the concentration cell. The observable emf can be measured straightforwardly after pouring the solutions in the cell (t → 0) (initial time method), and also when the system reaches steady state conditions (t → ∞), [COM 94, 97]. The symmetry of the membranes is controlled by exchanging the concentrations of solutions in the semi-cells. If the difference of the observed emfs is practically zero, the membrane is considered symmetrical and quasi-homogenous [COM 97].
By assuming an average value for the transport number in reduced form ![]() , the integration of equation [19.47] for HCl solutions (ν+ = ν− = 1) becomes:
, the integration of equation [19.47] for HCl solutions (ν+ = ν− = 1) becomes:
Figure 19.3. Representation of the observed emf as a function of ln(cL/cR) for the MF4SC and MF4SC-An membranes (Table 19.1), at 25ºC. The measurments were performed keeping CR=0.01 M. Straight lines in the figure were calculated by equation [19.52]
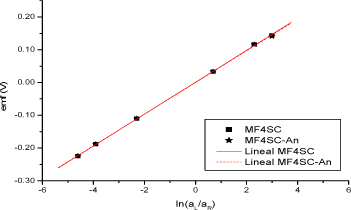
Values of emf for different concentrations (aR/aL) corresponding to the MF4SC and the MF4SC-An membranes are plotted as a function of log(aR/aL) in Figure 19.3. The plot shows that the emf of these systems is practically a linear function of the logarithms of the concentration ratio. This behavior suggests a slight dependence of the apparent transport number of protons on the concentration profile of HCl in the membrane, even though this profile is associated with a large range of concentrations. The method allows the estimation of ![]() for different concentration ratios [COM 94].
for different concentration ratios [COM 94].
19.6.3.1. Measurement of the mobility of protons
The density of electric current flowing in a membrane equilibrated with an electrolyte solution, under an electrical potential driving force, is given by:
Since the concentration of counterions across the membrane is constant, the relationship between the electrochemical potential and the electrical potential is ![]() For the reasons outlined in section 19.5.1, the flux of the species i across the membrane in these conditions is
For the reasons outlined in section 19.5.1, the flux of the species i across the membrane in these conditions is ![]() , where
, where ![]() is the ionic mobility.
is the ionic mobility.
Then the electric current density can be written as:
By considering Ohm’s law ![]() , where
, where ![]() is the average conductivity of the system, and taking into account equation [19.54], the following expression for the average conductivity is obtained:
is the average conductivity of the system, and taking into account equation [19.54], the following expression for the average conductivity is obtained:
For cation-exchange membranes equilibrated with water, the concentration of counterions is equal to the concentration of fixed anions covalently bonded to the matrix of the membrane; this concentration can be obtained from the IEC of the membrane. Then the electrical current flowing through the membranes is transported by counterions and equation [19.55] can be written as:
Accordingly, the apparent mobility of counterions in cation-exchange membranes equilibrated with water can be obtained from the conductivity.
19.6.4. Measurement of conductivity
Impedance spectroscopy is a technique widely used to characterize materials and interphases. One of the most important characteristics of this technique is the correlation which exists between the response of a real system to an electric perturbation field and that of an ideal model represented by electric circuits composed of discrete elements (capacitances, inductances and ohmic resistances) [MAC 87], [BOU 89].
The response of a membrane to a sinusoidal voltage signal of type V(t)=Vm sin (ωt), where ω is the angular velocity (ω=2πf, with f the frequency in Hz), is the intensity current I(t) = Im sin(πt+ θ), where θ represents the phase difference between the applied voltage and the current. Obviously when θ=0 the behavior of the system is purely resistive. The complex impedance of the system will be ![]() .
.
In the analytical description of conductive processes, equivalent electric circuits are used. The circuits are integrated by elements that represent the different macroscopic phenomena intervening in the transport of mass and electrical charge. Figure 19.4 shows different types of used circuits. In some cases, the relaxation processes observed in experiments can be easily interpreted by a simple equivalent circuit, as in those in Figures 19.4a and b, associated with a single relaxation time. However, in most cases the systems exhibit a distribution of relaxation times and the equivalent circuit consists of different circuits, like those described in Figure 19.4c and d. In general, it will be necessary to use a more complex analysis if complex polarization processes occurring in polyelectrolytes are accounted for. When nonlinear methods are used in the analysis, the values of the parameters that describe the model can be optimized by minimising the differences between the values measured for a given experimental dielectric quantity and those calculated with the model [COM 96]. Phenomenologically, resistances and capacitors account, respectively, for energy dissipation and accumulation of charges or energy storage. A parallel R-C circuit is a dielectric polarization model that describes relaxation processes associated with a single relaxation time τ (=RC) where the migration of free charges does not prevail.
Figure 19.4. A Debye RC model (a) and different types of circuits to describe the dielectric behavior of wet cation-exchange membranes in the acid form
Impedance measurements are performed by placing the membrane previously equilibrated with water, between two gold circular and parallel electrodes. The response of cation exchange membranes in the acid form to an alternating electric field may be described by a circuit composed of an ohmic resistance R0 connected in series with a parallel R-C circuit. The parameter R0 represents the resistance to proton transport in the membrane while the RC circuit accounts for the polarization phenomena taking place in the membrane. The complex impedance Z* of the system is:
Accordingly, the real, Z′, and loss, Z″, components of the complex impedance, Z*, are
Figure 19.5. Nyquist plot corresponding to the equivalent circuit (b) shown in Figure 19.4a. The maximum of the half circle corresponds to ωRC=1 where RC = τ < relaxation time [BOU 89]
As shown in Figure 19.5, The Z” vs Z’ plot, or Nyquist representation [NYQ 28], is a semicircle intersecting the abscissa axis at Z’ = R0 (ω→∞) and Z’ = R0 + Rp(ω→0) The representation of the impedance modulus as a function of the frequency or Bode diagram [BOD 56] is an alternative method to obtain the proton resistance of cation-exchange membranes in the acid form. As in the Nyquist plots: /Z*/ = R0(ω→∞) and /Z*/ = R0 + Rp (ω→0). Moreover, φ=tan−1(Z′/Z″) reaches a maximum (φ = 0) at the plateau (ω→∞).
As indicated above, complex systems present a distribution of relaxation times and the Nyquist diagrams are not semicircles but arcs. In these cases, the capacitance is not ideal so that the capacitor in the circuit is replaced by a constant phase element (CPE) whose admitance is expressed by:
where Y0 (Ω−1 s-n) and n (0 ≤ n ≤ 1) are empirical parameters that can be obtained by fitting the Nyquist diagrams to the experimental results [MAC 87]. The more n decreases, the more Nyquist plots depart from semicircles. However, as in the case of circuits with a single relaxation time, the arcs intersect the abscissa axis at ω→∞ (Z’ = R0) and at ω→ 0 (Z’=R0 + RP).
Two particular cases appear when the dependence of the impedance on n is considered: if n = 1, the capacitor of the equivalent circuit is ideal but if n = 0.5, the element is a Warburg impedance associated with a Fick’s diffusion process. In general, for complex processes, such as that shown in Figure 19.4d, the equivalent capacitance of the system Ceq can be determined by means of the relationship:
Accordingly, the dielectric behavior of complex systems can be studied by impedance spectroscopy (EIS) using equivalent electric circuits. From the values of the parameters that describe the models, information can be obtained concerning the the heterogenous behavior of the systems.
Finally, the proton conductivity can be obtained from R0 using the following expression:
where S and l are, respectively, the area and thickness of the membrane in contact with the electrodes.
Figures 19.6 and 19.7 present, respectively, the Nyquist and Bode diagram for EPDM-PP20% and EPDM-PP10% membranes equlibrated with water, at different temperatures [COM 07].
Figure 19.6. Nyquist plot for the EPDM-PP20% membrane in equilibrium with the water for different temperatures: from left to right 90, 75, 50 and 25ºC [COM 07]
Figure 19.7. Value of the impedance modulus, /Z*/ (filled symbols) and the phase angle (open symbols) for the EPDM+10%PP membrane equilibrated with water, at different temperature: (squares) 25°C, (circles) 50°C, (triangles) 75°C and (stars) 90°C
The points at which the arcs intersect the abscissa axis at high frequencies yield R0, at each temperature of interest. However, because of the coupling between the pure conductivity and relaxation processes taking place in the membranes/electrodes, the curves depart from arcs as frequency increases. Figure 19.7 shows the double-logarithmic plot of the complex impedance modulus, / Z*/ against log ω (Bode plot) for the EPDM-PP (10%) membrane of Table 19.1, at different temperatures.
Normally, / Z*/ rapidly decreases as frequency increases reaching a plateau in the high frequencies region. On the other hand, the phase angle reaches a maximal value (φ = 0) at the plateau, and the value of / Z*/ at the frequency at which φ reaches a maximum is assumed to be R0, the proton resistance of the membrane.
The Bode plots of Figure 19.7 show that the conductivity of the EPDM-PP(10%) membrane at 25°C is about one order of magnitude smaller than that reported for Nafion membranes, at the same temperature (1–7 S/m), [HIC 049], [MAU 00], [MAU 02].
The temperature dependence of the conductivity of EPDM-PP membranes roughly obeys Arrhenius behavior (Figure 19.8) with activation energies of 57 and 33 kJ/mol for EPDM-PP(10%) and EPDM-PP(20%) membranes, respectively (see Table 19.2 for details).
Table 19.2. Proton resistance R, and conductivity, κ, obtained from the Bode plots for EPDMPP (10%) and EPDM-PP (20%) sulfonated membranes in acid form under 100% RH [COM 07]
The activation energy associated with proton transport processes in these membranes is significantly lower than that reported for the transport of ionic carriers in non-polyelectrolytes or conventional polar polymers.
Figure 19.8. Arrhenius plot for the conductivity in S/cm of EPDM-PP20% (filled circles) and the EPDM-PP10% (open circles) membranes at equilibrium with 100% RH humidity atmosphere [COM 07]
19.6.5. Electro-osmotic measurements
The flux of solvent through ion exchange membranes dragged by proton transport is measured with electro-osmotic cells. The experimental device consists of two semi-cells separated by the membrane, according to the configuration: Ag/ AgCl / solution of HCl (c)/ cation exchange membrane in acid form / solution HCl (c) / Ag / AgCl.
Each semi-cell is provided with a capillary to measure the electro-osmotic flux from the displacement of liquid in the capillary. This device, in series with a coulomb-meter, is connected to a battery. The current causes the passage of water from the anode to the cathode. From the displacements of the capillary meniscus, which must be the same but in opposing direction, the change in volume ΔV by effect of the transported charge Q is measured. A balance of matter in the cathodic compartment allows the determination of the volume of water, ΔVe-o, dragged by the cations. For monovalent cations, the relevant expression is:
where ![]() and
and ![]() are, respectively, the partial molar volumes of Ag, electrolyte and AgCl, whereas t+, z and F are, respectively, the cation transport number, the valence of the cation M and Faraday’s constant. Then, the transport number of water arisen from electro-osmosis is given by:
are, respectively, the partial molar volumes of Ag, electrolyte and AgCl, whereas t+, z and F are, respectively, the cation transport number, the valence of the cation M and Faraday’s constant. Then, the transport number of water arisen from electro-osmosis is given by:
Because the conductivity of membranes increases with concentration of electrolyte at low concentrations, the electro-osmotic flux in membranes must decrease as the concentration of the solution increases, (see equation [19.34]; also Figure 19.10 in reference [SAT 02]).
19.6.6. Measurements of the permeability of reformers in membranes: methanol permeability in vapour phase
Though Nafion membranes present good chemical and thermal stability conditions, the large permeability of methanol in these materials decreases their performance when this reformer is used as fuel.
The permeability of reformers in ion exchange membranes can be measured by using pervaporation techniques. Pervaporation, like vapour permeability, is a separation process; the only difference between these techniques lies in the physical state of the feed which is a liquid in the former case and a vapour in the latter. However, in both processes non-porous membranes are used obtaining a gaseous product from the feed. The selective permeability of different components through a membrane is essentially a mass transfer process, the chemical potential gradient being the driving force. A theoretical analysis of the system shows that the flux of the component i of the feed in a point of the membrane is given by equation [19.1], that is:
where it is assumed that the activity coefficient of component i is the unit. Assuming that ci=kipi where ki and pi are, respectively, Henry’s solubility constant and the vapor pressure of the component i, equation [19.65] becomes:
where Pi=kiDi is the permeability coefficient. Pi is generally expressed in barrers (1 barrer = 10–10 × cm3 (STP) cm/(cm2 s cmHg)). The integration of equation [19.66] leads to the following expression:
Notice that vapor pressure of the component i at the side of the membrane in contact with the feed is pi1 whereas pi2 at the other side of the membranes is approximately zero because this part of the pervaporator is kept under vacuum. Moreover:
where xi, pi0y γi represents the molar fraction, the vapour pressure of the pure component and the activity coefficient of the i component of the feed in the supply compartment of the pervaporatour. By measuring the flux of the component i, the permeability coefficient of this component is obtained as:
The permselectivity of a component A of the feed with respect to other component B in the pervaporation process is given by:
where y and x represent, respectively, the molar fractions of the permeability products and the supply liquids.
To determine the methanol permeability in liquid phase we can use the method described by Yo Jin Kim et al. [KIM 04], or a system composed of two 50 mL glassy compartments described by Tricoli et al. [TRI 98, 00], [PIV 99].
19.7. Determination of membrane morphology using the SEM technique
Scanning Electron Microscopy (SEM) is an important technique that can be used for the morphological characterization of membranes, especially the topological aspects of these materials. The technique allows the imaging of the surface and/or cross-sectional areas of membranes with a high energy beam of electrons, thus providing information concerning the morphology of the surfaces, morphology of fillers dispersed in mebranes (form, size and distribution), porosity and distribution of pore sizes in membranes, etc.
Figure 19.9. Cross-sectional surface images obtained by SEM a) Nafion + Sepiolite membrane. b) SEBS + Sepiolite membrane

Figures 19.9 and 19.10 present, respectively, cross-sectional and surface micrographies of Nafion and sulfonated SEBS composite membranes, both containing sepiolite as filler. Both membranes were cast at 70ºC. Higher temperatures are not recommended for the casting process because a too rapid evaporation of solvent could form bubbles in the membrane. The images suggest a rather good dispersion of the fillers in the membranes. However, small sediments on one side of the membranes, somewhat smaller in the SEBS composite membrane, can be detected. The fact that the solvent evaporation rate is higher in the composite membrane based on SEBS than that based on Nafion explains the smaller sedimentation in the former membrane.
19.8. Thermal stability
Owing to the fact that fuel cell performance improves with temperature, it is fundamental to use cation-exchange membranes that are stable at temperatures near 150ºC as solid polyelectrolytes in these devices. Membranes based on high thermal stability polymers, such as polysulfones, poly(aryl-ether-sulfones), polyketones, polyimides, etc., could be used for this purpose.
Figure 19.10. Surface images of the Nafion+Sepiolite and the SEBS+Sepiolite membranes: a) (top left) Upper Nafion + Sepiolite side. b)(top right) Lower Nafion + Sepiolite side. c)(bottom left) Upper SEBS+Sepiolite side. d)(bottom right) Lower SEBS+Sepiolite side [FER 07]
The thermal stability of membranes can be studied with different techniques, thermogravimetry (TG) and differential thermogravimetry (DTG) being mostly used. The first technique records the variation of mass wth temperature at different heating rates under the desired atmosphere (oxygen, nitrogen, etc.). The curve W(t) vs T, or thermogram, gives the loss of mass as a function of temperature.
DTG allows curves presenting a series of peaks (Figure 19.11), whose areas are equivalent to the changes of mass of the sample, to be obtained. This technique, together with TG experiments, are used to determin the degradation temperature of polymers, thermal stability, content of water and residual solvents, etc.
Figure 19.11. Variation of mass as a function of the temperature for sepiolite and sulfonated sepiolite. This filler was added to Nafion SEBS membranes [FER 07]

Figure 19.11 presents variations of mass with temperature for sepiolite and sulfonated sepiolite, fillers which have been used for the preparation of Nafion and SEBS composite membranes. The thermogram for the pristine sepiolite exhibits a mass loss slightly above 200ºC which corresponds to water trapped in the canals of the filler, followed by a second mass loss in the vicinity of 800ºC associated with a dehydroxylation process [FRO 03]. On the other hand, the DTG thermogram corresponding to the sulfonated filler exhibits mass losses in the vicinity of 200ºC and 600ºC, presumably associated with the organic-inorganic sulfonated filler [FER 07].
19.9. Acknowledgements
This work was supported by the DGICYT through Grant MAT2005-05648-C02-02 and the Generalitat Valenciana (Spain) with the IMCITA/2005/31 project between IMPIVA and the Institut de Technologie Electrique (ITE).
19.10. Bibliography
[ALB 03] ALBERTI G., CASCIOLA M. Annu. Rev. Mater. Res., vol. 33,129–154, 2003.
[ALB 92] ALBERTI G., CASCIOLA M., CONSTANTINO U., PERAIO A., MONTONERI E., Solid State Ionics, vol. 50, p. 315–322, 1992.
[ALB 95] ALBERTI G., CASCIOLA M., CONSTANTINO U., PERAIO A., REGA T., MATER J., J. Mater. Chem., vol. 5, p. 1809–1812, 1995.
[ALB 97] ALBERTI G., CASCIOLA M., Solid State Ionics, vol. 97, p. 17–186, 1997.
[ATK 03] ATKINS J. R., SIDES C.R, CREAGER S. E., HARRIS J.L., PENNINGTON W. T., THOMAS B.H., DESMARTEAU D.D., J. New Mat. Electrochem. Syst., vol. 6, p. 9–15, 2003.
[ATK 78] ATKINS P.W., Physical Chemistry, W.S.H. Freeman, San Francisco, p. 840, 1978.
[BAU 62] BAUM B., HOLEY W., WHITE J.R., in Membrane Separation Processes, Wiley & Sons, Inc., New York, 1962.
[BOD 56] BODE W.W., Network Analysis and Feedback Amplifier Design, Van Nostrand, Princeton, N.J., 1956.
[BOU 89] BOUKAMP B.A., Equivalent Circuit University of Twenty, 1989.
[BUC 88] BUCKLEY A., STUETZ D.E., SERAD G.A., in Encyclopedia of Polymer Science and Engineering, 2nd. ed., John Wiley & Sons, New York, vol. 11, 1988.
[CAB 85] CABASSO J., “Materials Science of Synthetic Membranes”, ACS Symposium Series 269, American Chemical Society, LLOYD D.R. (Ed.), Washington D.C., p.305–323, 1985.
[COM08] COMPAÑ V., RIANDE E.F.J., FERNANFEZ-CARRETERO F.J., BEREZINA N.P., SYTCHEVA A.A-R., J. Membr. Sci., vol. 318, p. 255–263, 2008.
[COM 94] COMPAÑ V., LÓPEZ M.L., SØRENSEN T.S., GARRIDO J., J. Phys. Chem, vol. 98, p. 9013, 1994.
[COM 96] COMPAÑ V., SORENSEN T. S, DIAZ-CALLEJA R., RIANDE E., J. Applied Physics, vol. 79, no. 1, p. 1–9, 1996.
[COM 97] COMPAÑ V., SORENSEN T.S., ANDRIO A., LÓPEZ M.L., DE ABAJO J., Jour. Membr. Sci., vol. 123, p. 293–302, 1997.
[FER 07] FERNANDEZ-CARRETERO F. J., COMPAÑ V., RIANDE E., J. Power Sources, vol. 173, p. 68–76, 2007.
[COR 03] CORNET N., DIAT O., GEBEL G., JOUSSE F., MARSACQ D., MERCIER R., PINERI M., J. New Mat. Electrochem. Syst., vol. 3, no. 33, 2003.
[DIM 02] DIMITROVA P., FRIEDRICH K.A., STIMMING U., VOGT B., Solid State Ionics, vol. 150, p. 115–122, 2002.
[DIN 01] DING J., CHUY C., HOLDCROFT S., Chem. Mat., vol. 13, p. 2231, 2001.
[DEL RIO 05] DEL RIO C., SANCHEZ F., ACOSTA J.L., Polymer, vol. 46, p.3975–3985, 2005.
[ENN 99] ENNARI J. et al., Macromol. Symp., vol 146, p. 41–45, 1999.
[FRO 03] FROST R.L., DING Z., Thermochimica Acta, vol. 397, no. 1–2, p. 119–128, 2003.
[GAR 00] GARRIDO J., COMPAÑ V., J. Electrochem. Soc., vol. 147, no. 11, p. 4263–4267, 2000.
[COM 07] COMPAÑ V., FERNÁNDEZ-CARRETERO J., RIANDE E., LINARES A., ACOSTA J.L., J. Electrochem. Soc., vol. 154, no. 2, p. B159, 2007.
[GAR 92] GARRIDO J., COMPAÑ V., J. Phys. Chem., vol. 96, p. 2721, 1992.
[GAR 94] GARRIDO J., COMPAÑ V., LÓPEZ M.L.,.J. Phys. Chem., vol. 98, p. 6003, 1994.
[GAR 97] GARRIDO J., COMPAÑ V., LÓPEZ M.L., Current Topics in Electrochemistry, vol. 4, chap. 7. Research Trends, Poojapura, 1997.
[GAR 97] GARRIDO J., COMPAÑ V., LÓPEZ M.L., MILLER D.G., J. Phys. Chem. B, vol. 101, no. 29, p. 5740–5746, 1997.
[GEN 01] GENIES C., MERCIER R., SILLION B., PETIAUD R., CORNET N., GEBEL G., PINNERI M., Polymer, vol. 42, p. 359, 2001.
[GEN 01] GENOVA-DIMITROVA P., FOSCALLO D., POINSIGNON C., SANCHEZ J.Y., J. Memb. Sci., vol. 185, p. 59, 2001.
[GRE 61] GREGOR H.P., Proc. Ann. Powers Sources Conf, vol. 15, no. 4, 1961.
[GUO 99] GUO Q., PINTAURO P.N., TANG H., O’CONNOR S., J. Memb. Sci., vol. 154, p. 175, 1999.
[HAR 03] HARRISON W. et al., J. Polym. Sci.: Part A: Polym. Chem., vol. 41, p. 2264, 2003.
[HIC 04] HICKNER M.A., GHASEMI H., KIM YU S., EINSLA B.R., MCGRATH J.E., Chem Rev., vol. 104, p. 4587–4612, 2004.
[HOG 01] HOGARTH M., GLIPA X., High temperature membranes for solid polymer fuel cells, TechniETSU F/02/00189/REP; DT1/Pub URN 01/893, 2001.
[HOG 05] HOGARTH W.H.J., DINIZ DA COSTA J.C., (MAX)LU G.Q., Journal of Power Sources, vol. 142, p. 223–237, 2005.
[JAN03] JANNASCH P., Curr. Opin. Colloid Interface Sci., vol. 8, no. 96, 2003.
[JUD 50] JUDA W., MCRAE W.A.J., Am. Chem. Soc., vol. 72, p. 1044, 1950.
[KIM 04] KIM YO JIN, WON CHOON CHOI, WOO SEONG.IHL, HONG WON HI., J. Membr. Sci., vol. 238, p. 213–222, 2004.
[KOT 01] KOTER S., Separ. Purif. Technol., vol. 22–23, p. 643, 2001.
[KOT 02] KOTER S., J. Memb. Sci., vol. 206, p. 201, 2002.
[KRE 01] KREUER K.D., J. of Membrane Sci., vol. 185, p. 29–39, 2001.
[KRE 98] KREUER K.D., FUCHS A., SPAETH M., MAIER J., Electrochimica Acta, vol. 43, p. 1281–1288, 1998.
[LAK 69] LAKSHMINARAYANAIAH N., Transpor Phenomena in Membranes, Academic Press, New York, 1969.
[LI 03] LI Q.F,. HE R.H., JENSEN J.O., BJERRUM N.J., Chem. Mater., vol. 15, 4896, 2003.
[LÓP 01] LÓPEZ M.L., COMPAÑ V., GARRIDO J., RIANDE E., ACOSTA J.L., J. Electrochem. Soc., vol. 148, E372–E377, 2001.
[MAC 87] MACDONALD J.R., Impedance Spectroscopy: Emphasizing solid materials and systems, Wiley-Interscience, 1987.
[MAU 00] MAURITZ K.A., PAYNE J.T., J. Membrane Science, vol. 168, no. 39, 2000.
[MAU 02] MAURITZ K.A., STOREY R.F., MOUNTZ D.A., REUSCHLE D.A., Polymer, vol. 43, p. 4315–4323, 2002.
[MAU 04] MAURTIZ K.A., MOORE R.B., Chem. Rev., vol. 104, 4535, 2004.
[MIY01] MIYAKE N., WAINRIGHT J.S., SAVINELL R.F., J. Electrochem. Soc., vol. 148, no. 8, A905–A909, 2001.
[NYQ 28] NYQUIST H., Phys. Rev., vol. 32, p. 110, 1928.
[PAD 03] PADDISSON S.J., Ann. Mat. Res., vol. 33, p.289, 2003.
[PAR 08] PARCERO E., FERNANDEZ-CARRETERO F.J., COMPAÑ V., HERRERA R., DEL CASTILLO L.F., RIANDE E., Journal of The Electrochemical Society, vol. 155, F245, 2008.
[PIV 99] PIVOVAR B. S., WANG Y., CUSSLER E.L., J. Membr. Sci., vol. 154, p. 155–162, 1999.
[POU 92] POURCELLY G., GAVACH C., “Perfluorinated membranes”, in COLOMBAN P. (ed.), Proton Conductors, Cambridge University Press, New York, p. 294–310, 1992.
[PUS 82] PUSCH W., Angew. Chem., vol. 21, p. 660, 1982.
[R&D 03] R&D Plan for the High Temperature Membrane Working Group. Department of Energy Office of Efficiency and Renewable Energy’s Hydrogen, Fuel Cells & Infrastructure Technology Program, 2003.
[REB 75] REBOIRAS M.D., RIANDE E., An. Quím., vol. 71, p. 39, 1975.
[SAT02] SATA T., Ion Exchange Membranes. Preparation, Characterization, Modification and Application, RSC Advancing the chemical sciences, UK, 2002.
[SCH 62] SCHLÖGL R., “Ber. Bunsenges”, Physik. Chem., vol. 70, p. 400, 1966, HELFFERICH F., Ion Exchange, McGraw Hill, New York, 1962.
[TRI 00]TRICOLI V., CARRETTA N., BARTOLOZZI M., J. Electrochim. Soc., vol. 147, p. 1286, 2000.
[TRI 98] TRICOLI V., J. Electrochim Soc., vol. 145, p. 3798, 1998.
[TUC 97] TUCKERMAN M.E., LAASONEN K., SPRIK M., PARRINELLO M., Science, vol. 275, p. 817–820, 1997.
[ULB06] ULBRICHT M., “Advanced functional polymer membranes”, Polymer, vol. 47, p. 2217–2262, 2006.
[WAI 95] WAINRIGHT J.S., WANG J-T., WENG D., SAVINELL R.F., LITT M., J. Electrochem. Soc., vol. 142, L121, 1995.
[WAL 99] WALTER M., BAUMGÄRTNER K.M., KAISER M., KERRES J., ULLRICH A., RÄUCHLE E., J. Appl. Polym. Sci., vol. 74, p. 67, 1999.
[WIH 02] WIHELM F.G., PUNT I.G.M., VAN DER VEGT N.F.A., STRAHMANN H., WESSLING M., J. Memb. Sci., 199, p. 167, 2002.
[WIL 02] WILES K.B., BHAND V.A., WANG F., MCGRATH J.E., Polym. Prep., vol. 43, p. 993, 2002.
[YAM 64] YAMABE Y., SENO M., Ion Exchange Resin Membranas, Gihodo, Tokyo, Japan, p.8, 1964.
[YAN 04] YANG C. SRINIVASAN S., BOCARSLY A.B., TULYANI S., BENZINGER J.B., J. Membr. Sci., vol. 237, p. 145–161, 2004.
[ZHA 01] ZHANG L., CHENGSON M., MUKERJEE S., Electrochim. Acta, vol. 48, p. 1845–1859, 2003.
1 Chapter written by Vicente COMPAÑ MORENO and Evaristo RIANDE GARCIA.