Chapter 8
Configuring SharePoint for Business Intelligence
WHAT’S IN THIS CHAPTER?
- Deploying SQL Server Analysis Services
- Deploying sample data
- Excel Services
- PowerPivot
- SQL Server Reporting Services
- PerformancePoint
- Visio Graphics Service
- Access Services
A quick glance at the preceding list of topics covered in this chapter explains why this chapter is so long. Business intelligence (BI), which refers to an enterprise’s approach to working with, analyzing, and storing large amounts of data, is often a challenge for administrators both new and experienced. One of the main reasons is because the guides and documentation aren’t usually very practical. They are typically written by fellow administrators who understand the nuts and bolts but have no clue about the data. Not that it really matters, as such guides rarely include a walk-through of the technology because sample data is difficult to find and deploy. Of course, the opposite approach is equally insufficient, because a guide written purely by a data specialist enables an administrator to get things working but without any real understanding of the process.
This chapter takes a different approach. It was written by two SharePoint administrators and one BI expert, together working out all the kinks and then documenting it. Every section first describes how to install and configure the given item, and then walks you through the process of actually deploying the resulting report or other BI output so you can see it working.
FIND BONUS INFORMATION
Since the BI guy was feeling generous he has included in each section a screenshot of a more complex BI solution using the tool from that section. He couldn’t include building that complex solution in the chapter so he did the next best thing. If you go to
http://www.rackspace.com/sharepoint-bi/ you will find a recording of him building the more complex solution. What a nice guy.
In order to get the most from this integrated approach, you begin by deploying SQL Server Analysis Services, and then add the AdventureWorks database. The reasoning is quite simple: you need real data to do the real examples that follow throughout the chapter.
One more thing to keep in mind is the version of SQL Server matters. Throughout the chapter the various tools will identify the minimum version of SQL Server you need for a given toolset. If you want to just have one ready to go, SQL Server 2012 Enterprise with Service Pack 1 can do everything in this chapter. When you are building test environments and licensing is not an issue that may be the best way to go. But the Enterprise edition costs a small fortune so for production you may want to think a little harder and roll with the cheapest license you can. Remember service packs are free so no matter what you do the latest, greatest service pack is always recommended.
INSTALLING SQL SERVER ANALYSIS SERVICES
In order to test some of the service applications you will configure later in the chapter, you need a working instance of SQL Server Analysis Services (henceforth referred to as SSAS). The following sections step you through the process of installing SSAS and deploying the AdventureWorks sample database and cube to your environment.
NOTE A cube is an object, created in an Analysis Services database, that is used to analyze related data. Cubes pre-aggregate data allowing them to handle very large sets of data while maintaining fast query response times. Some front-end tools such as the PerformancePoint Analytic Chart require the use of a cube as its data source.
Installing SSAS and Data Tools
In a production environment, your instance of SSAS would most likely live on a separate server, but for the example you’re going to install SSAS on your existing SQL box. SSAS is installed using the SQL Server 2012 installation disc, so you need to have that handy in order to complete the following steps:
1. Log onto your SQL server as an account that has the system administrator SQL role. In this example, the server is sql and the account is contosoadministrator.
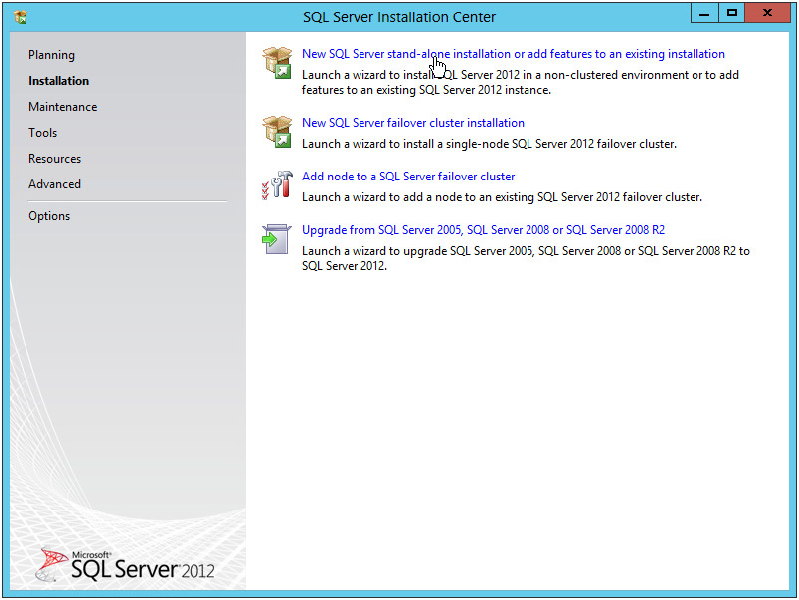
2. Navigate to your SQL Server 2012 installation disc and double-click setup.exe to open the SQL Server Installation Center window.
3. Select Installation from the left pane.
4. Select “New SQL Server stand-alone installation or add features to an existing installation,” as shown in
Figure 8-1.
5. Click OK on the Setup Support Rules dialog.
6. Click Next on the Product Updates dialog.
7. Click Next on the Setup Support Rules dialog.
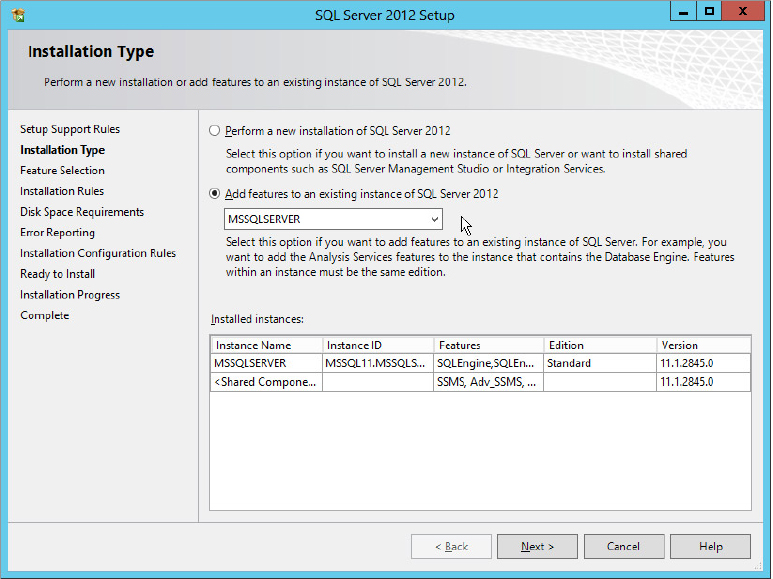
8. On the Installation Type dialog, select “Add features to an existing instance of SQL Server 2012” and ensure that the default instance of MSSQLSERVER is selected in the drop-down as seen in
Figure 8-2. Click Next.
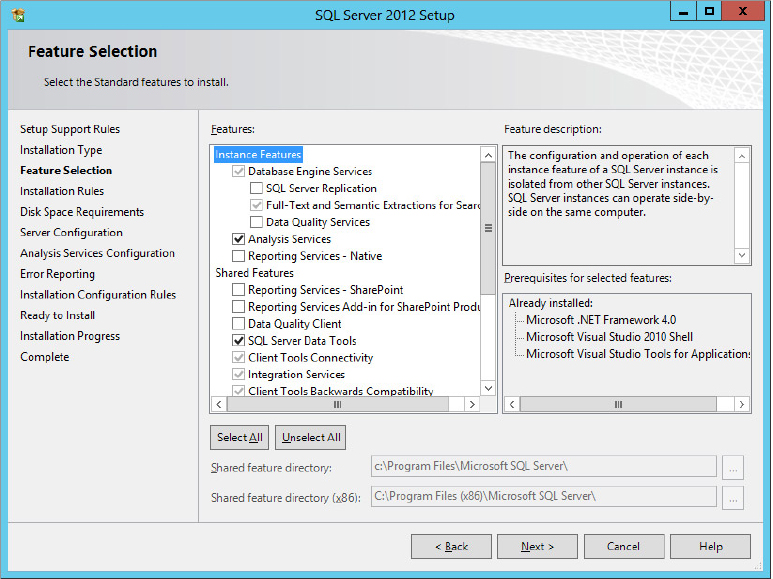
9. In the Feature Selection dialog, select both Analysis Services and SQL Server Data Tools from the list of options, as shown in
Figure 8-3.
10. Click Next on the Installation Rules dialog.
11. Click Next on the Disk Space Requirements dialog.
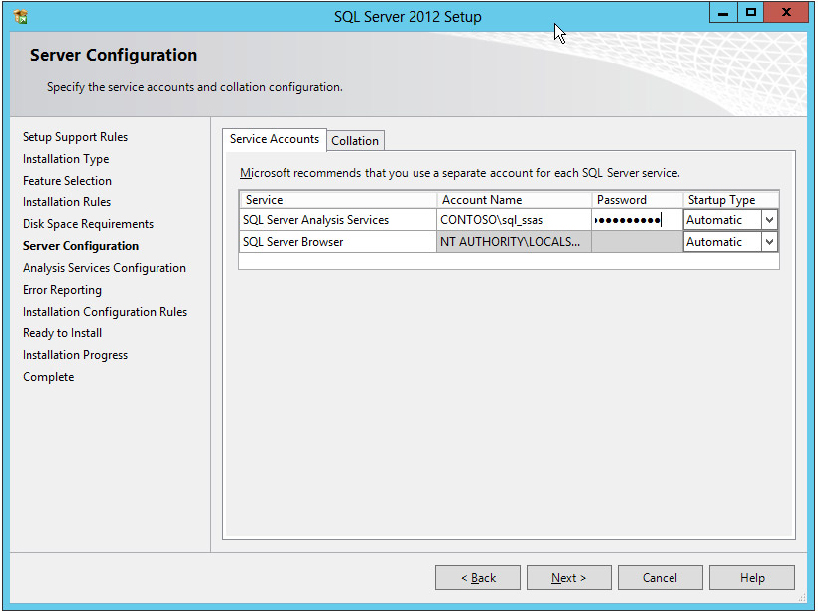
12. On the Server Configuration dialog, change the account name under which the SQL Server Analysis Services service runs. This account just needs to be domain user. In this example, use
contososql_ssas as shown in
Figure 8-4.
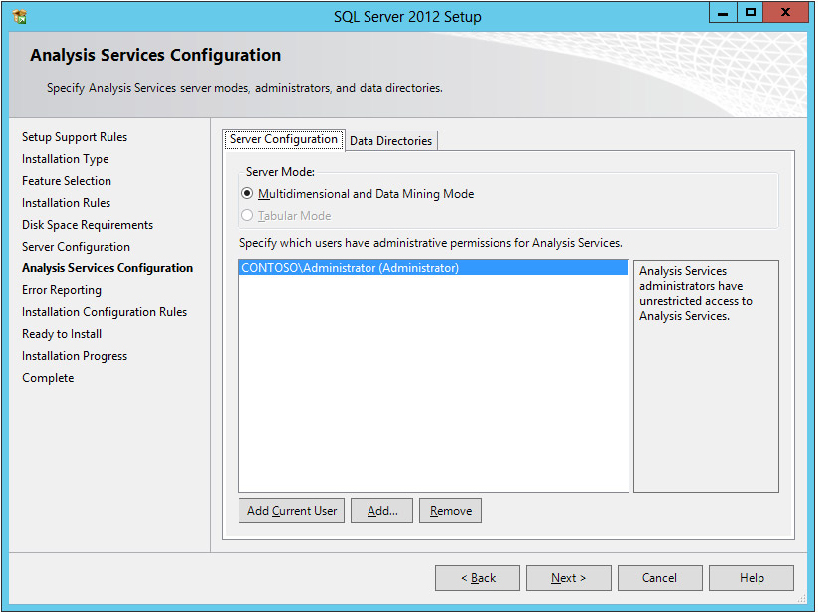
13. On the Analysis Services Configuration dialog, ensure that Multidimensional and Data Mining Mode is selected as the Server Mode.
14. Grant the logged-in account administrator permissions for the SSAS instance by clicking the Add Current User button. When complete, the dialog should look like
Figure 8-5. Click Next.
15. For Error Reporting, click Next.
16. After the installation rules pass successfully, click Next.
17. Review the summary information and then click the Install button.
Once installation completes, you can verify the SSAS installation by opening SQL Server Management Studio and connecting to the SSAS instance. To do so, follow these steps:
1. From the Start menu, open SQL Management Studio.
2. Select Analysis Server from the Server type, type in your SQL server’s name, and click Connect. In this example it would be sql.
3. Confirm that the SSAS instance is displayed in the Object Explorer window.
Deploying AdventureWorks
Now that SSAS is installed, it’s time to obtain and deploy some sample data you can use. The easiest way to do that is to use the AdventureWorks sample database and SSAS project. The files can be downloaded from CodePlex at http://msftdbprodsamples.codeplex.com/releases/view/55330. Download the following files from that site:
- AdventureWorksDW2012_Data.mdf — You will attach this to the SQL Server instance so you have a source from which your cube can pull data. Listed on the site as “AdventureWorksDW2012 Data File”. Make sure you get the one with DW in the name.
- AdventureWorks Multidimensional Models SQL Server 2012.zip — You will use this to deploy an SSAS cube. Listed on the site as “AdventureWorks Multidimensional Models SQL Server 2012.”
Deploying AdventureWorks2012_Data.mdf
In order for the newly downloaded .mdf file to be of any use, you need to attach it to the SQL Server instance. To do so, follow these steps:
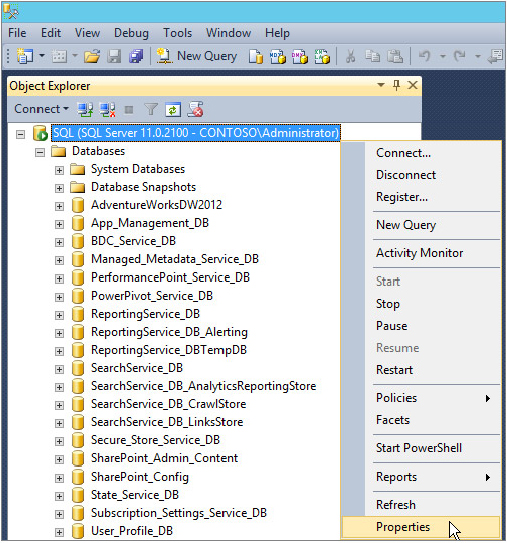
1. Copy the AdventureWorksDW2012_Data.mdf file to your SQL server data directory. By default, this should be C:Program FilesMicrosoft SQL ServerMSSQL11.MSSQLSERVERMSSQLDATA. If you are unsure, you can find the location by connecting to SQL Server using SQL Server Management Studio, right-clicking on your instance, and selecting Properties. The location where SQL Server keeps the data files should be listed on the Database Settings page under Database default locations.
2. Open SQL Server Management Studio and connect to the default SQL instance.
3. In the Object Explorer window, right-click on the Databases folder.
4. From the drop-down select Attach...
5. From the Attach Databases dialog, click the Add... button.
6. Navigate to the location where you copied your MDF file. Once there, select the file and click OK.
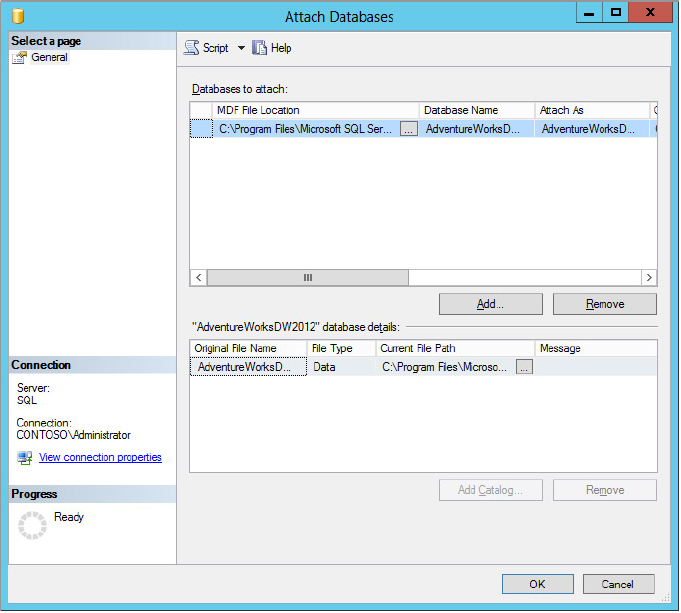
7. Note that there is no log file that goes along with the MDF file you are attaching. You need to remove the log file from the AdventureWorksDW2012 Database details section of the dialog by selecting it and then clicking the Remove button. When completed, your screen should look similar to
Figure 8-6.
8. Click OK to finish attaching the MDF file.
Confirm that the database was successfully added by locating it in the Object Explorer window. The new database should be called AdventureWorksDW2012 and will most likely appear at the bottom of the list until the Databases folder is refreshed.
Configuring a Service Account for Reporting
Now that the AdventureWorksDW2012 database is up and running, you can set up a service account that has read-only privileges on it. This account will be used to connect to the database in the Reporting Services and Visio Services configuration sections later in this chapter. Doing it now saves a little time, as SQL Server Management Studio is already open and you know where the database is located:
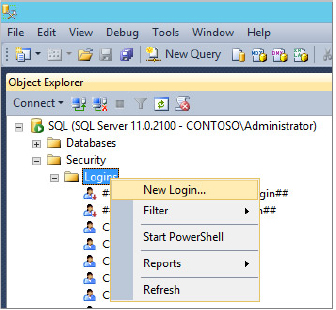
1. In the Object Explorer window, expand the Security folder.
2. Right-click the Logins folder, and select New Login....
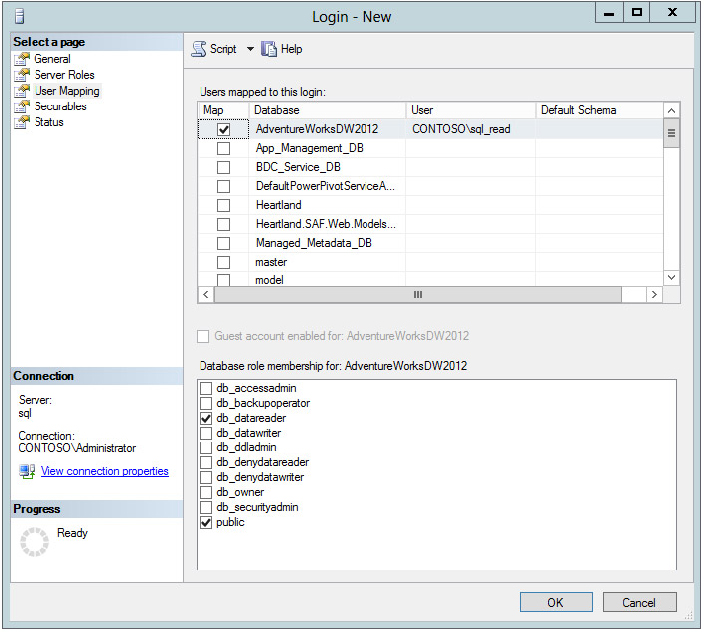
3. In the Login name text box, enter an account you want to use for read-only access to the database. For this example, use an AD user named contososql_read. The account only needs to be a domain user.
4. Under Select a page, click the User Mapping link.
5. Place a check next to AdventureWorksDW2012. Then, under Database role membership for AdventureWorksDW2012, confirm
db_datareader is automatically selected, as shown in
Figure 8-7. Click OK.
6. Repeat the previous steps for your SSAS service account you used when installed SSAS. For this example, the account is contososql_ssas.
Deploying the AdventureWorks Multidimensional Model
Now that you have the source data for the cube attached to SQL, it’s time to deploy the SSAS cube. In order to do that you need the AdventureWorks Multidimensional Models SQL Server 2012.zip file mentioned earlier. If you have not yet downloaded this file, do so now, and then follow these steps:
1. Log into the SQL server as an account that has the systemadministrator SQL role. In this example the server is sql and the account is contosoadministrator.
2. Copy the AdventureWorks Multidimensional Models SQL Server 2012.zip file to the desktop.
3. Double-click the zip file, locate the Standard folder, and extract it from the zip file. Failure to extract this folder before opening the solution inside of it will cause errors during cube processing.
4. Find and double-click on the AdventureWorksDW2012Multidimensional-SE.sln file inside the extracted Standard folder. The path will be <extracted location>AdventureWorks Multidimensional Models SQL Server 2012Standard.
5. If this is your first time opening Visual Studio on this computer, you will be prompted to select a template for Visual Studio to use. Select Business Intelligence.
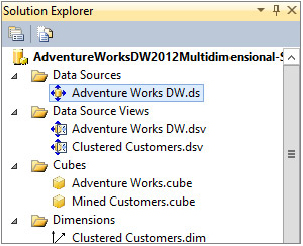
6. When the solution finishes opening, locate the
Adventure Works DW.ds file in the Data Sources folder of the Solution Explorer window in Visual Studio as shown in
Figure 8-8. Double-click the file to open the Data Source Designer window.
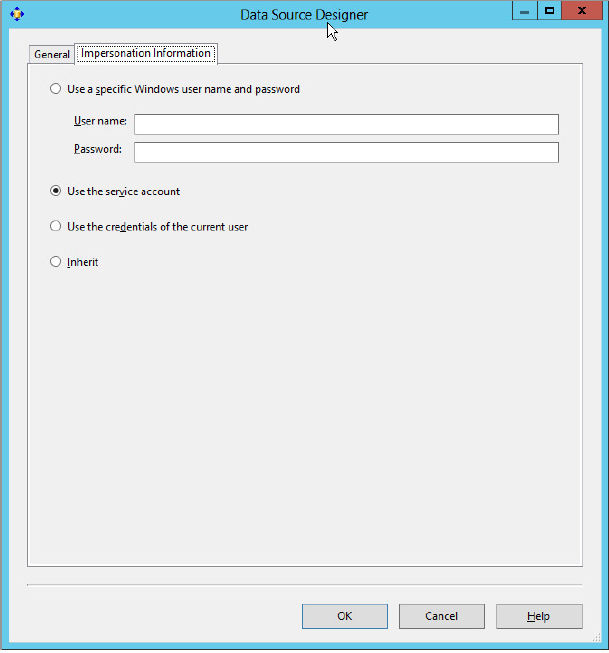
7. Click the Impersonation Information tab (see
Figure 8-9).
8. This is where you specify the account that will be used to pull data from your AdventureWorksDW2012 SQL database. Select the “Use the service account” option, which will use the service account you defined for SSAS. If you want to use another account, you can select the “Use a specific Windows user name and password” option, specifying the account you want to use. Click OK.
9. In the Visual Studio Solution Explorer window, right-click on the AdventureWorksDW2012Multidimensional-SE project.
10. Select Process....
11. Click Yes for the pop-up asking “Would you like to build and deploy the project first?”
12. Once the project has been deployed, Visual Studio will display the Process Database dialog. Click Run.... Processing of the cube may take a few minutes to complete.
13. When the process progress status reads “Process succeeded” you can click Close on all the remaining open dialogs and then exit Visual Studio.
Now that the cube is deployed, you need to connect to the SSAS instance and confirm that everything went OK by browsing through some of the data:
1. Open SQL Server Management Studio.
2. Select Analysis Services as the server type.
3. Enter your server name (in this example it is sql), and then click Connect.
4. Expand the Databases folder.
5. Expand AdventureWorksDW2012Multidimensional-SE.
6. Expand Cubes.
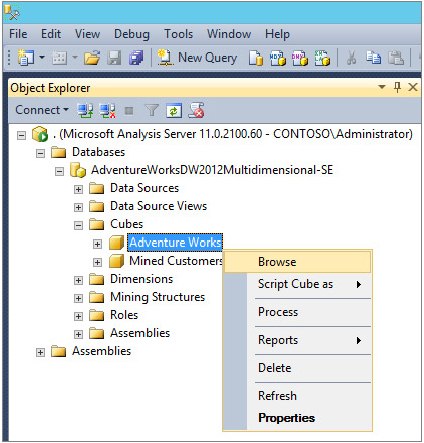
7. Under the Cubes folder, right-click on AdventureWorks as shown in
Figure 8-10.
8. From the menu, select Browse. Doing so should open a new AdventureWorks cube browser.
9. In the left pane of the cube browser, expand Measures, and then expand Internet Customers.
10. Drag the Customer Count measure into the center pane of the cube browser window. You should see a displayed customer count value of 18484.
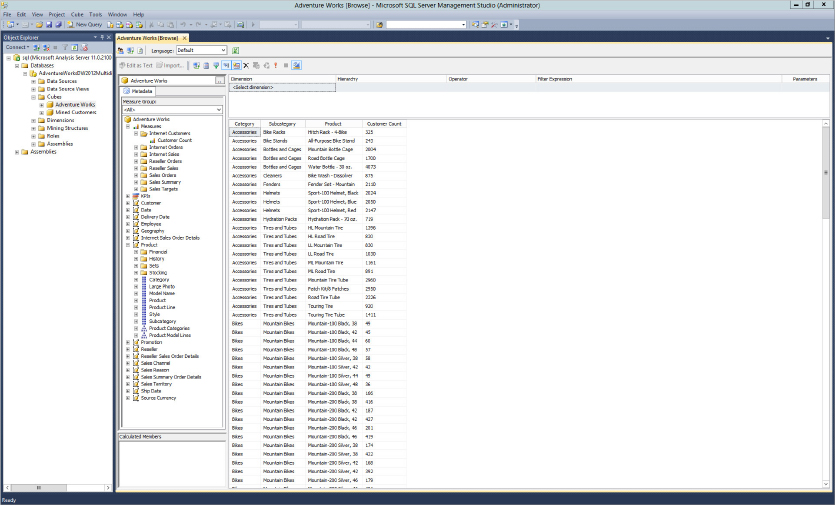
11. In the left pane of the cube browser, expand the Product dimension.
12. Drag the Product Categories hierarchy into the center pane of the cube browser window. This displays customer count broken out by category, subcategory, and product, as shown in
Figure 8-11.
If data appears in your cube’s browser, you have met your objective for this section. You now have more than enough test data in both SQL Server and Analysis Services to test all the BI functionality in SharePoint.
A Quick Word About Firewalls
Note that in order to be able to connect to the sample cube and database from other computers; you must ensure that the ports over which they communicate are not blocked. Assuming you are using the default SQL ports, make sure exceptions have been set up for the following:
- SSAS — TCP port 2383
- SQL Server — TCP port 1433
CREATING A BUSINESS INTELLIGENCE CENTER
Assuming you have already read Chapter 3, “Installing and Configuring SharePoint 2013,” creating a site collection using the Business Intelligence Center template should be child’s play; but just to ensure that everyone is on the same page and working from the same location for the examples remaining in this chapter, here are the quick steps:
1. Open Central Administration. Under Application Management, click Create site collections.
2. For Web Application, ensure that you have the correct web application listed. For this example, it should be
http://portal.contoso.com. If it isn’t listed, then click the drop-down beside the listed web application and click Change Web Application. From the pop-up window, choose the proper web application.
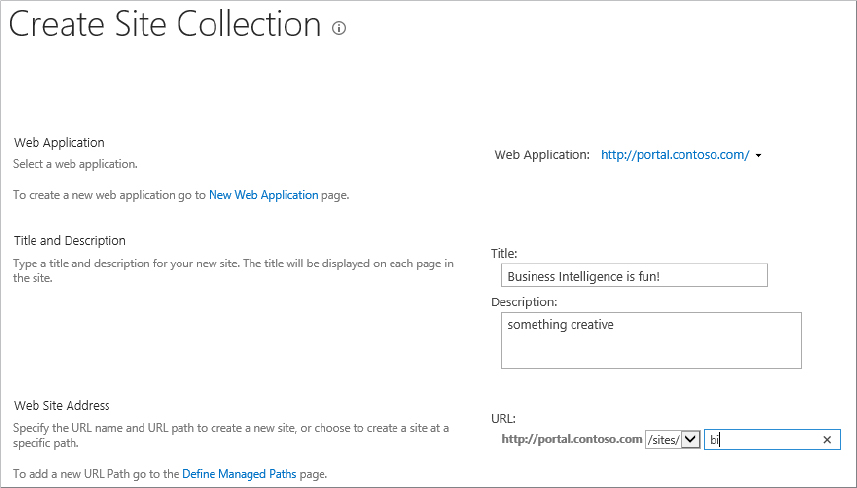
3. For Title, enter
Business Intelligence is fun! For Description, enter
something creative. For URL, enter
bi.
Figure 8-12 shows the resulting dialog.
4. Leave the Select experience version setting at 2013.
5. For Select a template, click the Enterprise tab.
6. On the Enterprise tab, select Business Intelligence Center.
7. Set a user for the Primary Site Collection Administrator. In this example, use contosoadministrator.
8. Set a user for the Secondary Site Collection Administrator. In this example, use contososp_install.
9. For Quota Template, accept the default of No Quota.
10. Click OK at the bottom of the page to create the site collection.
11. When the snarky Working on it... page finishes, you will get a page indicating success. You can either click the blue link to go to the site collection or click OK to return to Central Administration.
That’s all that is required to set up a home base site collection you can use for kicking the tires on some of this business intelligence stuff as you walk through the different service applications.
CONFIGURING EXCEL SERVICES
Excel Services is a good first step into the world of BI for many organizations simply because almost everyone is familiar with Excel at some level. Chances are good that someone in your organization is already creating reports in Excel, and Excel Services makes SharePoint the perfect place to store and share those Excel workbooks. Excel Services enables SharePoint users to view workbooks that have been published to SharePoint from right inside of their browser, so they don’t even need to have Microsoft Office or Excel installed on their machine in order to view them.
This section walks you through configuring Excel Services, and then you can validate that the configuration was successful by creating a simple Excel report that is connected to the AdventureWorks cube you deployed earlier. Finally, you will upload your new Excel workbook to SharePoint so it can be viewed by others.
Configuring the Excel Services Service Application
The following steps describe how to create the Excel Services service application. If you followed along with Chapter 3 to install your farm, then you have already successfully completed these steps:
1. Log onto your SharePoint box as the install account. In this example use contososp_install.
2. Open SharePoint Central Administration, and then select Manage service applications under the Application Management heading.
3. From the Manage service applications screen, click the New button in the Ribbon.
4. From the menu, select Excel Services Application.
5. For Name, enter Excel Services.
6. Scroll down to Application Pool and select “Use existing application pool.”
7. From the drop-down, select Default SharePoint Service App Pool.
8. Leave the default of “Add this service application’s proxy to the farm’s default proxy list.” Click OK at the bottom of the page.
To start the service application:
1. From the left-hand menu, click Application Management.
2. Under the Service Applications section, click “Manage services on server.”
3. Find Excel Calculation Services and click Start to the right of it.
The Excel Services service application is now up and running, configured for SharePoint. Users should now be able to upload basic workbooks and view them inside of SharePoint.
If you navigate to the BI site collection created in the previous section, you can confirm Excel Services is working by doing the following:
1. Log onto your SharePoint box as the install account. In this example use contososp_install.
3. Click Libraries from the site navigation menu on the left.
4. Click Documents.
5. Click the Excel Services Sample Workbook to open it.
CONSIDERATIONS FOR OFFICE WEB APPLICATIONS
If you have already configured Office Web Applications in your SharePoint environment, you need to run the following PowerShell command in order to allow Excel documents to be rendered via Excel Services, rather than the Excel Web App:
New-SPWOPISuppressionSetting -Extension "XLSX" -Action "view"
If all has gone well, you should be looking at a nice example of a dashboard made in Excel. This also confirms that the Excel Services configuration has been successful.
Configuring Excel Services to Use the Secure Store
Although the Excel example that’s included with the BI site is nice, to truly test things out you will create an Excel workbook that connects directly to the SSAS cube. To make that work you need to do a few additional configurations, such as setting up an unattended service account in the Secure Store for Excel Services to use. The unattended service account will be what Excel Services uses when refreshing data in the workbook.
This section assumes you’ve already performed the necessary steps to create the Secure Store service application in SharePoint, and generate a key for it. If you haven’t yet performed those actions, please see the “Configuring the Secure Store” section in Chapter 3 for more information:
1. Log onto your SharePoint box as the install account. In this example use contososp_install.
2. Open SharePoint Central Administration, and select Manage service applications, under the Application Management heading.
3. Click the Excel Services service application.
4. Click Global Settings on the Manage Excel Services Application page.
5. Scroll down to the very bottom of the Excel Services Application Settings page. In the External Data section, configure a new unattended Service Account by entering a username. This will be the account that is used to access the data in the SSAS cube. The account needs to be only a domain user. In this example use contososp_excel.
6. Enter the password and click OK.
Now that the unattended service account has been set up in the Secure Store, you have to tell SharePoint which users are allowed to use the account. For this example, you will configure all users to have this access:
1. Log onto your SharePoint box as the install account. In this example use contososp_install.
2. Open SharePoint Central Administration, and select Manage service applications, under the Application Management heading.
3. Click the Secure Store service application.
4. Click the Excel Services Application Unattended Service Account Target application.
5. Add an e-mail address for the contact e-mail. In this example use
[email protected]. It doesn’t matter whether the e-mail address works or not. Click Next.
6. Click Next on the Edit Secure Store Target Application screen, which displays the field name and field type of the service account being used.
7. Note the Target Application Administrators and Members sections. The Members section contains the list of users and groups allowed to use the unattended service account. To configure this application so everyone can use it, add your domain users group here. In this example enter contosodomain users.
8. Click OK to update the Secure Store.
Now that the unattended service account is ready to go, you need to give that account access to the SSAS cube. To do so, you create a role inside of SSAS. Once that role is created, you add the unattended account to the role:
1. Log onto your SQL server as the administrator account. In this example use contosoadministrator.
2. Open SQL Server Management Studio and connect to SSAS by selecting Analysis Services as the server type.
3. For the server name, enter your SQL server’s name (in this example it is sql), and click Connect.
4. In the Object Explorer window of SQL Management Studio, expand the Databases folder.
5. Expand the AdventureWorksDW2012Multidimensional-SE database.
6. Right-click the Roles folder, and from the drop-down menu select New Role.
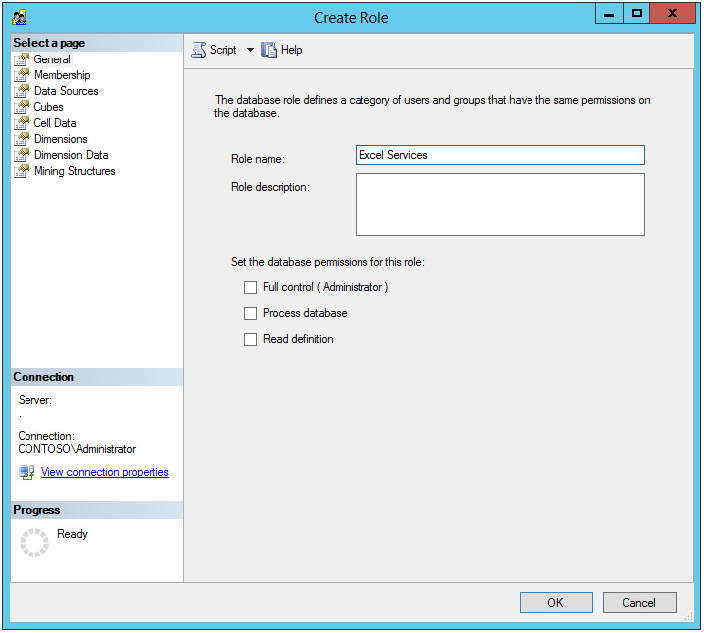
7. In the Role name text box, type
Excel Services as shown in
Figure 8-13.
8. Click Membership on the left side of the Create Role window.
9. Click the Add... button on the Membership page.
10. Under Enter the object names to select type contososp_excel and click OK.
11. Click Cubes on the left side of the Create Role window.
12. On the Cubes page, change the Access for the AdventureWorks cube to Read. Click OK.
Excel Services should now be able to refresh data in any workbook connected to the AdventureWorks cube. At this point the only thing left to do is confirm that everything is working properly by creating an Excel workbook, connecting it to the cube, and uploading it to SharePoint. As you probably guessed, that is exactly what you’ll do in the next section.
Testing the Excel Services Unattended Service Account
Now that your environment is ready to support workbooks with a data connection to the AdventureWorks SSAS cube, you are going to create an example in Excel 2013 to confirm that everything is up and running as expected. The goal here is simply to test Excel Services functionality by creating a very simple workbook:
1. Log into a machine that has the Office 2013 clients installed with an account that has permissions to add data in the SharePoint web you want to use.
2. From the Start menu, launch Excel 2013.
3. When Excel opens, click “Create a new blank workbook.”
4. Click the Excel DATA tab at the top of the window.
5. Click the From Other Sources icon in the Get External Data section.
6. Select From Analysis Services from the list of available options.
7. Enter your SQL server name. For this example use sql.
8. For log on credentials, select “Use the following User Name and Password” and enter the information for the account you added to the SSAS role in the previous section. In this example use contososp_excel. Click Next.
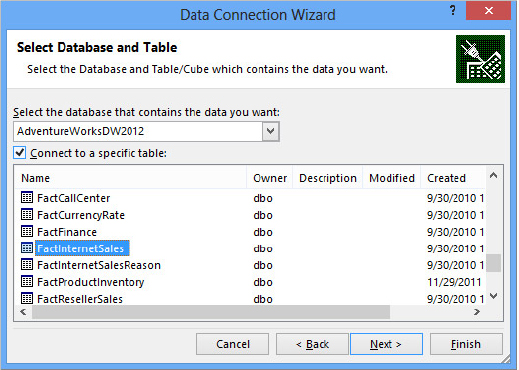
9. On the Select Database and Table dialog, select the AdventureWorks cube and then click Next.
10. On the Save Data Connection File and Finish dialog, click the Authentication Settings... button.
11. Select “Use a stored account.”
12. For the Application ID, enter Excel Services Application Unattended Service Account.
13. Click OK, and then click Finish.
14. Select PivotTable Report from the Import Data screen.
You should now have a pivot table on sheet 1 of your Excel workbook that is connected to the AdventureWorks SSAS cube. Next, you need to add a measure and a slicer to the pivot table so that you can confirm everything is working correctly once the workbook is published to SharePoint:
1. Click on the pivot table area in your workbook. This is cell A1 in your workbook unless you specified somewhere else.
2. Once you click on the pivot table area, a list of available fields from the cube should appear on the right-hand side. Place a check next to Customer Count under Internet Customers. You should now see a customer count number in your pivot table.
3. With your pivot table still selected, click the ANALYZE tab from the ribbon.
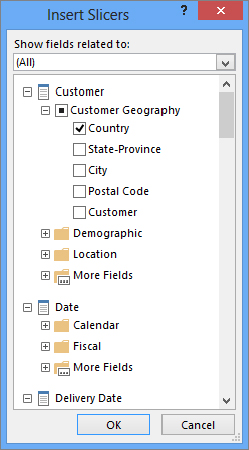
4. Click the Insert Slicer button in the Filter section.
5. Expand Customer and Customer Geography on the list of available fields.
6. Place a check next to Country in the list of Customer Geography fields, as shown in
Figure 8-14.
7. Click OK to close the window.
8. Save the workbook as CustomerCount.xslx to your desktop or another location you can easily access.
Voilà! Your masterpiece is complete. While you probably won’t receive any accolades for the report you just created, except maybe from Mom, it’s sufficient for testing Excel Services and the unattended service account in SharePoint.
Use the following steps to upload it to a document library on the BI SharePoint site and refresh the data:
2. From the left-hand menu, click Site Contents.
3. Click the icon for the Documents app.
4. Click new document.
5. Browse to and select the CustomerCount.xlsx file you just saved. Click OK.
6. If you get a SharePoint pop-up message to Save the document, click Save.
7. Click on the CustomerCount workbook in the document library once it is uploaded to open it in Excel Services.
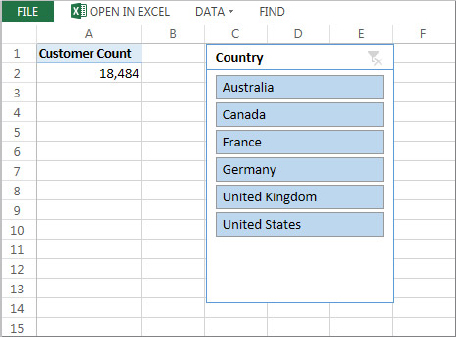
8. Confirm that the Excel slicer works by clicking United States.
9. When prompted to allow the refresh, click Yes.
10. Confirm that the Customer Count number changes when you select other countries.
Figure 8-15 shows what you should be seeing.
Hopefully, all went well and your data is refreshing as expected. If you got an error when you tried to refresh your data, there’s a good chance you are using the wrong account somewhere in the steps. Confirm that the account you’re using in your unattended service account has access to the SSAS cube, and that the Excel connection in your workbook is using the correct application ID to reference that same account.
The example shown in Figure 8-16 demonstrates the power of Excel Services.
POWERPIVOT 2012
PowerPivot at first glance looks like Excel Services, and it actually runs on top of and requires Excel Services to run. The difference is what lies under the hood. PowerPivot allows for the creation and usage of an actual data model, which can pull together data from many different systems and enables you to define the relationships between those systems. With this data model in place, building and working on reports is a breeze. Even cooler is the fact that another major feature of PowerPivot is its ability to scale. It can easily handle millions of rows of data without breaking a sweat.
PowerPivot for SharePoint is provided by SQL Server. To use it, SharePoint 2013 must be the Enterprise license and SQL Server must be either the Enterprise or the BI edition. For help choosing the version of SQL Server that best suits your needs, see http://www.microsoft.com/sqlserver/en/us/editions.aspx.
Once you pick your edition of SQL Server 2012, note that it must be Service Pack 1 or later. Prior to SP1 the BI features didn’t integrate properly with SharePoint 2013. If you don’t have SQL Server 2012, you can find a free 180-day trial available at http://www.microsoft.com/sqlserver/en/us/get-sql-server/try-it.aspx.
Like SQL Server Reporting Services, SharePoint Server and SQL Server 2012 must be installed on the same machine to use PowerPivot. You will actually run the SQL Setup media on one of the SharePoint servers in your farm — typically one of the application servers but that is up to you. This requires another SQL Server license, so keep that in mind when planning your farm topology.
In a lot of ways, PowerPivot serves as a special instance of SQL Server Analysis Services (SSAS). In fact, when you run setup, you will see that SSAS is the type of instance that is installed. This could be important if you ever found yourself needing to punch a hole in the firewall or were just wondering why you keep seeing references to SSAS when you just have PowerPivot.
Installing PowerPivot
The following install example assumes you have used Chapter 3 to install and configure your SharePoint farm. The install will be on the server named Server. In Chapter 3 this was the server on which SharePoint Server 2013 Enterprise was installed. For storing the associated databases, you will point to the SQL server named Sql. Remember that PowerPivot and SharePoint have to be installed on the same server in your environment.
IS SQL SERVER CRAZY?
Just a friendly warning. If you have previously run the SQL Server installer on the computer on which you are about to run the following steps, you might notice some weird behavior in the first few steps. All of the steps related to installing and configuring PowerPivot will be the same, but things such as when the installer prompts you for a product key or whether it checks for updates will vary. Don’t be alarmed; for all of these screens the answer is usually Next. When you get to the hard parts everything will fall back in line.
Follow these steps to install PowerPivot:
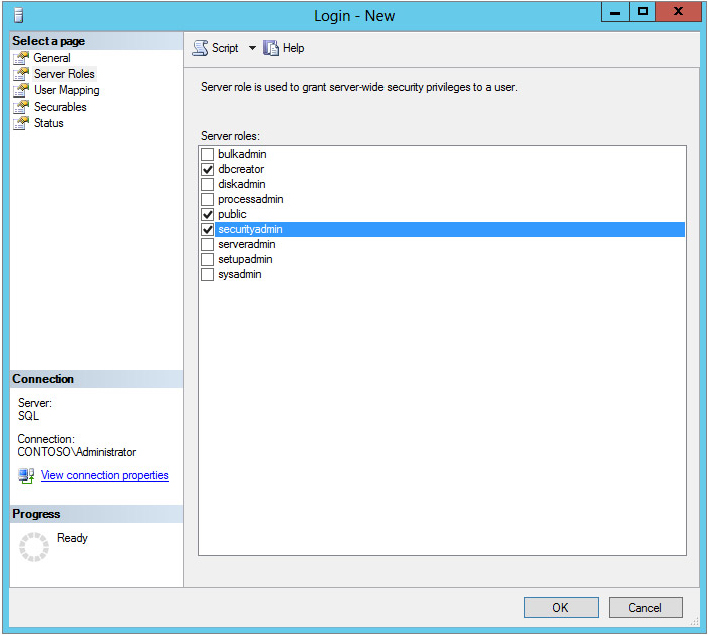
1. Log onto the SharePoint server as your install account. This account needs to be a local administrator on the SharePoint server and have the SQL Server roles of dbcreator, public, and securityadmin. In this example use Contososp_install and log onto the server named Server.
2. Run SQL Server setup.exe. Remember that the edition must be SP1 or later and be either the BI or Enterprise edition.
3. When the SQL Server Installation Center opens, click the Installation link on the right side of the window.
4. From the Installation window, click “New SQL Server stand-alone installation or add features to an existing installation.”
5. The Setup Support Rules dialog will check to ensure you won’t have any of the common issues associated with installation. If any issues are identified here, be sure to address them. When everything has passed the checks, click OK.
6. On the Product Key dialog, enter your product key and click Next.
7. On the License Terms dialog, read everything very carefully and then if you agree, select “I accept the license terms” and click Next.
8. Wait a minute for the Install Setup Files dialog to process. When it finishes, you will be taken to Setup Support Rules. Make sure you have no failures and click Next. A common warning on this screen is Windows Firewall. If you have the firewall enabled you may need to open one or more ports. For PowerPivot you are not required to open in ports, as SharePoint calls the farm locally. You can continue through warnings, but if you have any failures you must correct those issues before moving on.
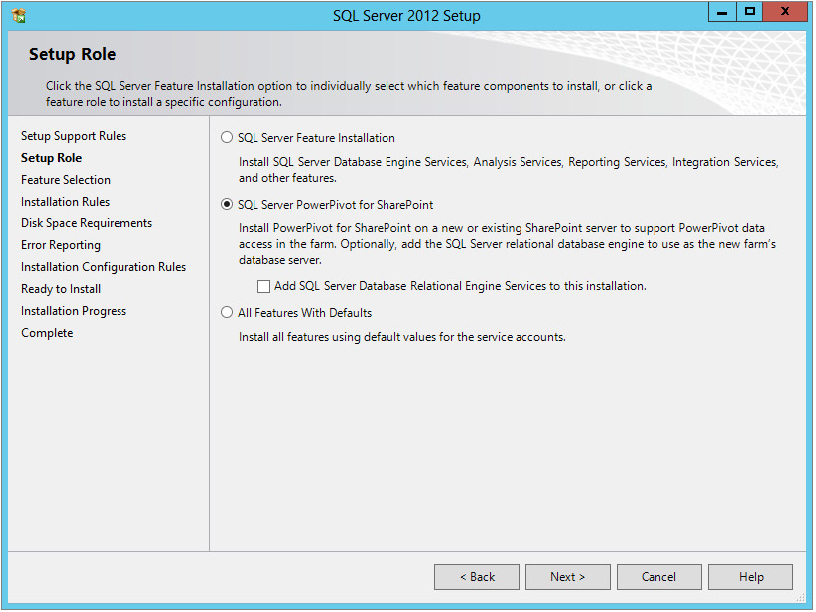
9. On the Setup Role dialog, choose SQL Server PowerPivot for SharePoint.
10. Deselect “Add SQL Server Database Relational Engine Services to this installation.”
11. Check your settings against
Figure 8-17 to confirm you have everything configured properly and click Next.
12. From the Feature Selection dialog, click Next.
13. After the Installation Rules dialog says you passed everything, click Next.
14. For the Instance Configuration option, accept the default Instance ID: of POWERPIVOT and click Next.
15. At the Disk Space Requirements dialog, click Next.
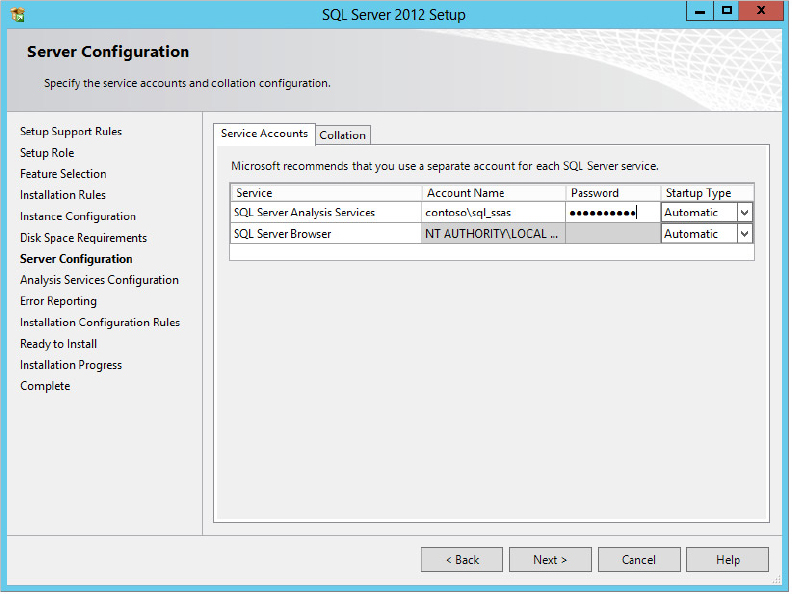
16. For Server Configuration, you need to specify an Account Name for the SQL Server Analysis Services to run as. This should be a dedicated domain user account just for this purpose. In this example use ContosoSQL_SSAS, as shown in
Figure 8-18.
17. For the SQL Server Browser service, accept the default and click Next to continue.
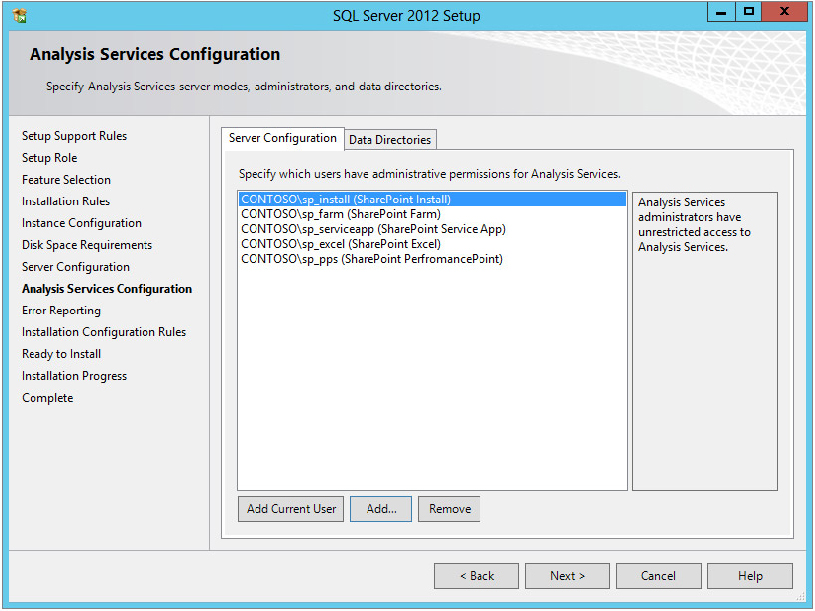
18. On the Analysis Services Configuration screen, click the Add Current User button.
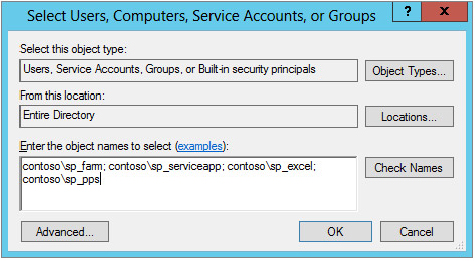
19. Now you must also add the app pool account for your service application, the farm account, and your Excel and PerformancePoint unattended accounts. Click the Add... button.
20. Type the following names if you are using the book examples:
contososp_farm;
contososp_serviceapp;
contososp_excel; and
contososp_pps, as shown in
Figure 8-19, and press OK. If you haven’t created the sp_excel or sp_pps account yet, those are the unattended accounts used for the Excel and PerformancePoint service applications, respectively. You can create them now if you wish or you can add them to the permissions later. These accounts just need to be domain user accounts; they don’t require any other special permissions right now.
21. Double-check your settings against
Figure 8-20 and then click Next.
22. From the Error Reporting screen, click Next.
23. When the Installation Configuration Rules appear, ensure that everything passed and then click Next.
24. From the Ready to Install screen, click Install.
25. If you get a pop-up about rebooting, click OK.
26. When the Complete screen appears, click Close.
27. Now that the install is complete, you should reboot. Most likely you got a pop-up message instructing you to do that.
Now that you have PowerPivot installed on your SharePoint server, you need to configure the SharePoint and PowerPivot integration.
Configuring PowerPivot Integration
To configure the integration between SharePoint and PowerPivot, the SQL team was kind of enough to provide a handy little tool with a very helpful name of PowerPivot Configuration Tool. It works perfectly to do the configuration, you just have to be extra careful when you run it. The tool is just that — a tool — and not really a wizard, so it skips prompting you for information that is important. Be careful, be thorough:
1. Make sure you are still logged into the SharePoint server as your install account. In this example the server is Server and the account is Contososp_install.
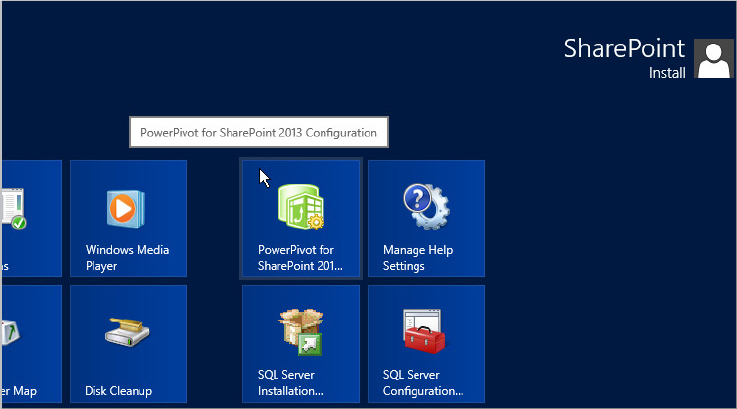
2. From the Start menu, right-click on PowerPivot for SharePoint 2013 Configuration, and run as administrator. Look at
Figure 8-21 to ensure you have the proper link because there are two very similar wizards.
3. When the PowerPivot for SharePoint 2013 Configuration tool opens, click OK to Configure or Repair PowerPivot for SharePoint.
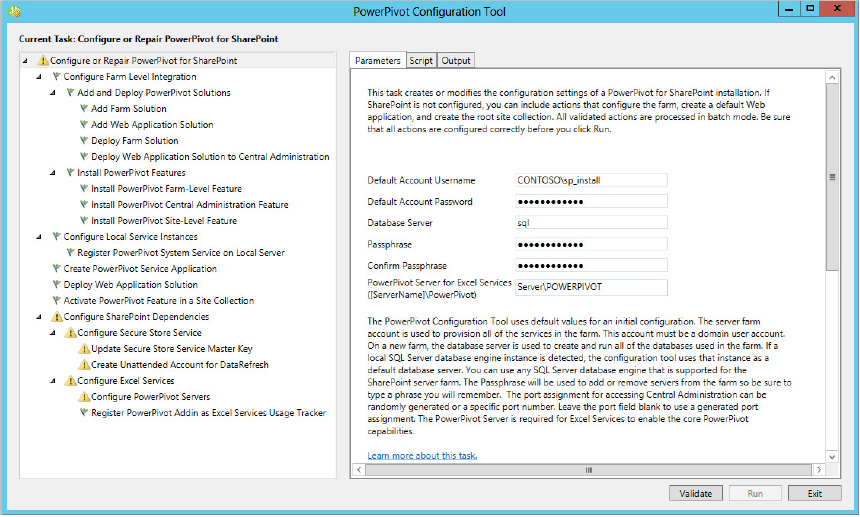
4. The first screen that appears prompts you for several pieces of configuration information. For the Default Account Username, enter your install account. In this example that is Contososp_install.
5. Enter the Default Account Password. In this example that is pass@word1.
6. For Database Server, enter the name of the SQL server that is running the database engine to host the database. In this example that is sql.
7. For Passphrase and Confirm Passphrase, enter a passphrase to allow servers to join or leave this farm. In this example use pass@word1.
8. For PowerPivot Server for Excel Services, enter
your severnamePOWERPIVOT. In this example, enter
serverPOWERPIVOT. Confirm all your settings against
Figure 8-22.
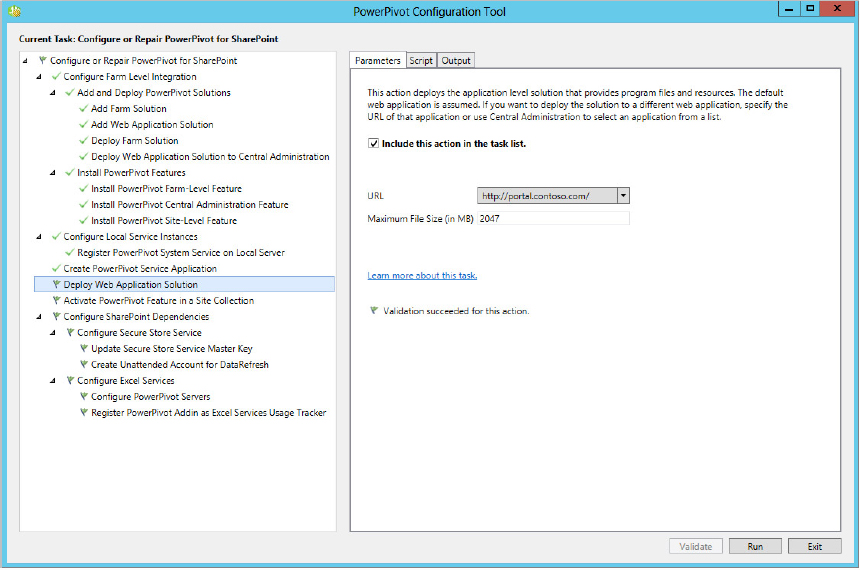
9. In the left-hand pane, click Deploy Web Application Solution.
10. From the drop-down, select the URL of the web application to which you want to deploy the PowerPivot solution. In this example it is
http://portal.contoso.com, as shown in
Figure 8-23.
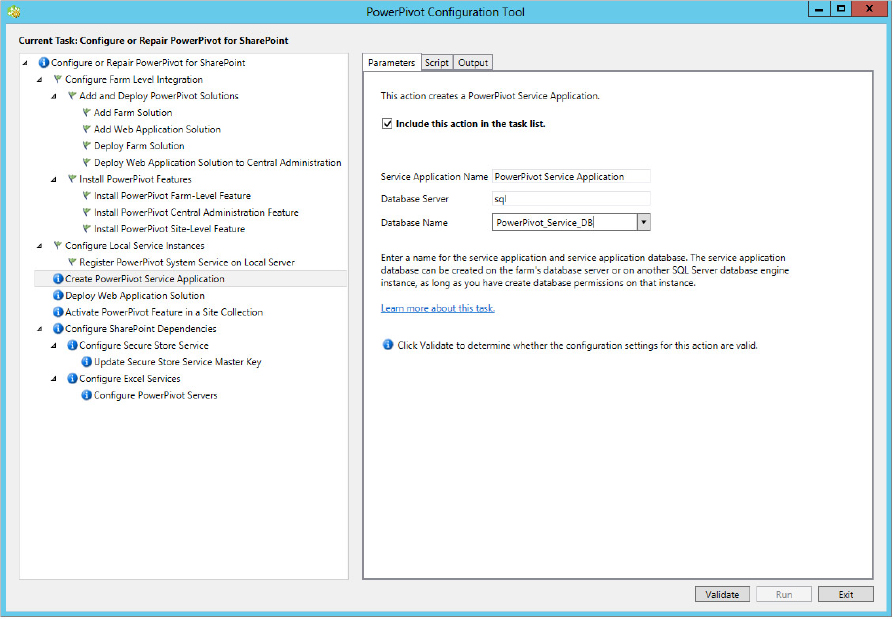
11. In the left-hand pane, click Create PowerPivot Service Application.
12. Change the Service Application Name setting to PowerPivot Service Application.
13. For Database Name, they are trying to sneak in a GUID. Yuck! Change the name to
PowerPivot_Service_DB. Confirm your settings against
Figure 8-24.
14. In the left-hand pane, click Activate PowerPivot Feature in a Site Collection.
16. Poke around the pages and check out the other options available. It never hurts to at least know what buttons you could press. When you are done looking around, click Validate at the bottom of the screen.
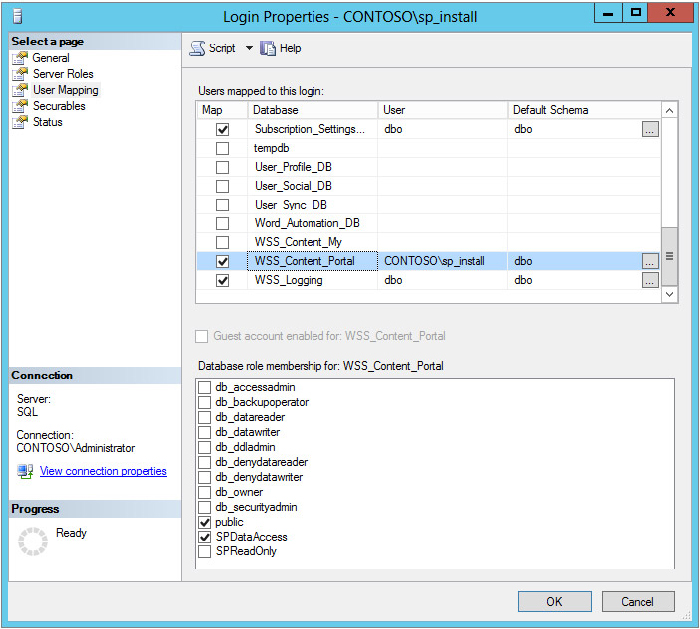
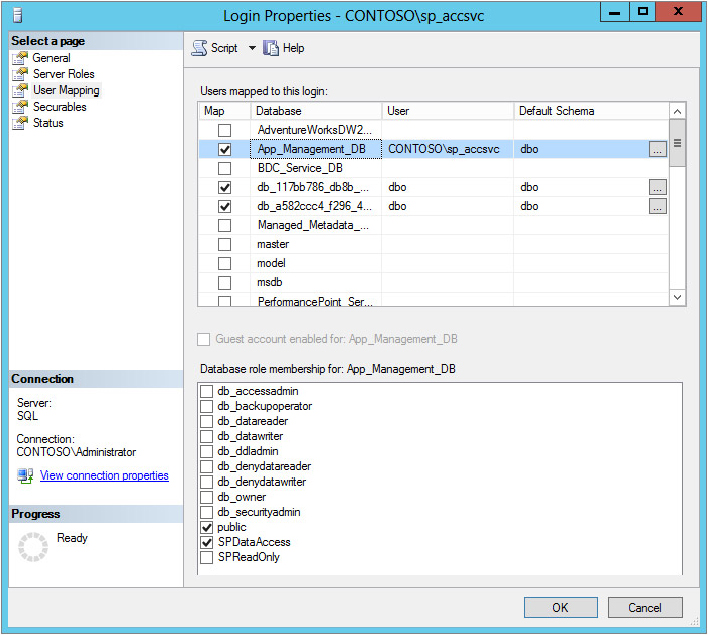
17. If everything has green flags, then you click Run. If not, you need to resolve any errors. A common error is your install account doesn’t have access to the web application or site collection you chose. If that is the case, you need to give the account the SQL Server user mapping of SPDataAccess. You do this from SQL Server Management Studio on your SQL server.
Figure 8-25 shows this setting.
18. At the pop-up Warning, click Yes.
19. After all the processing is finished, a completed pop-up will appear. Click OK.
20. Click Exit to close the PowerPivot Configuration Tool.
Congratulations; you have PowerPivot integrated into your SharePoint farm. You still have a few more things to do, but if you have made it this far you are doing great.
Adding Permissions to Central Administration
If you were to navigate to central admin now and try to open the PowerPivot Service service application, you would just see a lot of errors. This is because the service account doesn’t have access to the central admin content database to query for data. To correct this, you need to set the User Mapping for your app pool account (Contososp_serviceapp) to have the Database role membership for the SharePoint_Admin_Content database of SPDataAccess. Before you do this, the log contains the following error the first time you try to access the service application’s homepage:
System.Data.SqlClient.SqlException (0x80131904): The EXECUTE permission was
denied on the object 'proc_ReturnWebFeatures', database
SharePoint_Admin_Content', schema 'dbo'...
Creating and Configuring a PowerPivot Workbook
Now it is time for the fun stuff — building a PowerPivot workbook and playing with a slicer. To do this, you need to open Excel and add the PowerPivot add-in. Then you connect to the AdventureWorks data you deployed earlier.
Back to the Excel client:
1. Log in to a client machine with Excel 2013 installed. If you don’t have one handy, you can always install Office on one of your test VMs. This isn’t recommended for production but it works fine for learning.
2. Open Excel 2013.
3. From the available templates, choose Blank Workbook.
4. Click the File tab and select Options from the menu.
5. From the left-hand pane, click Add-Ins.
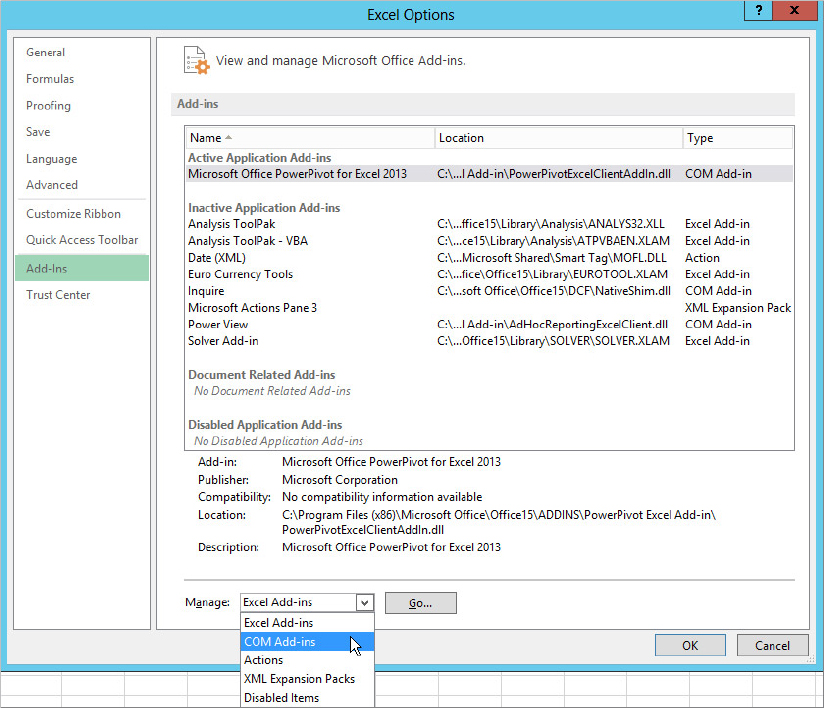
6. At the bottom of the window, click Manage and choose COM Add-ins, as shown in
Figure 8-26.
7. Click Go....
8. Under Add-Ins available, select Microsoft Office PowerPivot for Excel 2013. Click OK.
Now that you have the add-in configured, you are ready to create a data connection:
1. From the Ribbon, click the DATA tab.
2. From the Get External Data section, click From Other Sources.
3. With the fly-out menu displayed, click From Analysis Services.
WHICH SQL SERVER ANALYSIS SERVICES (SSAS) SERVER?
If you were paying attention earlier, you know that when you install PowerPivot on the SharePoint server, that is technically a special instance of SSAS. However, that instance doesn’t house any real data. You installed SSAS on your SQL server and then deployed the AdventureWorks data warehouse and cube. This is your SSAS instance with actual data. Don’t let that PowerPivot instance confuse you.
4. For Server name:, enter the SQL server that is running SQL Server Analysis Services. In this example that is the server named sql. Click Next.
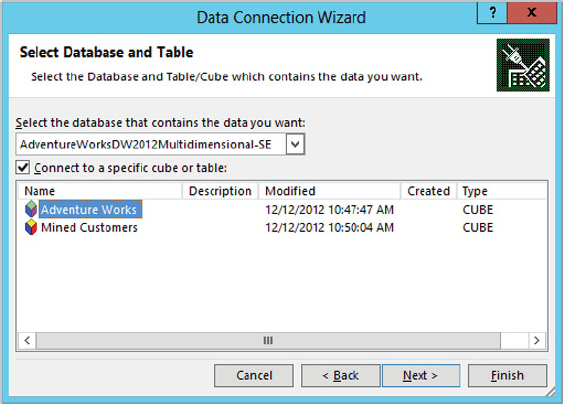
5. From the Select Database and Table dialog, choose AdventureWorks as shown in
Figure 8-27, and click Next.
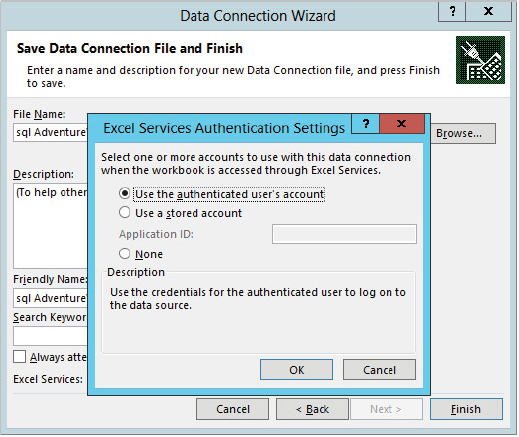
6. In the Save Data Connection File and Finish dialog, all the defaults will work; but before you finish, click Authentication Settings... at the bottom.
After performing step 6 in the preceding list, the dialog shown in Figure 8-28 appears, which contains three options. Before selecting one, it is very important to understand that PowerPivot just enhances Excel Services. Therefore, when you take this workbook in a moment and publish it to SharePoint, PowerPivot is actually doing the heavy lifting on the data side, while Excel Services is responsible for rendering the workbook in the browser.
WHAT IS EFFECTIVEUSERNAME?
EffectiveUserName is a new option in SharePoint Server 2013 that allows you to implement user specific security when connecting to SQL Server Analysis Services in “double hop” scenarios. This is a nice option for environments where Kerberos is not configured, but you want to leverage the use of SSAS Roles to limit the data to which the user has access, based on who they are. The
EffectiveUserName property is configurable in both the PerformacePoint and Excel Services service applications. More information on setting up the EffectiveUserName property can be found at
http://technet.microsoft.com/en-us/library/jj219741.aspx.
If you choose the first option, Use the authenticated user’s account, the behavior is dependent on Excel Services. If Excel Services is configured to use the EffectiveUserName property, then that is how this data connection will be made and no Kerberos is required. Otherwise, using this setting requires you to configure Kerberos authentication.
If you choose the second option, Use a stored account, then you must enter the Application ID of a Secure Store application that you have previously configured to store and map credentials for this data source’s authentication.
Finally, if you choose None then you would either rely on the PowerPivot unattended account that you configured or you would hard-code the authentication information in your connection string.
As you can see, it is crucial to properly configure this information for your environment before you try to get this workbook to render through SharePoint. Remember that while you are connected in the Excel client, it is using the credentials of the user running Excel, not any of the SharePoint server accounts or processes.
1. For this example select “Use a stored account” and then for Application ID: enter Excel Services Application Unattended Service Account.
2. Click OK, and then click Finish.
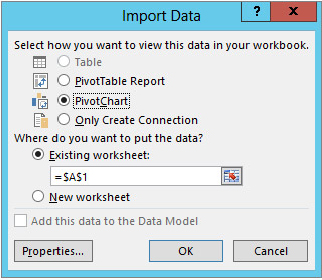
3. At the Import Data pop-up, select PivotChart.
4. Leave the existing worksheet selected, double-check your settings against
Figure 8-29, and click OK.
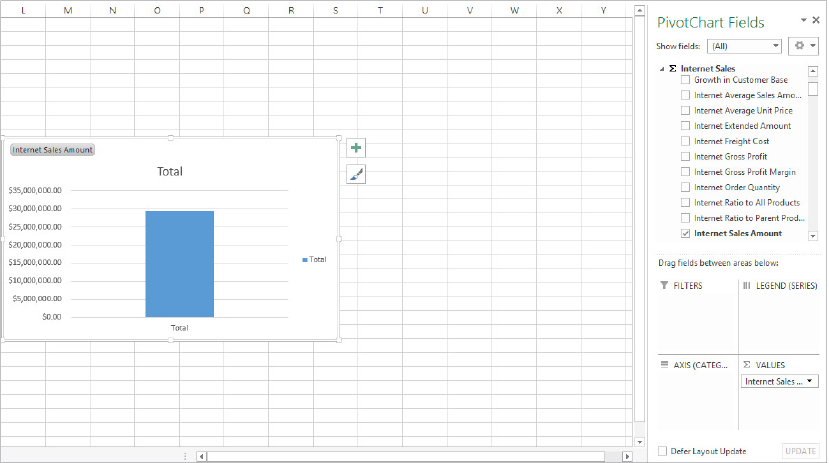
5. From the PivotChart Fields pane on the right, look under Internet Sales and check Internet Sales Amount, as shown in
Figure 8-30.
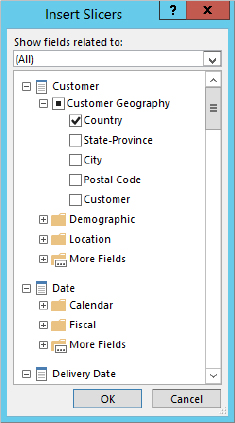
6. From the ANALYZE tab of the Ribbon, click Insert Slicer.
7. From the Insert Slicers window that appears, select Country (under Customer ⇒ Customer Geography) as shown in
Figure 8-31. Click OK.
8. Drag the Country window to the left so it isn’t covering your beautiful chart (see
Figure 8-32).
9. Save your workbook as InternetSales.xlsx to your desktop, and close Excel.
Now that you have a working workbook you need to upload it to SharePoint so you can play with it in the browser:
1. Open a browser to your BI site collection, logged in as a user who has permissions to create a list. In this example that is
http://portal.contoso.com/sites/bi, logged in as contososp_install.
2. From the left-hand navigation, click Site Contents.
3. Click the icon to add an app.
4. Under Apps, select PowerPivot Gallery.
5. In the pop-up window for Name:, enter PowerPivot Gallery, and click Create.
6. Click the icon for the PowerPivot Gallery to open it.
7. From the Ribbon, click the FILES tab. Then, from the FILES Ribbon, click Upload Document.
8. From the pop-up window for Add a document, click Browse..., navigate to the location where you saved the file InternetSales.xlsx., and click on the file and select Open.
9. Back on Add a document, click OK to upload the file.
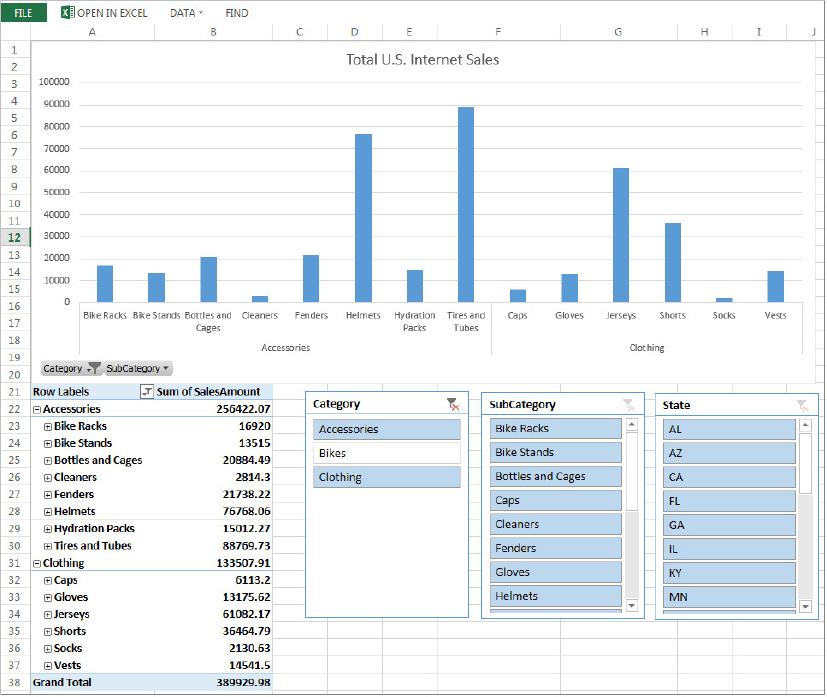
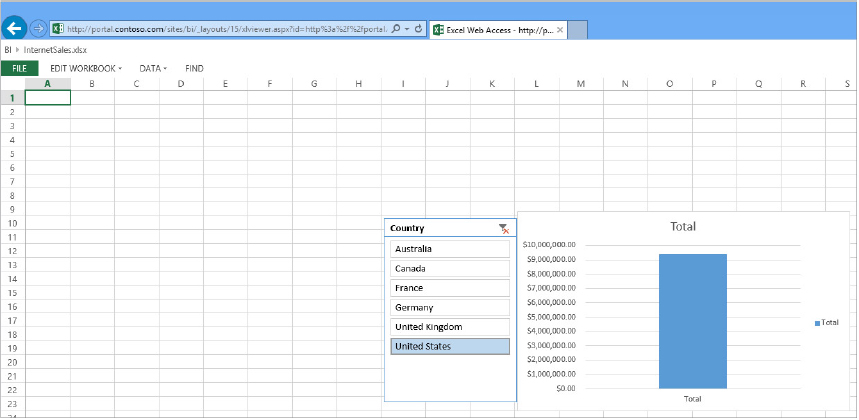
10. From the library, click on the file InternetSales.xlsx to open it in the browser.
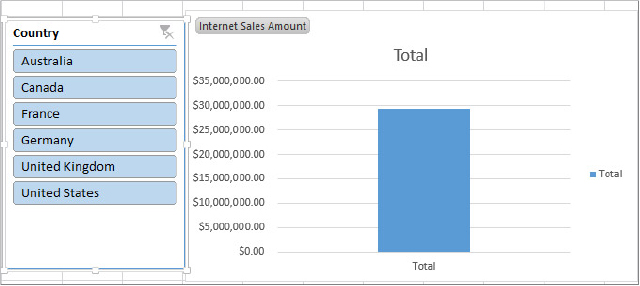
11. The file should open in the browser using Excel Services. Click on the United States slicer.
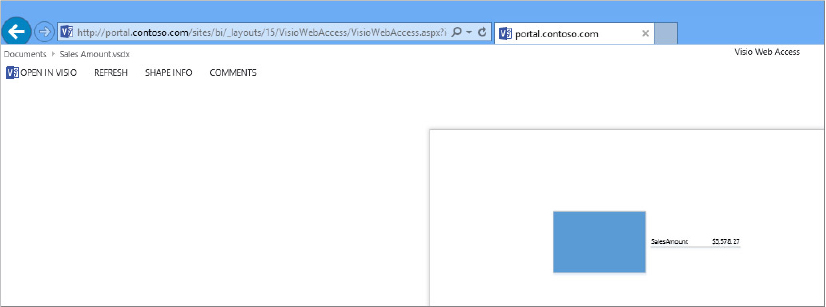
After a moment the bar graph should update to reflect the total sales amount for the United States only, as shown in Figure 8-33. If it does, then you have successfully deployed PowerPivot.
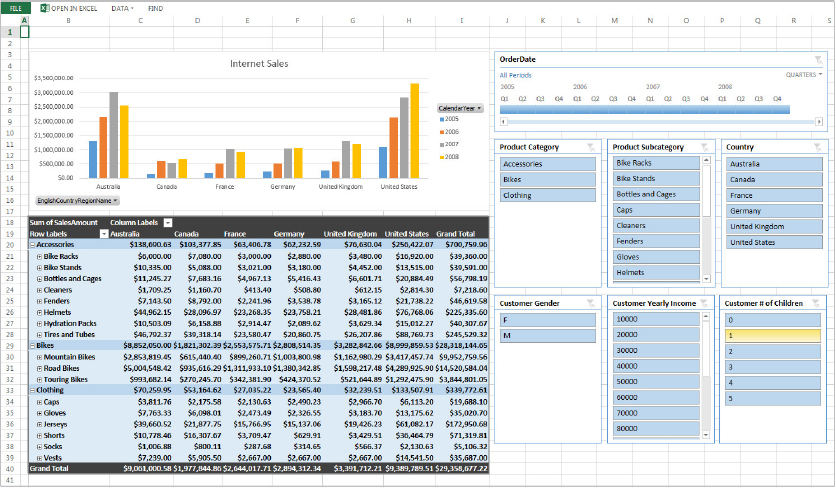
There are literally hundreds of other options and features you can play with using PowerPivot now. You will have to dig into those on your own, however; from an administrator’s point of view, the war is won. Figure 8-34 shows an example of what the BI guy built to show off PowerPivot. Isn’t it pretty?
SQL SERVER REPORTING SERVICES FOR SHAREPOINT 2013
These days, SQL Server Reporting Services (SSRS) is considered the old man of the BI tools. Introduced in 2003 as a component of SQL Server 2000, it is generally used to create static or operational reports that focus on providing data you need. To provide these reports, SQL Server has its own web engine, which looks like it was made in the technological stone age using Paint and Notepad, but in terms of functionality it works well.
Fortunately, the SQL Server team got the memo that SharePoint has become the center of the BI universe, and added a few years ago was the capability to run SSRS in SharePoint integrated mode. In this mode, SSRS retains all its awesome reporting power; but instead of using a website similar to what the cavemen used to sell the wheel, the reports are integrated directly into SharePoint document libraries. This makes SSRS ready to go mainstream, enabling users to work with and access their reports in the same way they do their collaboration documents — in a pretty browser. Even cooler is the automatic inclusion of Report Builder, a click-once application that enables users to build their own reports.
In order to install SSRS in SharePoint integrated mode, you must install both SharePoint and SSRS on the same server. Typically this means inserting your SQL Server disk in one of the application servers in your SharePoint farm. Then you can install just the SSRS components onto that machine. You configure SSRS to store its databases on the same SQL server that SharePoint uses. Remember that means you need a SQL license for your SharePoint server.
SQL Server 2012 Standard Edition provides everything you need to roll out SSRS for most farms, unless you want to use PowerView or you require high availability for SSRS. In that case, you have to use SQL Server 2012 Enterprise. The following example assumes you have SQL Server 2012 Enterprise. If you don’t, then the PowerView material will not be applicable to you.
Follow these steps to install SSRS:
1. Log onto the SharePoint server as your install account. This account needs to be a local administrator on the SharePoint server and have the SQL Server roles of dbcreator, public, and securityadmin. In this example use contososp_install and log onto the server named Server.
2. Run SQL Server setup.exe. Though not required, SP1 or later is recommended.
3. When the SQL Server Installation Center opens, click the Installation link on the left.
4. From the Installation dialog that appears, select the first option, “New SQL Server stand-alone installation or add features to an existing installation.”
5. The Setup Support Rules will run a check to identify any potential problems with your installation. If any issues appear here, make sure you address them. When everything has passed the checks, click OK.
6. Another Setup Support Rules dialog will appear. Ensure you have no failures and click Next. A common warning on this screen is Windows Firewall. If the firewall is enabled you may need to open one or more ports. For SSRS you are not required to open any ports because SharePoint calls the farm locally. Note that you can continue through warnings, but any failures must be corrected before moving on.
7. At the Installation Type screen, click “Perform a new installation of SQL Server 2012.”
8. On the Product Key dialog, enter your product key and click Next.
9. On the License Terms screen, read everything carefully and then if you agree click “I accept the license terms” and click Next.
10. In the Setup Role dialog, choose SQL Server Feature Installation. Click Next.
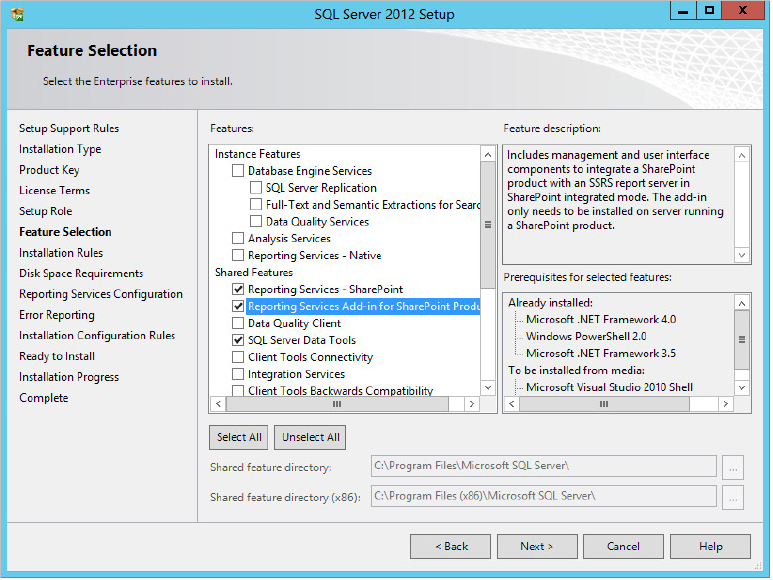
11. In the Feature Selection dialog, under Shared Features, select the following three options:
- Reporting Services — SharePoint
- Reporting Services Addin for SharePoint Products
- SQL Server Data Tools
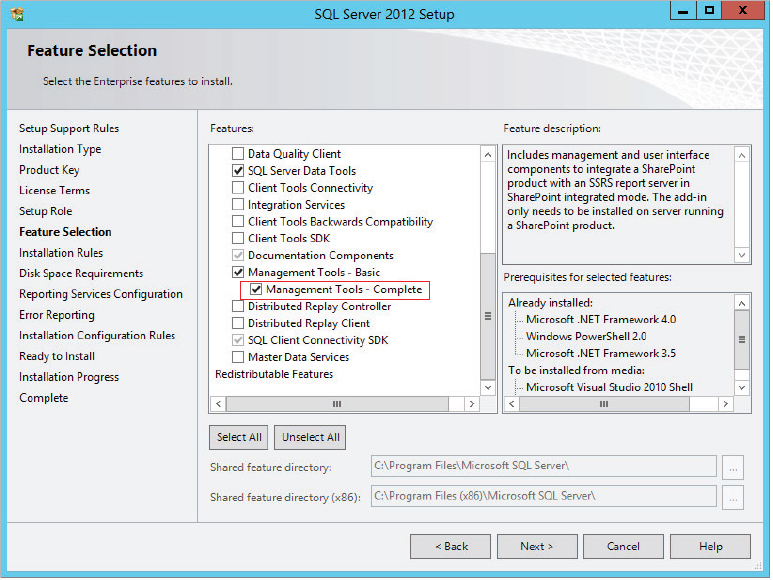
12. Under Shared Features, select Management Tools - Complete, as shown in
Figure 8-36, and click Next.
13. On the Installation Configuration Rules dialog, click Next if everything passes.
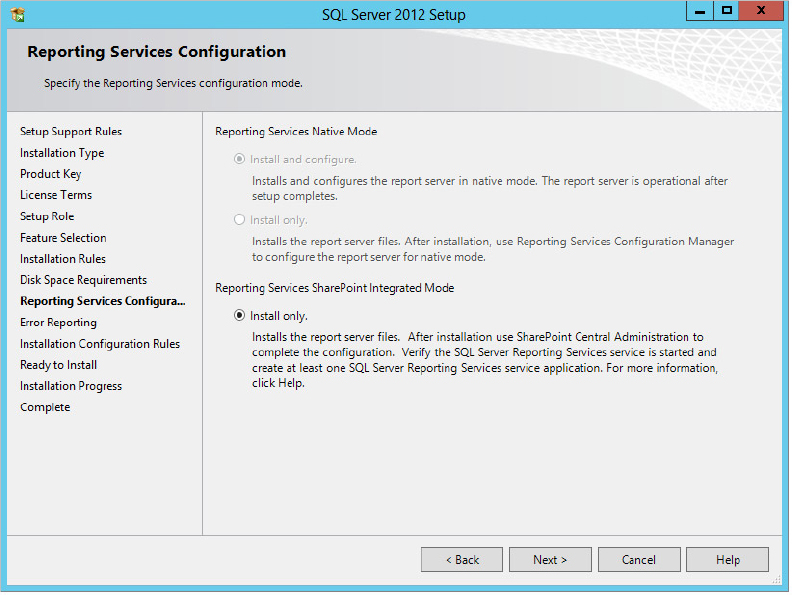
14. On the Disk Space Requirements dialog, click Next.
15. On the Reporting Services Configuration dialog, enable the Install only radio button under the heading Reporting Services SharePoint Integration Mode, as shown in
Figure 8-37. This should be the only option available, with everything else grayed out. If not, double-check your work to this point.
16. On the Error Reporting screen, click Next.
17. From the Installation Configuration Rules screen, click Next when everything passes.
18. From the Ready to Install screen, click Install.
19. When the Complete screen appears, click Close.
That completes the installation of SSRS, which you can now configure for SharePoint integration. If you still have the SQL Server Installer open, you can close it.
Creating the Service Application
In SharePoint 2013 with SQL Server 2012, Reporting Services manifests itself as a separate service application, unlike its predecessors, which were integrated in a less streamlined way.
To create the service application, perform the following steps, which assume you have followed the farm installation procedures described in Chapter 3:
1. From the homepage of Central Administration, click Manage service applications.
2. In the SharePoint Ribbon, click the New button.
3. From the New menu, click SQL Server Reporting Services Service Application.
4. For Name, enter SSRS.
5. For Application Pool, select Use existing application pool.
6. From the drop-down, select Default SharePoint Service App Pool.
7. For Database server:, leave the default, which is your SharePoint default SQL server. In this example it is sql.
8. In the Database name: field, they are trying to slip in another GUID on you. Change it to ReportingServices_DB.
9. For Web Application Association, select the web application for which you want SSRS available. In this example that is
http://portal.contoso.com.
10. Click OK to create the service application.
11. Once the service application is created, a pop-up will appear about configuring the SQL Server Agent. This is not a required step and it is outside of the scope of this book. Click OK to continue.
Creating and Deploying an SSRS Report
Now that you have SSRS installed and your service application up and running, it is time to try it out. What good is such an awesome tool if you don’t have a clue how to use it?
Create your report with the following steps:
2. Click the gear icon at the top of the page.
3. From the drop-down, select Site settings.
4. Under the Site Collection Administration section, click the link for Site collection features.
5. Scroll down the list and click Activate for the Report Server Integration Feature.
6. On the left, click Site Contents.
7. Click the icon to add an app.
8. Under Apps you can add, click Report Library.
9. From the pop-up window for Name:, enter SSRS Reports.
10. Click Create.
11. Back on the Site Contents page, click SSRS Reports to open the library.
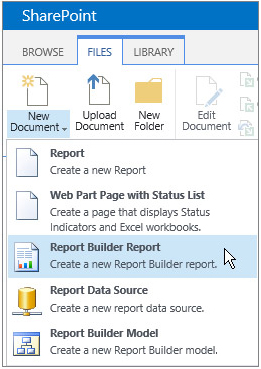
12. From the Ribbon, click the drop-down for New Document.
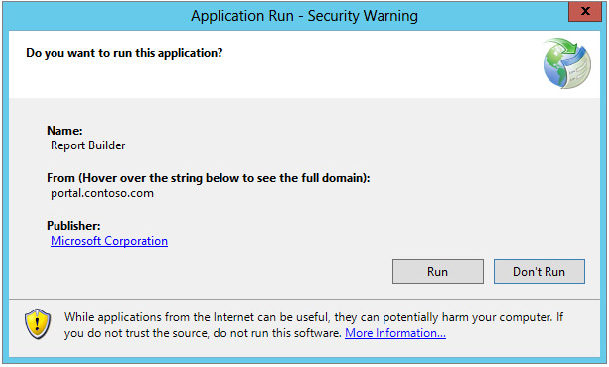
14. A ClickOnce application will try to launch. At the pop-up window, click Run, as shown in
Figure 8-39.
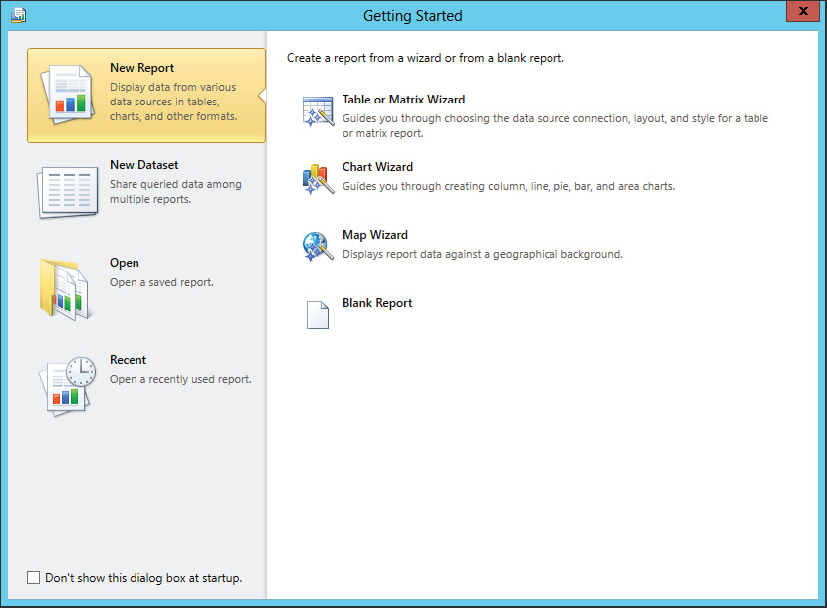
15. A window will appear while the tool downloads and processes. This installer is being downloaded from your SharePoint server, not the Internet. When it is complete, the Getting Started window for Report Builder will open, as shown in
Figure 8-40. Click the top option, Table or Matrix Wizard.
REPORT BUILDER
Report Builder is an application that is used to build SSRS reports. You can download it free from
Microsoft.com and manually install it, but that isn’t necessary when SSRS is integrated with SharePoint, as a content type called Report Builder Report is created. Clicking that link launches a special kind of application called a ClickOnce application. The first time you click the link, Report Builder is downloaded from the SharePoint server directly, after which it will just be launched automatically. It’s a great way to avoid having to roll out more software through your IT department.
16. From the Choose a dataset screen, accept the default of Create a dataset and click Next.
17. On the Choose a connection to a data source screen, click New....
18. From the Data Source Properties screen, click the Build... button.
19. For Server name:, enter your SQL server name. In this example use sql.
20. Under Select or enter a database name:, click the drop-down and select AdventureWorksDW2012. Click OK.
21. Back in the Data Source Properties window, click Credentials.
22. Select “Use this user name and password.”
23. For User name:, enter an account that has access to the selected database. In this example use Contososql_read.
24. For Password:, enter the password. In this example it is pass@word1.
25. Check the box for “Use as Windows credentials” and then click OK.
26. In the “Choose a connection to a data source” window that appears, your new connection is highlighted. Click Next to use that data source.
27. The New Table or Matrix window will open. Expand out Tables, select the following from the list, and click Next:
- DimCustomer
- DimGeography
- FactInternetSales
28. From the Available fields, drag SalesAmount under Values.
29. From the Available fields, drag EnglishCountryRegionName under Row groups. Click Next.
30. For Choose the layout, click Next.
31. For Choose a style, click Finish.
THE MAGIC OF REPORT BUILDER
If you were paying attention, you likely noticed in step 27 that you selected three different tables; but when you created the report you used only two items. That is the magic that is Report Builder. SalesAmount and EnglishCountryRegionName don’t have a direct relationship but they both share a key with DimCustomer that establishes the necessary relationship. Report Builder handles such relationships for you.
Before you publish the report you might want to make it slightly prettier. If the following steps seem too complicated or hard to follow, you can skip them. Your previous experience with this type of editor will likely determine whether this makes sense or not.
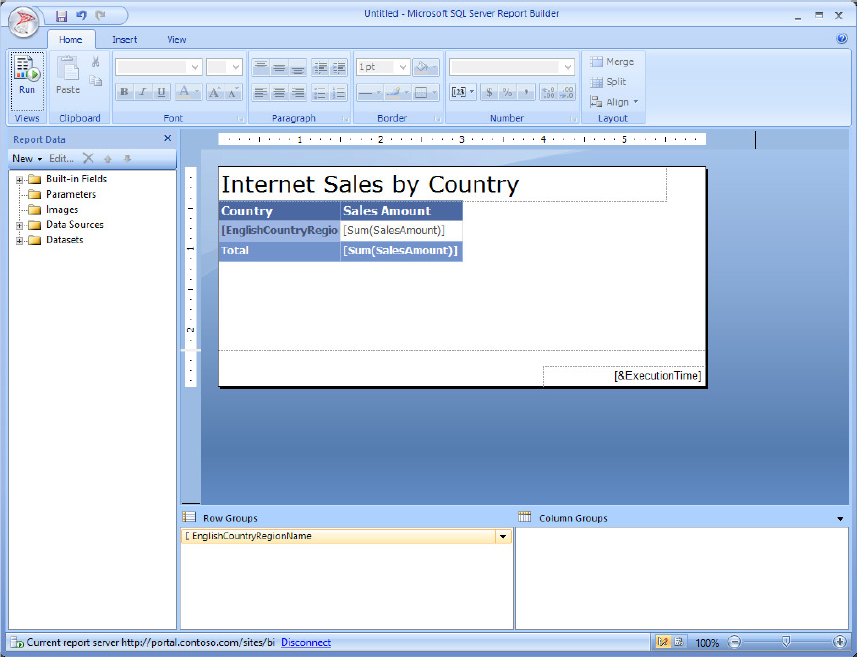
1. From the design pane, click the column head for English Cou. Edit the text to say Country.
2. At the top of the screen, click the heading of “Click to add title” and change it to say Internet Sales by Country.
3. Click the white box that says [Sum(SalesAmo.
4. From the Ribbon, click the $ button to format that column as currency.
5. Click the blue box below it that says [Sum(SalesAm.
6. From the Ribbon, click the $ button to format that column as currency.
7. Resize the first column by dragging it out to the 1.5-inch mark in the ruler.
8. Resize the second column by dragging it out to the 3-inch mark in the ruler.
9. Figure 8-41 shows the result of the previous steps. After verifying that everything looks good (or good enough), click the Save icon in the top-right corner of the window.
11. For Name:, enter Internet Sales by Country. Click Save.
12. Open your browser to the SSRS library. In this example the URL would be
http://portal.contoso.com/sites/bi/ssrs reports. If the browser is already in the library, then you need to refresh the page.
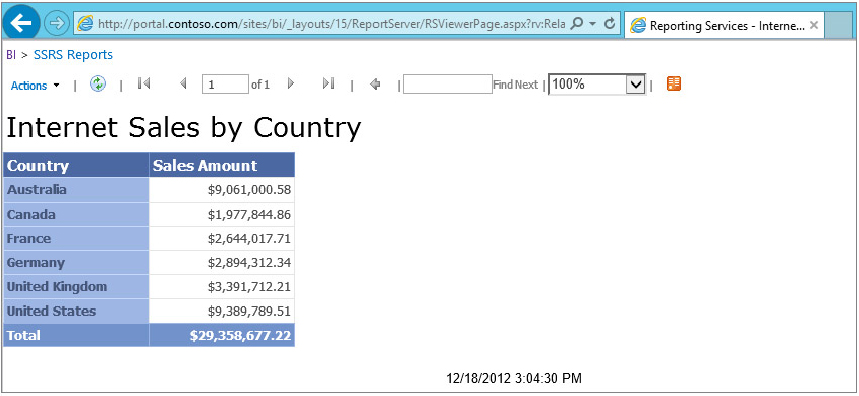
13. Click on the report Internet Sales by Country to open it. After a moment to load, you should see something similar to
Figure 8-42.
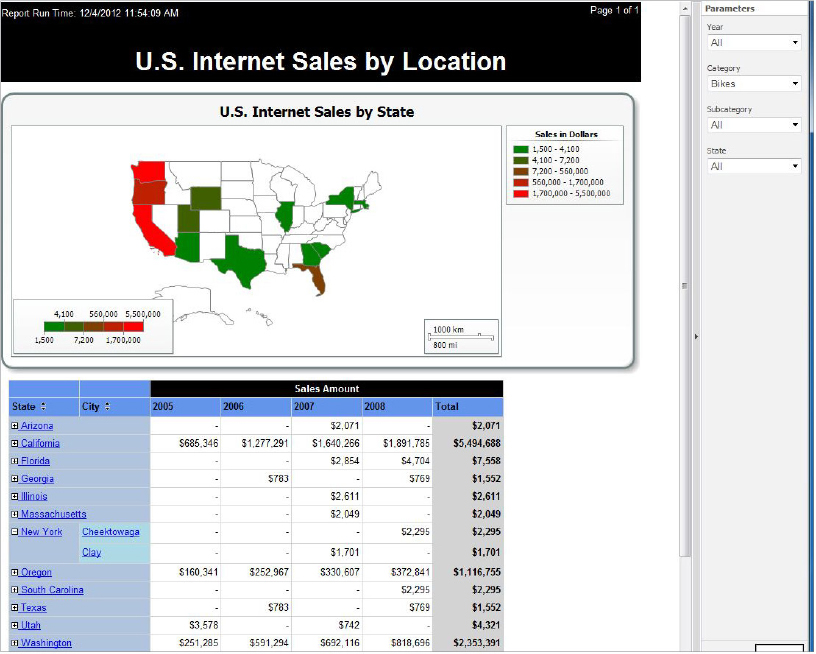
That will do it, folks. You have successfully built and deployed an SSRS report. While it might not win any awards, it gets the job done; and you have seen how you can easily customize it with simple changes such as formatting numbers as currency and updating the headings to be more meaningful. Unfortunately, all that fun stuff is beyond the scope of this book, but Figure 8-43 shows an example of a rather awesome report that was built by a trained BI ninja against that same AdventureWorks data set.
PowerView
PowerView is installed as part of SQL Server 2012 Reporting Services. It enables end users to easily and intuitively create ad-hoc reports from within their browser using either PowerPivot or SSAS tabular data models as the data source. PowerView has an impressive assortment of visualization options, and even animations, that can be used to make your reports a highly interactive experience for the user. Because PowerView is dependent on either a PowerPivot or an SSAS tabular model, you need to have the Enterprise version of SharePoint, and either an Enterprise or Business Intelligence version of SQL Server in order to use it.
Follow these steps to enable PowerView in your farm:
2. Click the gear icon at the top of the page.
3. From the drop-down, select Site settings.
4. Under the Site Collection Administration section, click the link for Site collection features.
5. Scroll down the list and click “Activate for the PowerView Integration Feature.”
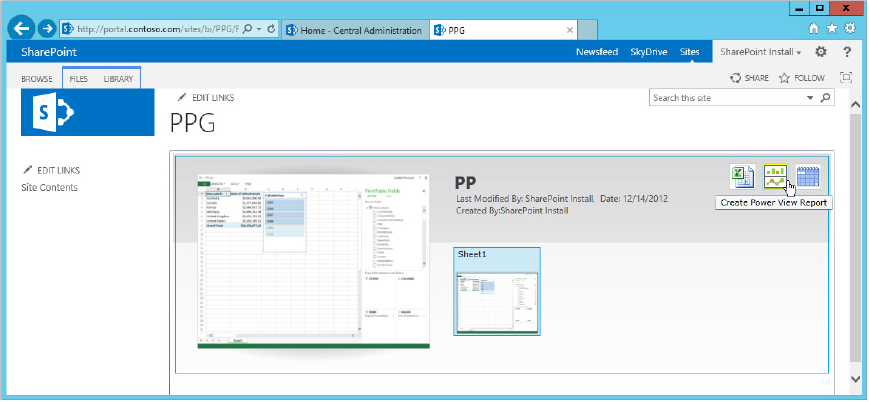
That’s all you need to do have the PowerView functionality available within your site collection. One way to confirm you were successful is by navigating to a PowerPivot Gallery, where you should now see an icon for PowerView to the right of your workbook, as shown in Figure 8-44.
If you’re wondering what you can do with PowerView, Figure 8-45 shows what that crazy BI guy came up with this time. It has so much going on it looks more like a fancy cartoon than a real report; but it is a real report. Wow!
CONFIGURING PERFORMANCEPOINT SERVICES
PerformancePoint is all about putting together dashboards. Within PerformancePoint you can create KPIs, scorecards, filters, and several different types of reports and charts. Those components can then be used to construct dashboards that are relevant to the end user. PerformancePoint can also incorporate into its dashboards reports you’ve created in other tools such as Excel Services and Reporting Services, so you can leverage those technologies as well.
PerformancePoint also has some very powerful analytic tools such as the analytic chart and the decomposition tree. These tools enable users to navigate through data dynamically by drilling up, down, or even across different areas of their data. PerformancePoint is both flexible and customizable, empowering end users to explore and analyze data in the way that best suits their decision making.
In this section you will configure the PerformancePoint Services application, create an unattended service account for PerformancePoint, and then construct and deploy a simple dashboard to confirm that the service is up and running.
The following steps walk you through the process of creating a PerformancePoint service application. If you followed Chapter 3 step by step, then you have already done this exercise.
With this service application, in order to properly connect to Analysis Services you must also install ADOMD.NET v11, which is interesting because the SharePoint prerequisite installer already installed v9 for you. You also might find some situations require v10. Oh, the mysteries of BI. Keeping with the script, install v11 before continuing. No reboot is usually required, so it should be pretty easy:
2. At the Welcome dialog, click Next.
3. Read the license, select “I accept the terms in the license agreement,” and click Next.
4. At the Ready to Install dialog, click Install.
5. At the setup completion screen, click Finish.
To create the service application, follow these now familiar steps:
1. Log onto your SharePoint box as the install account. In this example use contososp_install.
2. Open SharePoint Central Administration.
3. Under the Application Management heading, click Manage service applications.
4. From the Manage service applications screen, click the New button in the Ribbon.
5. From the menu, select PerformancePoint Service Application.
6. For Name, enter PerformancePoint Service.
7. Check the box for “Add this service application’s proxy to the farm’s default proxy list.”
8. For Database Name, enter PerformancePoint_Service_DB. This time you are removing the spaces and the GUID from the name. Spaces are even worse than GUIDs.
9. Scroll down to Application Pool and select Use existing application pool.
10. From the drop-down, select Default SharePoint Service App Pool.
11. At the bottom of the page, click Create.
12. After a minute a pop-up window will appear, indicating that the service application was created successfully and specifying the additional steps you need to perform. Click OK.
Now that the service application is created, you need to start the service:
1. From the left-hand menu of Central Administration, click Application Management.
2. Under the Service Applications section, click Manage services on server.
3. Find PerformancePoint Service and click Start to the right of it.
Next, grant the application pool service account access to the SharePoint Content database by following these steps:
1. Log onto your SharePoint box as the install account (CONTOSOsp_install in this case).
2. Open the SharePoint 2013 Management Shell as administrator by right-clicking on it and then clicking Run as administrator.
3. At the prompt, type the following PowerShell command and press Enter:
$w = Get-SPWebApplication -identity http://portal.contoso.com
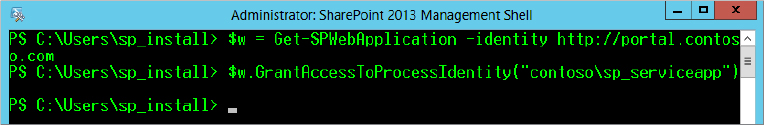
4. At the prompt, type the following PowerShell command and press Enter. Use
Figure 8-46 to confirm your work.
$w.GrantAccessToProcessIdentity("contososp_serviceapp")
Now that the PerformancePoint Services service application is up and running, you need to create a new unattended service account for it to use when accessing data from outside sources.
Configuring PerformancePoint Services to Use the Secure Store
The PerformancePoint dashboards need to be capable of accessing data located in the AdventureWorks SSAS cube. In order to get that working, you need to make a few additional configurations, such as setting up an unattended service account in the Secure Store for PerformancePoint Services to use. The unattended service account will tell PerformancePoint Services what account to use when you attempt to refresh data in the dashboards.
This section assumes you have already performed the necessary steps to create the Secure Store service application in SharePoint and generate a key for it. If not, please see the section, “Configuring the Secure Store,” in Chapter 3 for details.
1. Log onto your SharePoint box as the install account. In this example use contososp_install.
2. Open SharePoint Central Administration.
3. Under the Application Management heading, click Manage service applications.
4. Click the PerformancePoint Services service application, and then click PerformancePoint Service Application Settings.
5. Select the Unattended Service Account radio button if it is not already selected.
6. Enter the User Name. In this example it would be contososp_pps. This account just needs to be a regular domain user and have access to your SSAS cube.
7. Enter the password. For this example use pass@word1.
8. Click OK to close the PerformancePoint Service Application Settings screen.
Now that the unattended service account has been set up in the Secure Store, you need to tell SharePoint which users are allowed to use it. In this case, all domain users should be able to use the account. Configure access to the unattended service account as follows:
1. Log onto your SharePoint box as the install account. In this example use contososp_install.
2. Open SharePoint Central Administration.
3. Under the Application Management heading, click Manage service applications.
4. Click on the Secure Store service application.
5. Look for a Target Application ending with “PPSUnattendedAccount” and click on it.
6. Add an e-mail address for the contact e-mail, and then click Next. In this example use
[email protected]. Fake e-mail addresses can be fun.
7. Click Next on the Edit Secure Store Target Application screen, which displays the field name and field type of the service account being used.
8. The Edit Secure Store Target Application page contains two sections: Target Application Administrators and Members. The Members section shows the list of users and groups that are allowed to use the unattended service account. To configure this application so everyone can use it, add your domain users group here. In this example enter contosodomain users.
9. Click OK to update the Secure Store.
Now that your unattended service account is ready to go, you need to give that account access to the SSAS cube by creating a role inside of SSAS. After that role is created, you add the unattended service account to it:
1. Log onto your SQL server as the administrator account. In this example use contosoadministrator.
2. Open SQL Server Management Studio and connect to SSAS by selecting Analysis Services as the server type.
3. For the server name, enter your SQL server’s name. In this example it is sql. Click Connect.
4. In the Object Explorer window of SQL Management Studio, expand the Databases folder.
5. Expand the AdventureWorksDW2012Multidimensional-SE database, and right-click on the Roles folder.
6. From the drop-down menu, select New Role.
7. In the Role name text box, type PPS Services.
8. Click Membership on the left-hand side of the Create Role dialog.
9. Click the Add button on the Membership dialog.
10. Add contososp_pps to the role.
11. Click Cubes on the left-hand side of the Create Role dialog. When the Cubes dialog appears, change the Access column for the AdventureWorks cube to Read. Click OK.
PerformancePoint services should now be ready to connect to the AdventureWorks SSAS cube. At this point the only thing left to do is confirm that everything is working by creating and deploying a dashboard, which is exactly what the next section covers.
Testing the PerformancePoint Services Unattended Service Account
Now that the environment is ready to support PerformancePoint dashboards with external data connections to the AdventureWorks SSAS cube, you are going to create an example using SharePoint Dashboard Designer to confirm that everything is up and running as expected. The goal here is simply to test PerformancePoint functionality, so keep the dashboard as simple as possible:
1. Log onto your SharePoint box as the install account. For this example use contososp_install.
3. Click the Site Contents link on the left-hand side of the screen.
4. Click the PerformancePoint Content library to open it.
5. Click New item at the top of the screen.
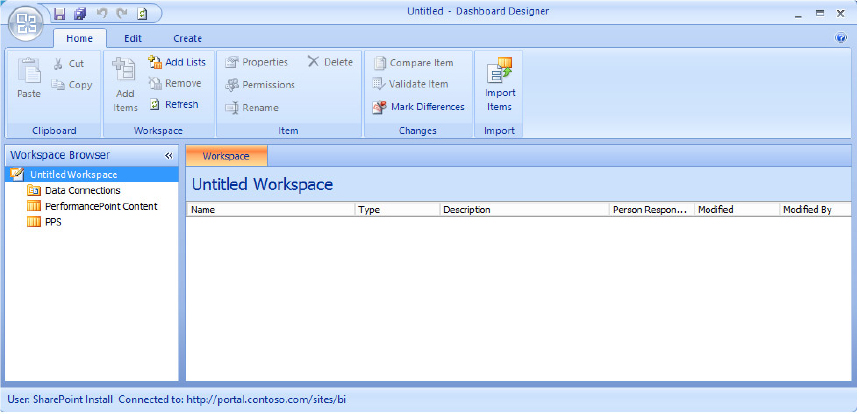
6. If this is your first time opening Dashboard Designer, you will be prompted to download and install the application. Approve the download and install.
Figure 8-47 shows Dashboard Designer in all of its glory.
Once Dashboard Designer has been installed, it should open the application automatically. You will need to create a few different objects, including a data source, an analytic chart, and then finally a dashboard. The next few sections walk you through creating each of these items.
Creating a Data Source in Dashboard Designer
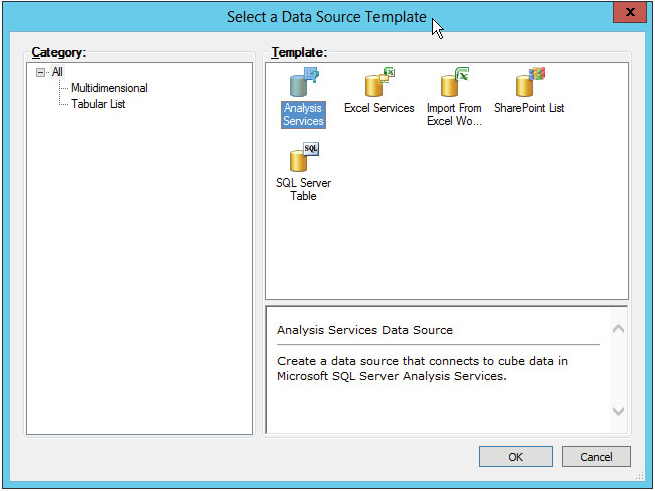
1. With Dashboard Designer open, click the Create tab at the top-left corner of the window.
2. Click the Data Source icon from the Dashboard Items section.
3. Select Analysis Services as the template, as shown in
Figure 8-48, and then click OK.
4. Ensure that Use Standard Connection is selected.
5. In the text box labeled Server, enter your SQL server’s name. In this example use sql.
6. In the Database drop-down, select AdventureWorksDW2012Multidimensional as the database. If you don’t see any databases available, please see the tip.
WHY ISN’T MY DATABASE DISPLAYED IN THE DROP-DOWN?
At the time of writing, we had to install ADOMD.NET 10 on our SharePoint server in order for our available SSAS database to be displayed in the Database drop-down. If this hasn’t been resolved by the time you read this, you can download ASADOMD10.msi as part of the Microsoft SQL Server 2008 R2 SP1 Feature Pack at the following URL (be sure to get the correct version x64/IA64 for your server):
1. In the Cube drop-down, select AdventureWorks as the cube. Leave the Authentication set to Unattended Service Account.
2. Click the Test Data Source button to ensure you are able to connect to the cube.
3. Click the Properties tab of the New Data Source window.
4. In the Name text box, type PPSTest to rename the data source. You need to click out of the Name text box before the data source name will change in the Workspace Browser window on the left.
5. Right-click on the PPSTest data source in the Workspace Browser on the left, and then select Save. It’s important that you save the data source before moving on to create the analytic chart, as not doing so can prevent the data source from being available to your chart.
Creating an Analytic Chart in Dashboard Designer
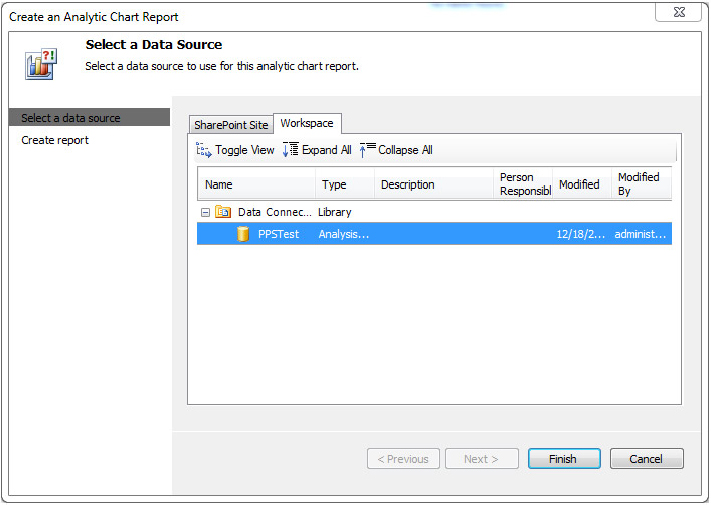
Now that the data source is set up, the next thing to do is create a chart that will ultimately reside on the example dashboard. Follow these steps to create an analytic chart:
1. With Dashboard Designer open, click PerformancePoint Content in the Workspace Browser.
2. Click the Create tab at the top-left corner of the dialog.
3. Click Analytic Chart in the Reports section of the Create tab. The menu on the Create tab is context sensitive, so make sure you have PerformancePoint Content highlighted in the Workspace Browser if you don’t see Analytic Chart as an available option.
4. Choose PPSTest as the data source as shown in
Figure 8-49 and then click Finish.
5. While the report item is being created you may be prompted for your credentials. If so, use the account you are logged in with. In this example that is contososp_install.
6. On the Design tab of the new analytic chart, in the Details pane on the far right side of the screen, expand Measures.
7. Under Measures, locate Average Sales Amount, right-click it, and select Move To Bottom Axis.
8. Collapse Measures.
9. Expand Dimensions in the Details pane.
10. Under Dimensions, expand Date. Under Date, expand Calendar, and then right-click Calendar Year.
11. From the drop-down menu, select Move To Series.
12. Click the Properties tab near the top of the report.
13. In the Name field, type Avg Sales by Year.
14. Click out of the Name field so that the name change takes effect.
15. In the Workspace Browser of Dashboard Designer, right-click the report and then click Save.
Creating and Deploying a Dashboard in Dashboard Designer
Now that you have created the report, follow these steps to place the new report into a dashboard and deploy it to SharePoint:
1. With Dashboard Designer open, click PerformancePoint Content in the Workspace Browser.
2. Click the Create tab at the top-left corner of the dialog.
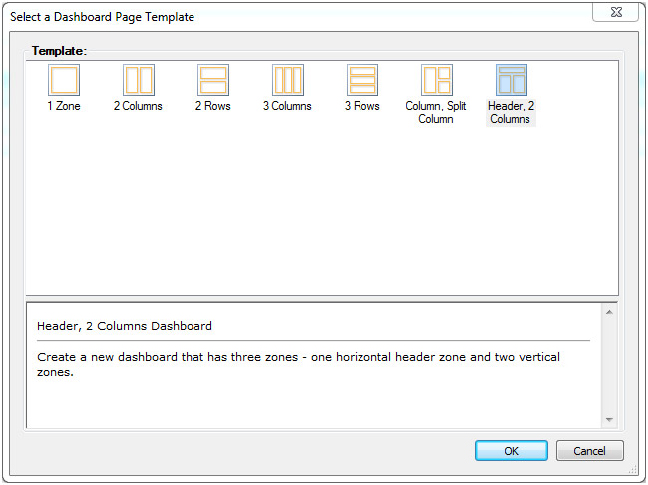
3. Click Dashboard in the Reports section of the Create tab. The menu on the Create tab is context sensitive, so make sure PerformancePoint Content is highlighted in the Workspace Browser if you don’t see it as an available option.
4. In the Select a Dashboard Page Template window, select 1 Zone for the template type, as shown in
Figure 8-50. Click OK.
5. With your new dashboard open, locate the Details window on the right and expand Reports.
6. Under Reports, expand PerformancePoint Content.
7. Add the Avg Sales by Year report to the dashboard by clicking and dragging it from the Details pane into the Dashboard Content window in the middle of the screen.
8. Click the Properties tab near the top of the dashboard.
9. In the Name field, type Test Dashboard.
10. Click out of the Name field so that the name change takes effect.
11. In the Workspace Browser of Dashboard Designer, right-click the dashboard.
12. From the drop-down menu, click Deploy to SharePoint.
13. In the Deploy To window, click OK.
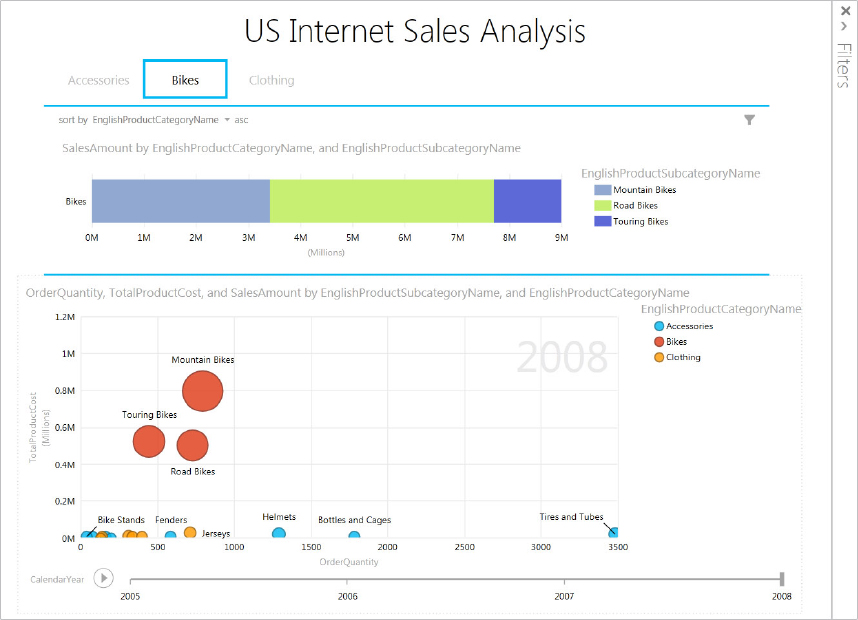
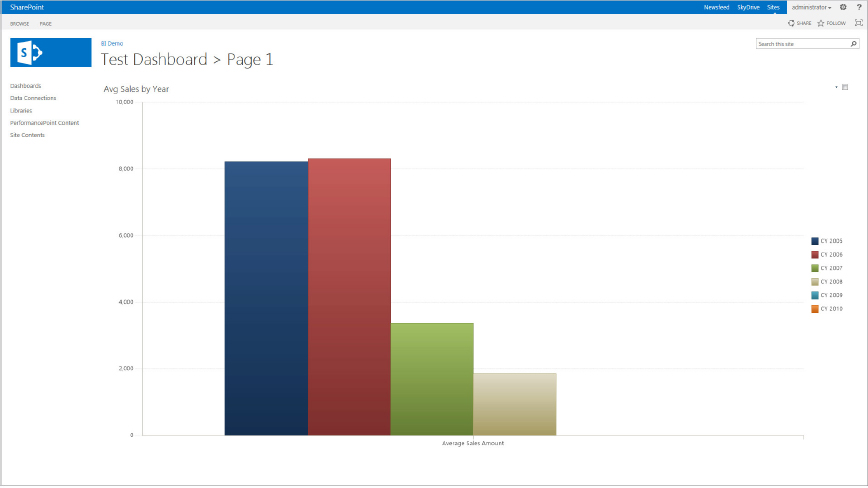
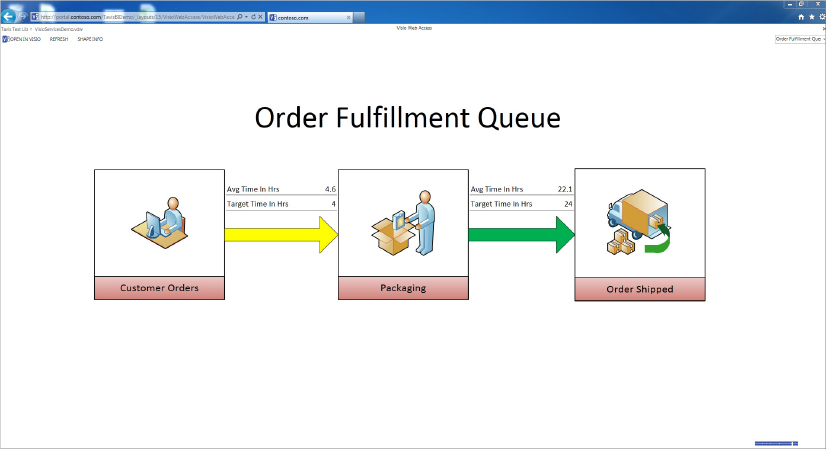
After clicking OK, you should be presented with a progress window informing you that your dashboard is being deployed. When it’s finished, your browser will automatically open to the URL to which your dashboard was deployed, where you can bask in the greatness of your own BI dashboard. Figure 8-51 shows an example of what you just built. Rejoice! You have successfully configured and tested PerformancePoint.
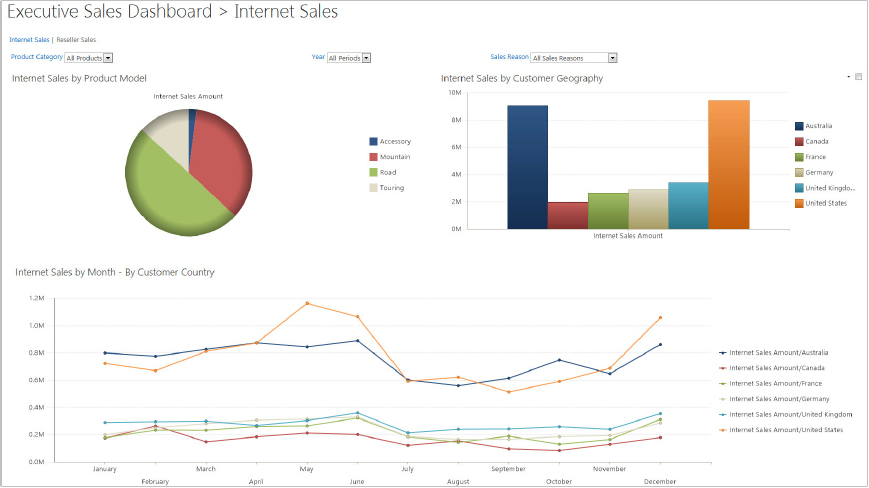
Of course, just to make sure you don’t feel too awesome, Figure 8-52 shows you what the BI ninja built to show off. It is OK if you are starting to not like him.
CONFIGURING VISIO SERVICES
Visio Services enables you to tie data to visualizations created in Visio. Once uploaded to SharePoint, users don’t need to have Visio installed on their computer to view the Visio workbook. This is a great option if you have diagrams of processes or workflows, and supporting data available to show status, progress, and so on. This section steps through configuring the Visio Services service application in SharePoint and creating an unattended service account for the service to use when it refreshes data. Once that’s done, you will test the configuration by creating a simple Visio diagram that pulls data from the AdventureWorks database.
MORE TOMATO OR “TAMAHTO”
You may notice sometimes this service application is called Visio Services and sometimes it is called Visio Graphics Service. Technically both are correct. Generally speaking people will use the name Visio Services and most of TechNet is written that way but in the Central Administration site you will see Visio Graphics Services when you create a new service application. Don’t let it confuse you. The two terms are interchangeable.
Configuring the Visio Unattended Service Account
Unlike some of the other service applications that you have configured, you need to manually create the unattended service account for Visio in the Secure Store service application. Once the unattended account is created, you associate it with Visio Services during the configuration process. The first step is to create the unattended service account:
1. Log onto your SharePoint box as the install account. In this example use contososp_install.
2. Open SharePoint Central Administration, and click Manage service applications under the Application Management heading.
3. Click the Secure Store service application.
4. Click New at the top of the screen in the Manage Target Applications section.
5. In the Target Application ID text box, enter Visio.
6. In the Display Name text box, enter Visio.
7. In the Contact E-mail text box, enter an e-mail address. In this example use
[email protected].
8. For Target Application Type, select Group from the drop-down menu. Click Next.
9. Accept the default Field Names and Field Types by simply clicking Next.
10. In the Target Application Administrators text box, enter your account. In this example use contososp_install.
11. In the Members text box, enter contosodomain users. Click OK.
After clicking OK, you are taken back to the main window of the Secure Store service application, where you should now see a Target Application ID of Visio in the list.
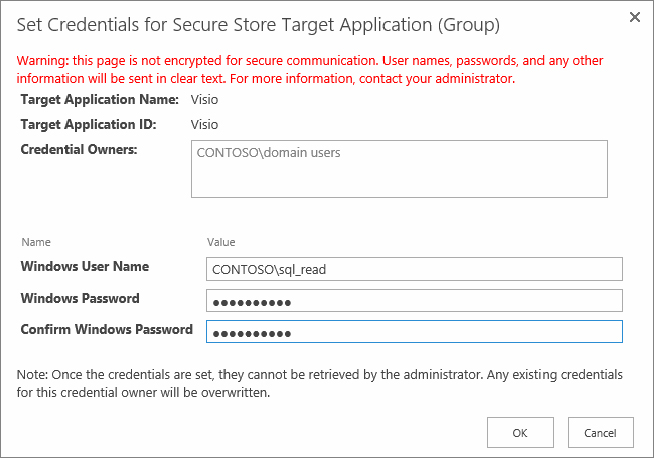
Follow these steps to set the credentials of the account that will be used to refresh data:
1. Select the Visio Target Application ID by checking the box to the left of Visio.
2. Click the Set icon in the Credentials area of the Edit Ribbon at the top of the page.
3. In the Windows User Name text box, type the name of your SQL read account. In this example, you previously configured contososql_read.
4. Enter the password and confirm it. In this example it is
pass@word1. When you are done, your page should look like
Figure 8-53. Click OK.
Configuring the Visio Graphics Service Application
Now that the unattended service account is ready to roll, you will create and configure the Visio Graphics Services service application. If you followed all of Chapter 3, you have already done these steps:
1. Log onto your SharePoint box as the install account. In this example use contososp_install.
2. Open SharePoint Central Administration, and under the Application Management heading, click Manage service applications.
3. From the Manage service applications screen, click the New button in the Ribbon.
4. From the menu, select Visio Graphics Service.
5. For Name, enter Visio Services.
6. Scroll down to Application Pool and select Use existing application pool.
7. From the drop-down menu, select Default SharePoint Service App Pool.
8. Leave the “Create a Visio Graphics Service Application Proxy and add it to the default proxy group” option checked and click OK.
Now that you have created the service application you need to start the service:
1. From Central Administration, click Application Management on the left, and then click Application Management.
2. Under the Service Applications section, click Manage services on server.
3. Find Visio Graphics Service and click Start to the right of it.
Now that the Visio Graphics Services application is created, you need to configure the unattended account:
1. Log onto your SharePoint box as the install account. In this example use contososp_install.
2. Open SharePoint Central Administration, and under the Application Management heading, click Manage service applications.
3. Click on the Visio Services service application.
4. Click Global Settings on the Manage the Visio Graphics Service page.
5. In the External Data section of the Visio Graphics Service Settings page, type Visio in the Application ID text box. Click OK.
That was pretty easy. All that’s left to do now is create a sample drawing and try it out.
Creating and Deploying a Visio Web Drawing
Time to show off some of your skills with Visio 2013. With SharePoint 2013, you need to use Visio Professional 2013 to perform the following steps. You are going to create a Visio web drawing that pulls in a little data from the AdventureWorks database. This will enable you to test the configuration for Visio Services and the unattended service account:
1. Log in to a client machine with Visio 2013 Professional installed. The account you log in with must have a SQL login with the public role at minimum.
2. From the Start menu, open Visio 2013.
3. Click Basic Diagram to create a new drawing.
4. When the pop-up appears, choose your units of measure and click Create.
5. In the Ribbon, click the DATA tab.
6. In the External Data section, click the Link Data to Shapes icon.
7. From the Data Selector, select Microsoft SQL Server database as the type of data source you want to use. Click Next.
8. For Server name:, enter your SQL server’s name. In this example use sql.
9. For Log on credentials, select Use Windows Authentication. If you wanted to use the other option, you would need to specify a SQL login, which you don’t have, not a Windows account. Click Next.
10. From the drop-down for Select the database that contains the data you want:, select AdventureWorksDW2012.
11. In the list of tables, highlight FactInternetSales by clicking on it, as shown in
Figure 8-54. Click Next.
12. On the bottom of the Save Data Connection File and Finish screen, click Authentication Settings.
13. The pop-up window that appears contains the same options that were available with Excel: Use the authenticated user’s account, Use a stored account, or None. For now, select None. Click OK and then click Finish.
After clicking Finish on the Data Connection Wizard screen, the Data Selector screen should automatically open. In the following section you will tell Visio what data to show in the diagram:
1. Ensure that the data connection you just created is listed as the data connection you want to use, and then click Next.
2. Under the Columns to include: area, click the Select Columns... button.
3. Click the Uncheck all button on the Select Columns window.
4. Locate SalesAmount near the bottom of the list and check the box next to it. Click OK.
5. Under the Rows to include: area, click the ‘Select Rows... button.
6. Click the drop-down menu for ProductKey.
7. From the lengthy drop-down menu, select 310 as shown in
Figure 8-55.
8. Click the drop-down menu next to OrderDateKey and select the value 20050701.
9. With these filters applied, you should have only one row of data now visible. If you have more than one, that’s fine; but in the event you don’t have any, adjust the filters so that at least one row of data is available. Click OK in the Filter Rows window.
10. With the filters applied, your Data Selector window should now look like
Figure 8-56. Click Next.
11. On the Configure Refresh Unique Identifier, select the option “Rows in my data do not have a unique identifier. Use the order of the rows to identify changes.” Click Next, and then click Finish on the final dialog.
Now that Visio knows what data you need, you should see a new External Data window at the bottom of the drawing. All you need to do now is add a data element to the drawing, and then save and upload your document to SharePoint.
Note that the following steps save your Visio drawing as a web drawing with an extension of .vdw. This is important, as your Visio diagram will not be viewable in SharePoint if you save it as a diagram with the extension .vsd:
1. Drag the SalesAmount in your External Data window onto the Visio main canvas. Once complete you should see a shape with the sales amount listed next to it.
2. Click the File tab at the top of your Visio document.
4. Choose the Documents library.
5. For File name, enter Sales Amount. Click Save.
Follow these steps to check it out in the browser:
2. From the left-hand navigation, click Site Contents.
3. Click the icon for Documents.
4. In the list of Documents, click Sales Amount.
5. Click All Refresh from the ugly yellow bar at the top of the screen. Note that you can go into the Visio Services service application settings and disable the refresh warning.
If all goes well, you shouldn’t see anything but a quick blink of your screen as the data refreshes. Figure 8-57 shows an example of all your hard work. Congratulations! Visio Services is now configured and tested.
Once again the BI guy had to be fancy. Check it out in Figure 8-58.
INTRODUCTION TO ACCESS 2013
Access Services 2013 is a new service application for users of SharePoint 2013 Enterprise. Unlike the previous version of the service application, Access data is now stored outside of SharePoint content databases, and instead stored inside databases specifically created for Access web applications. Due to these changes, a number of items need to be carefully considered before configuring Access Services 2013.
Prerequisites
The following are prerequisites for using Access Services 2013 with an in-house deployment of SharePoint 2013:
- SharePoint Server 2013 Enterprise
- An isolated app domain
- A configured Secure Store service application in your farm
- Microsoft SQL Server 2012
- Microsoft Access 2013 client
Although this section covers everything you need to get Access Services up and running, there are plenty of additional nuisances you may encounter over time. See the following TechNet article for further information if needed: http://technet.microsoft.com/en-us/library/jj714714.aspx.
Items to Consider for Access 2013
You really, really, really want a separate dedicated database environment for storing the Access Services databases. If a separate dedicated SQL Server 2012 environment is just not an option, the next best solution would be to set up an additional instance of SQL Server 2012 completely dedicated to those databases generated by Access 2013. Both SQL Server 2012 Standard and Enterprise Editions are supported for use.
A separate database is preferable because of the numerous configuration changes that would need to be made to SQL Server in order to use Access Services. First of all, the Contained Databases property has to be set to TRUE. Microsoft has identified a number of unique threats with this mode, most of which relate to the USER WITH PASSWORD authentication process. Microsoft provides an overview document of these threats at http://msdn.microsoft.com/en-us/library/ff929055.aspx.
The SQL Server security mode also has to be set to SQL Server and Windows Authentication mode. The DBA in your organization may not want to do this for security reasons, especially in situations where the SQL Server hosts other non-SharePoint databases.
Another reason for a dedicated resource is to control database growth and resource utilization. Access Services 2013 generates a new database for each new Access web app created in the farm. The number of databases can quickly spiral out of control, and you wouldn’t want that to affect your production environment.
Having a dedicated resource also enables you to specifically write maintenance plans geared toward the Access Services databases.
Configuring an Isolated App Domain
An isolated app domain is required because Access Services 2013 makes use of the new app model. Setting up the app model is not a trivial task. Fortunately, Chapter 11, “Managing and Configuring Apps,” has an entire section devoted to correctly configuring the app model. If you haven’t walked through those steps yet you will need to complete them before deploying Access Service 2013.
During setup, you create an App Management and Subscription Settings Service Application inside of SharePoint. Once the setup is complete, you need to ensure that the App Management Service and the Microsoft SharePoint Foundation Subscription Settings Service are both started in Central Administration’s Services on Server section. All of this is covered in Chapter 11.
Microsoft SQL Server 2012 Required Features for Access Services 2013
Several features have to be installed in SQL Server 2012 prior to configuring Access Services 2013 inside of SharePoint:
- Database Engine Services
- Full-Text and Semantic Extractions for Search
- Client Tools Connectivity
- Management Tools – Complete
If your organization already has an installation of SQL Server 2012, some of these features may be activated. Check with your database administrator to ensure that they are configured. If not, you need to set them up by running SQL Server’s built-in setup utility. All of the preceding items are available under the Feature Selection section of the SQL installer. If you don’t have the features, you can simply rerun SQL Server setup and then choose “Add features to an existing instance of SQL Server 2012.”
After configuring all your SQL features, you also need to confirm that the following ports are open on your SQL server if you are using any type of firewall:
- TCP 1433
- TCP 1434
- UDP 1434
Microsoft SQL Server 2012 Options Required for Use with Access Services 2013
As mentioned previously, integrating an existing SQL Server 2012 installation with Access Services 2013 is probably the most challenging scenario. The following two items require changes to the SQL Server operating mode. Consulting with a DBA or other stakeholders in the business is paramount before making any of these changes. Again, the ideal setup is a dedicated SQL installation or at least a dedicated instance of SQL Server.
Enabling Contained Databases
Contained databases were introduced in SQL Server 2012. When this mode is enabled, databases are isolated from each other and from the instance that contains the database. This means that the metadata that was typically stored inside the master database is now completely stored inside each independent database. Enabling this mode on a SQL instance that hosts databases for other applications, especially other non-SharePoint databases, may be problematic. Microsoft has a great article describing all the changes at http://msdn.microsoft.com/en-us/library/ff929071.aspx.
To enable contained databases:
1. Log into the SQL server as a SQL administrator. In this example, the server name is sql and the account you would use is contosoadministrator.
2. Open SQL Server Management Studio and connect to the local SQL server.
3. Right-click the server node and choose Properties, as shown in
Figure 8-59.
4. Under Select a page, click Advanced.
5. Under Containment, click False next to Enable Contained Databases and switch it to True (see
Figure 8-60). Click OK.
Note that this same page contains an option for Allow Triggers to Fire Others. This must also be set to True, which is its default setting. If this is set to False, you should ask the owner of the SQL server why it was changed. This is yet another reason why you should have a dedicated instance of SQL Server for Access Services databases.
SQL Server needs to be restarted for the change to take effect, which causes all programs that use SQL Server databases to lose connection. Therefore, be sure to save any work and stop any software using SQL prior to restarting. The next two sections also require a restart of SQL Server, so if you will be making all the changes, you could skip this for now and just do one restart later.
To restart SQL Server:
1. From the Start menu, open SQL Server Configuration Manager.
2. Select SQL Server Services.
3. Right-click on the instance of SQL Server and select Restart.
That does it. Hopefully, you ensured that no one was using SQL Server before you restarted it.
SQL Server Authentication
The SQL Server security mode also needs to be changed. For policy and security reasons, some organizations specifically only allow Windows Authentication mode. Changing this setting enables SQL Server to create and grant user accounts and permissions that fall outside of an Active Directory structure. This is one of those things that make security professionals and DBAs cringe (and, again, why a dedicated environment or a separate instance is recommended).
To change or check SQL’s authentication mode:
1. From the Start menu, open SQL Server Management Studio and connect to the SQL server.
2. Right-click the server node and choose Properties.
3. Under Select a page, click Security.
4. Under Server authentication, select SQL Server and Windows Authentication mode. Click OK.
SQL Server must be restarted for the change to take effect, which causes any programs that use SQL Server databases to lose connection. Be sure to save any work and stop any software using SQL prior to restarting.
To restart SQL Server:
1. From the Start menu, open SQL Server Configuration Manager.
2. Select SQL Server Services.
3. Right-click on the instance of SQL Server and select Restart.
That does it. Hopefully, you ensured that no one was using SQL Server before you restarted it.
SQL Server Protocols
Ensure that the TCP/IP and Named Pipes features are enabled. Named pipes are also required for an AlwaysOn availability group for SharePoint 2013. Availability groups are covered in Chapter 9, “Configuring SharePoint 2013 for High Availability Backups,” if you need more information.
To check whether these options are enabled:
1. From the Start menu, open SQL Server Configuration Manager.
2. Select SQL Server Network Configuration.
3. Double-click the Protocols item for your instance of SQL Server, as shown in
Figure 8-61. MSSQLSERVER is the default instance.
4. Under Protocol Name, ensure that TCP/IP and Named Pipes are set to Enabled, as shown in
Figure 8-62.
If a protocol is not enabled, you can enable it by right-clicking on it and selecting Enable. You will likely need to do this for Named Pipes.
SQL Server must be restarted for the change to take effect, which causes all programs that use SQL Server databases to lose connection. Be sure to save any work and stop any software using SQL prior to restarting. If you need help restarting the SQL Server service see the previous section for step-by-step instructions.
Service Account Permissions
It’s highly recommended that you create a dedicated service account inside Active Directory specifically for use with Access Services. This account will be used to create all Access databases inside SQL, and as the service account running the application pool for the service application. You should grant this account db_owner, public, and securityadmin roles inside of SQL.
The AD account just needs to be a regular domain user. If you are following the examples in the book, you would use the naming convention of contososp_accsvc.
To grant the service account permissions in SQL:
1. Log into the SQL server as a SQL administrator. In this example the server name is sql and the account you would use is contosoadministrator.
2. Open SQL Server Management Studio and connect to the local SQL server.
3. Expand the Security node, and then expand the Logins node.
4. Right-click Logins and select New Login, as shown in
Figure 8-63.
5. For Login name:, enter your Access Services account. In this example that is contososp_accsvc.
6. Under Select a page, click Server Roles.
7. Check dbcreator and securityadmin.
8. Confirm that public is still selected, verify your work against
Figure 8-64, and click OK.
Remember this account. You will need it in the next section.
At this point, you can close up anything you still have running on the SQL server and log out.
Creating the Access Services 2013 Service Application
Now you are headed back to SharePoint Central Administration for a common set of tasks. You need to make your new Access Services AD account a managed account and then create a new service application. It isn’t difficult, just don’t skip any steps.
To register a managed account:
1. On the SharePoint server, open Central Administration and click Security ⇒ Configure managed accounts.
2. Click Register Managed Account.
3. For User name, enter your Access Services AD account. In this example that is contososp_accsvc.
4. Enter the account’s password. In this example use pass@word1. Click OK.
To create the service application:
1. From the left-hand navigation, click Application Management.
2. Under Service Applications, click Manage service applications.
3. From the Ribbon, click New.
4. From the drop-down, select Access Services.
NOTE For this example you are working with Access Services, also known as Access Services 2013. For an overview of Access Services 2010 and the differences between the two, please see Chapter 3, “Installing and Configuring SharePoint 2013.”
5. For Name, enter Access Services 2013.
6. For Application Database Server, choose the SQL server you made all the wild changes to in the previous section.
7. Leave the check box enabled for “Validate the application database server (recommended).” This way, when you click OK it will confirm that all those SQL changes were made.
8. For Application Pool, use Create new application pool.
9. For Application pool name, enter Access Services 2013 App Pool.
10. From the drop-down below Configurable, select your Access Services AD account. In this example it is contososp_accsvc. You can double-check yourself using
Figure 8-65.
11. Click OK to create the service application.
To start the service:
1. Switch to your IE tab for Services on Server.
2. Find Access Services and click Start to the right of it.
That will do it. If you did have any errors during validation of your SQL server, you will need to fix those before trying again. Fortunately, SQL Server is checked before creating any other pieces. Therefore, when you return to create the service application again, the steps are identical; either your service app or app pool were not created.
Setting SQL Permissions for Your Service Account
Now that you have configured your service application to use a dedicated account, you need to ensure that account has all the necessary SQL permissions to get things working. To do this, you need to give that account the SPDataAccess database role on the Access Services database, and to all the content databases for web applications for which you want to use Access Services.
To grant the necessary SQL permissions:
1. Log into the SQL server as a SQL administrator. In this example the server name is sql and the account you would use is contosoadministrator.
2. Open SQL Server Management Studio and connect to the local SQL server.
3. Expand the Security node, and then expand the Logins node.
4. Find your account in the list and double-click it. In this example that is contososp_accsvc.
5. Under Select a page, click User Mapping.
6. In the list of databases, click App_Management_DB. If you configured your Access Services service app to host the database on another SQL instance, then this database will not be listed. In that case you will need to log into that SQL instance and do this step and the next step there.
7. In the Database role membership for: APP_Management_DB section, check SPDataAccess as shown in
Figure 8-66.
8. In the list of databases, click on your web application content database. In this example it is WSS_Content_Portal.
9. In the Database role membership for: WSS_Content_Portal section, check SPDataAccess.
10. At the bottom of the window click OK.
Now your service account has permissions to the necessary databases. Remember that if you add more SharePoint content databases later or want to use Access Services with other web applications, you need to repeat these steps.
Configuring IIS
Because Access Services is an equal opportunity offender, you have to make one change to IIS. Please avoid rolling your eyes while you make this necessary change.
To update IIS:
1. Log into the SharePoint server as a local administrator. In this example the server is named server and the account to use is contososp_install.
2. From the Start menu, open Internet Information Services (IIS) Manager, and expand the Server node.
3. Under Server, click Application Pools.
4. Now you need to find your application pool. The trick here is to skip the name, which is a bunch of letters and numbers (different for everyone), and locate the application pool in the Identity column, which is your Access Services account. In this example that would be contososp_accsvc. Click on the application pool, as shown in
Figure 8-67.
5. With the application pool highlighted, click Advanced Settings... in the right-hand menu.
6. Under Process Model, change Load User Profile from False to True. Click OK.
7. Close IIS Manager.
Hooray! You have now completed all the wacky prerequisites to get Access Services working. In the next section you can try out this new toy of yours.
CREATING A CUSTOM WEB APP USING ACCESS 2013 CLIENT
Finally, after all that hard work you are ready to create an Access web app. To get started, you need to have a machine running the Access 2013 client that is part of the normal Office suite.
To create an Access web app:
1. Log into a machine that has the Office 2013 clients installed with an account that has permissions to create lists in the SharePoint web you want to use.
2. From the Start menu, launch Access 2013.
3. When Access opens, click Custom web app. The Custom web app window will appear.
4. For App Name, enter Customer Tracking.
6. Click the Create button.
Now that the app is created, you need to build something:
1. Still in Access 2013, you should now be on the screen for Add Tables. In the search box, type
People and press Enter (see
Figure 8-68).
2. From the list of options that appears, click Customers. This will create a Customers table with some default fields in the app.
3. On the left, click Customers (with the little star beside the name).
4. This brings up the table and list that were created. Click Edit in the center of the screen to make some quick changes. A new Customer List tab opens. Here you will see a lot of different options and actions for customizing your app. You are welcome to put your Access skills to use at this point and customize away.
To take a look at your work in the browser:
2. From the left-hand menu, click Site Contents.
3. Click the pretty, red Custom Tracking icon to open it.
There is your app in all its glory. An example is shown in Figure 8-69. You can now add customers and start to play with the data. On the far right you will see a second gear icon. You can click that gear icon to open your app again in Access 2013 if you wanted to edit it.
You might also notice that your URL is something crazy now. That’s because you are running a true app, so it is being hosted by the app management service you set up in Chapter 3. It’s pretty cool to see all these pieces working together.
The one sad part of this success is that if you go look at your SQL server now, you will see that it created a database for your app with a hideous name. Just another reminder why hosting these databases in their own SQL instance is a good idea.
Looking for the usual BI ninja example? It turns out he doesn’t have anything awesome to demo here. Maybe he needs to brush up on his Access Services skills.
SUMMARY
Are you exhausted? If you worked through all the examples and demos in this chapter you deserve a gold star. The road was tough but hopefully worth the journey. You have seen that a lot of the service applications do very similar things but with a different feel or specialization; and to get the most benefit you sometimes need to install one in order to use another. For example, PowerPivot is exciting but it doesn’t work until Excel Services is deployed. Keep these close associations in mind as you plan your deployment.
The order the service applications in this chapter appear is done for a reason. Hopefully, its emphasis on the data specialist and the administrator working together in harmony has been effective in that not only do you feel empowered to deploy the given functionality but you have a better feel for how it is used.