
Chapter 20
Monitoring and Analytics
WHAT’S IN THIS CHAPTER?
- Using the Unified Logging System
- Configuring the Usage and Health Data Collection service
- Monitoring the Search service application
As with any complex system, monitoring and maintenance are necessary to keep SharePoint running happily. SharePoint’s monitoring functions are comprised of four components: the Unified Logging Service (ULS), the Health Analyzer engine, the Usage and Health Analysis reporting system, and Timer Job monitoring. The ULS system provides active (and potentially extremely detailed) logging data of the various requests being processed, the Health Analyzer engine runs periodic checks of the environment against an established baseline, the Usage and Health Analysis reporting system collects data about usage patterns of various SharePoint resources, and Timer Job monitoring reports on the run history and success or failure of SharePoint Timer Jobs.
From an IT management perspective, these components can be roughly categorized as reactive (ULS, Timer Job monitoring), proactive (Health Analyzer), and predictive (Usage and Health Analysis). Proper monitoring of a SharePoint farm involves using all four forms of monitoring in concert.
CONFIGURING MONITORING IN CENTRAL ADMINISTRATION
Most of the monitoring configurations for SharePoint can be done via Central Admin under the aptly named Monitoring section, but some additional health and usage reports are provided as part of the Search Service Application (more on that later), and some settings are cleverly hidden only in PowerShell. Under the Monitoring section in Central Admin, the locations of the Health Analyzer and Timer Job sections are obvious; but for unknown reasons, the ULS configuration and Usage and Health Analysis settings are lumped together under the general Reporting heading. It’s like a Monitoring scavenger hunt that’s gone horribly awry.
Unified Logging Service
The lowest-level monitoring system is called the Unified Logging Service. This service records information about each operation that occurs inside of SharePoint, and it provides the most direct and detailed view into SharePoint’s operation. It gives insight into the processing of specific events and requests, regardless of whether or not an error was observed. The level of detail provided in the ULS logs, while of great value, can be both a blessing and a curse, as it can generate a large quantity of data to evaluate. However, with the right configuration and the right tools, you can strike a balance that provides the information you need without inundating you with mountains of irrelevant data.
If you are familiar with the ULS system introduced in SharePoint 2010, you will find that it is mostly unchanged in SharePoint 2013. The ULS engine can log events into both the Windows Event Log system and SharePoint’s own trace logs, with independent control available for the reporting level of each, but these are not simply two different channels for reporting the same data. The types of events typically sent to the Windows Event Log are critical errors (e.g., failure to connect to a database, service account errors) or general informational events (e.g., farm topology changes, search index replication status), whereas the entries made in the trace logs go much deeper, tracking the actions (and sometimes errors) of individual requests as they are processed.
Configuring ULS via Central Admin
Initially, the ULS appears to be very straightforward to configure, but you will quickly see that it is not quite so simple. First, you will look at the ULS configuration options inside of Central Admin. Here are the steps:
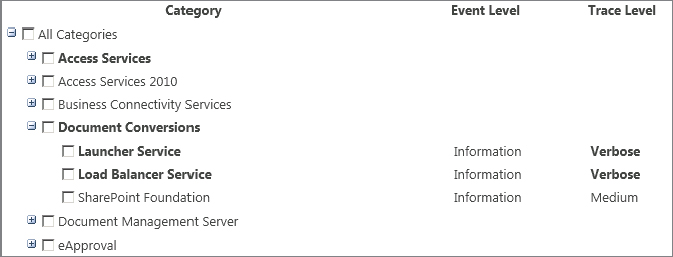
As you expand the items in the tree, you will find that the ULS provides a nearly overwhelming amount of granularity for controlling the logging of various elements of SharePoint. Unfortunately, there is no built-in explanation of what exactly is included in any given category, and little or no documentation elsewhere on the topic. Some are fairly obvious (e.g., SharePoint Foundation ⇒ Alerts), while others wouldn’t necessarily mean anything to a systems administrator and might very well be made up (e.g., SharePoint Server ⇒ Command Base Validators).
Beneath the list of categories is a pair of drop-down menus used to select the least critical event to be reported to either the Event Log or the Trace Log. Note that the boxes do not use exactly the same severity settings, but rather each uses the severity nomenclature for its target log. Both boxes list the logging options in order of decreasing severity; therefore, the further down the list you go, the more verbose the ULS will be in its reporting. The most verbose options can be quite verbose. Before asking the ULS to give you more logging, be careful what you wish for, you just might get it. It’s a good idea to move down the list slowly, or select a few categories at a time. It is possible to crank the logging up so high that the overhead affects performance.
The check boxes in the category list allow you to set a specific severity level for multiple categories or subcategories simultaneously, but you cannot set multiple different severity levels simultaneously; every item checked is set to the values selected in the drop-down boxes. To set more than one severity value for various categories, you need to make your selections, click OK, and then return to Configure Diagnostic Logging for each severity level that you wish to set.
SharePoint 2010 introduced a great improvement over MOSS 2007 with the capability to easily set logging categories back to their default severity level, and that capability has been carried over to SharePoint 2013. (In SharePoint 2007 the only want to reset a category’s logging level was with STSADM, and there was no easy way to determine which categories were not at their default levels.) In SharePoint 2010 and SharePoint 2013, if any category’s logging severity level has been changed from the default, then the new value is displayed in bold text, making it obvious what has changed. Before SharePoint 2010, you could only see the currently set values; there was no indication whether that setting was the default.
The next option to look at on the page is the Event Log Flood Protection setting. The goal, of course, is to keep the farm running in an error-free state, but when SharePoint starts reporting errors, it becomes very chatty indeed. This isn’t really a problem for SharePoint’s trace logs, as we expect all errors to be reported there. Where it becomes problematic, however, is in the server’s event logs. These logs are used for the server’s own reporting and for other applications, so it would be rude for SharePoint to commandeer the logs and flood them with hundreds or thousands of identical error messages. In fact, such a log flood could actually make it more difficult to notice system-level error messages that might be the root cause of an issue. The Event Log Flood Protection option is enabled by default, which causes SharePoint to watch for repetitive error messages; when detected, it switches to creating occasional messages summarizing how many times the error has occurred and when it was last seen.
If you’re using any third-party monitoring tools that comb through your application logs looking for events, make sure they are capable of handling flood prevention. Otherwise, they may not recognize a problem if one exists.
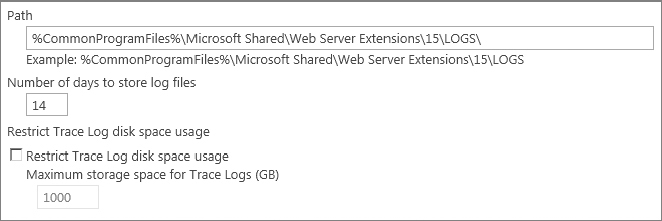
Moving right along, we come to the Trace Log configuration options. These options are, for the most part, self-explanatory, but that is not to say that some thought shouldn’t be put into them. The first option is the path for storing the logs. By default it is set to %CommonProgramFiles%Microsoft SharedWeb Server Extensions15LOGS, which is typically the C: drive of the SharePoint server(s). It is recommended that you change this path to a drive other than the system drive to avoid the possibility of the log files growing to the point of exhausting the system drive’s free space. Windows gets very upset if the boot drive runs out of space — and if Windows ain’t happy, nobody’s happy.
However, two points must be considered when relocating the trace logs. First, the path specified must exist on all servers that are members of the farm. This is easy enough to ensure when the farm is set up, but you must also consider whether any additional servers may be added to the farm, as they too must have the same path available. When you move your logs, don’t try to be overly clever with the new path. If they’re in the same path as the 15 hive but on a different drive, they’re very easy for other administrators to find. Conversely, if they’re buried under E:LogsSharePoint LogsULS Logs they’re tougher to find without looking for their location in Central Admin or PowerShell. E:Program FilesCommon FilesMicrosoft SharedWeb Server Extensions15Logs might be a mouthful, but it’s a very obvious place to look if there are no ULS logs on the C drive. Second, the writing of the trace logs can potentially be a very disk I/O-intensive operation, so it is important to ensure that you don’t slow down SharePoint by putting the logs on excessively slow storage, and that you don’t inadvertently slow down other applications that might be running off the same drive you select for your trace logs.
Following the trace log path setting are two options controlling retention for the logs, according to both age and total space consumed. By default, the logs are retained for 14 days and the option to restrict log disk space usage is disabled. However, note that the box for specifying maximum storage size uses GB as its unit of measure; therefore, if you enable the size restriction without changing the size value, you have effectively just configured a “restriction” of 1TB! When processing log retention, SharePoint uses the more restrictive of the two configurations to determine which files to keep and which to delete. For instance, if you set a retention age of 10 days and a maximum storage space of 5GB, SharePoint will delete logs older than 10 days even if the 5GB limit hasn’t been reached; conversely, it will delete the oldest logs if the 5GB limit is exceeded, even if those logs are younger than 10 days old. Figure 20-2 shows the Restriction Settings page.
Configuring ULS via PowerShell
The options for ULS configuration provided by Central Admin are great, but a few additional options are not available in the browser, and configuring each filtering category manually can be frustrating. Fortunately, PowerShell comes to the rescue! All of the options available via Central Admin (and then some) are exposed in PowerShell cmdlets, opening up the possibility of scripting, remote management through PowerShell, and more.
The PowerShell cmdlets for managing ULS are divided into two groups of commands. The first group of cmdlets is for managing the ULS event filtering categories and is fairly straightforward. Get-SPLogLevel will display the current severity filters for the various logging categories, but be prepared for this command to return several screens of data. You can filter the results down to only what you are looking for by using the command’s Identity parameter, passing it a string in the "Area:Name" format. For instance, if you wanted to see only the setting for the Administration subcategory of area Access Services, the command would be as follows:
Get-SPLogLevel -Identity "Access Services:Administration"Figure 20-3 shows the output of that command. You can also use an asterisk to specify all the subcategories of a given area, such as the following:
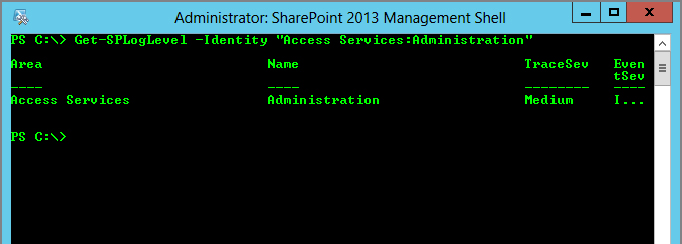
"Access Services:*"Notice that, unlike the corresponding Central Admin page, the output from this cmdlet doesn’t indicate whether any values have been changed from their defaults, so you still have to rely on the Central Admin page for that information. You can set a new logging level for one or more categories with Set-SPLogLevel and reset a category to the default level with Clear-SPLogLevel. Both of these cmdlets accept the same type of Identity filtering shown earlier for Get-SPLogLevel.
The second group of commands enables additional control of the Event Log flood protection, and of the trace log path and retention options. The cmdlet Get-SPDiagnosticConfig will return the currently configured values. You may recognize a few of the values (such as LogLocation or LogDiskSpaceUsageGB) from the Central Admin configuration, but additional options are exposed as well. For instance, LogCutInterval specifies the number of minutes that ULS will use a log file before starting a new one, and there are additional threshold and interval values to tune the Event Log flood protection.
Now that you know what options are available, you can set them with the Set-SPDiagnosticConfig cmdlet. For instance, Set-SPDiagnosticConfig -LogCutInterval 15 would cause ULS to move to a new log file every 15 minutes, and Set-SPDiagnosticConfig -EventLogFloodProtectionTriggerPeriod 3 would cause ULS to look for five of the same events within a three-minute window, rather than the default two-minute window.
Two additional cmdlets can be very useful for troubleshooting. New-SPLogFile manually triggers the creation of a new log file, which can be useful when you want to re-create an issue but not have to sort through hundreds of previous log entries. This is very helpful if you want to isolate the events from a specific operation into a known ULS log file. This might be for your own use or if you’ve been asked to send the ULS log to someone who is helping you troubleshoot a problem. You can run New-SPLogFile right before reproducing the issue. After you’ve reproduced it, and it has spewed some events in the ULS log, wait a couple of minutes for everything to flush out, then run New-SPLogFile again.
Because SharePoint 2013 servers work as a team, you never know for sure if the key to solving the issue you’re fighting lies in a log file on another server in your farm. Merge-SPLogFile is used to merge all the ULS logs from all the machines in your farm into one large, trouble-finding file. With no parameters, it will schedule a timer job on each member of the farm to take its last hours’ worth of logs and copy them to a single file on the machine where you ran Merge-SPLogFile. Because it’s timer job-based, you have to be patient; it takes a couple of minutes to be completely populated. Once it is full you can open it and follow all the events in the farm on all the servers. In most cases, an hour is way too many events. You really only need the last five or ten minutes’ worth. Fortunately, you have several ways to prune the results of Merge-SPLogFile. You can filter by user, category, level, or time. One of the handiest ways is to get the last 10 minutes’ worth of events. To do that you would use the following command:
Merge-SPLogFile –Path E:LogsBigFile.txt –StartTime (Get-Date).AddMinutes(-10)You will discover other Merge-SPLogFile tricks in Chapter 7, “Administering SharePoint with Windows PowerShell.”
USING AND CONFIGURING THE HEALTH ANALYZER
The ULS logs can help you figure out what happened after an issue has already occurred, but the Health Analyzer is a trustworthy (albeit sometimes overzealous) sidekick that wants to keep you out of trouble in the first place. Whether you realize it or not, you’ve probably already seen the Health Analyzer at work if you’ve ever opened Central Admin and seen a yellow or red bar warning that serious or critical issues have been detected and require attention. Central Admin just doesn’t seem right without those bars at the top. Figure 20-4 shows your old friend. However, Health Analyzer is capable of doing much more than just reporting on issues; in some cases it can even fix them for you!
If you are familiar with Health Analyzer in SharePoint 2010, then you will notice that it remains basically unchanged for 2013. The Health Analyzer’s role is to run a whole series of predefined checks against various portions of the farm, looking for potential problems before they become serious enough to affect it. These checks can run the gamut from service account permissions checks to available server disk space to database index fragmentation. SharePoint 2013 increases the number of out-of-the-box rules to 68 (from SharePoint 2010’s 52), and spending a few moments looking through the list of checks and how they are done is certainly a worthwhile use of time, as it will familiarize you with what Health Analyzer does and does not check, and how often those checks are run. To view the list of configured Health Analyzer rules, go to the Monitoring section of Central Admin, and under the Health Analyzer section, you will see Review Rule Definitions.
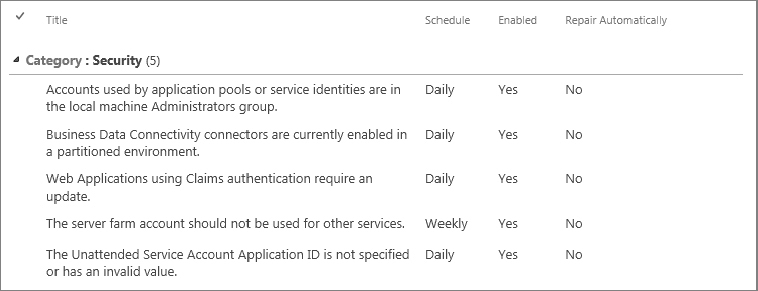
The rules are divided into sections based on the type of check that is done, and include a short description of the rule, its run schedule, enabled/disabled status, and whether or not it is permitted to attempt an automatic repair of the issue. Figure 20-5 shows some of the rule definitions under the Security heading. While technically this is just another SharePoint list to which you can add new items, simply typing up a description of a new rule and adding to this list doesn’t make a functional rule. This list is really just a configuration front end for a series of timer jobs that actually execute the check. Without the corresponding timer job, these list items have no effect whatsoever. To get a feel for the issues the Health Analyzer is watching for, you can page through the list of job definitions.
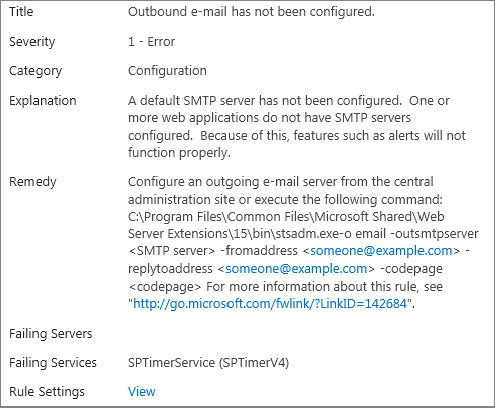
To view the current list of triggered warnings, from Central Admin select Monitoring ⇒ Health Analyzer ⇒ Review Problems and Solutions. Alternately, just click the ever-present red or yellow bar at the top of Central Admin. If some of the rules have triggered warnings, you can also reach this page by clicking a link provided on the yellow or red Health Analyzer warning bar. Here you will see a list of the outstanding problems, along with the last time that the check was run and found to still be failing. Clicking the item description for a rule brings up more details about the failure, and in many cases the Explanation field will indicate precisely what caused the check to fail. Figure 20-6 shows the description for the rule that checks for an outbound SMTP server.
Some of the Health Analyzer rules have unrealistically high standards, which do not necessarily apply to all scenarios. For instance, one of the rules triggers a warning if a SharePoint server’s free disk space drops below an amount equal to five times the server’s total RAM. This is a well-intentioned rule, but it doesn’t take into account high-powered SharePoint Web Front End servers, which could easily be equipped with 32GB of RAM or more. Thus, it is necessary to take Health Analyzer’s warnings with a grain of salt, and evaluate any warning against the usage scenario of the farm. If you determine that the rule does not apply to your farm, you can disable that rule from the Review Rule Definitions page. You should look at the Health Analyzer the same way you look at the GPS in your car. It’s just one of the things you take into consideration when making decisions. Your GPS can be helpful, but it can also tell you to turn right when there is no road to turn right onto. Just as you don’t blindly follow your GPS off a cliff, you shouldn’t blindly follow the Health Analyzer when it tells you to shrink your databases.
Some failures can be fixed automatically by Health Analyzer; and in fact, some are configured to do so by default. For instance, if it is detected that databases being used by SharePoint have excessively fragmented indexes, then Health Analyzer will launch a re-indexing stored procedure inside the database. Other alerts, such as, “Outbound e-mail has not been configured,” can’t be automatically fixed by Health Analyzer, as the “fix” requires information that it does not have — namely, the mail server host name and the sender and reply-to addresses. In addition, some alerts, such as, “Drive is out of space,” shouldn’t be fixed automatically by SharePoint, unless it will call your storage vendor and order more drives. Moreover, you don’t want it to free up space by deleting all the Justin Bieber MP3s that you have hidden on your SharePoint server.
Unlike the ULS, control over the Health Analyzer with PowerShell is quite limited; there is a grand total of three cmdlets related to Health Analyzer, and they don’t really do a whole lot. You can use the cmdlet Get-SPHealthAnalysisRule to retrieve the full list of Health Analyzer rules, or you can provide the optional -Identity parameter to retrieve a single rule by its name or GUID. However, the only information returned is the rule’s system name, GUID, enabled/disabled status, category, and summary. Notably absent are the options for Scope, Server, and Repair Automatically. In addition, while it may appear that you can set the Enabled property of a Health Analyzer Rule, you cannot. You can try setting it to either $true or $false, but even if you call the Update() method, the new setting won’t stick. To change the Enabled state of a Health Analyzer Rule, you have to use one of the other two cmdlets: Enable-SPHealthAnalysisRule and Disable-SPHealthAnalysisRule, which are self-explanatory.
Earlier you learned about the Health Analyzer Rule that triggers an alert if the free space on any of your SharePoint server drives drops below five times the amount of RAM in the system. You also learned that in systems with a lot of RAM, that alert is not practical. You can use Get-SPHealthAnalysisRule to view a list of all rules and their names. Then you can use Disable-SPHealthAnalysisRule to disable that rule and get that monkey off your back:
Get-SPHealthAnalysisRule AppServerDrivesAreNearlyFullWarning | Disable
-SPHealthAnalysisRule
PowerShell will ask you to confirm that you really want to disable this rule. You do. Now that unhelpful alert will no longer sully your Central Admin pages.
USAGE AND HEALTH DATA COLLECTION
By now it should be fairly obvious that SharePoint is capable of collecting a very large amount of information about how it is running. However, we’re about to tumble down the rabbit hole and see just how broad its data collection capabilities truly are. The Usage and Health Data Collection system not only provides basic SharePoint information such as web app statistics, feature use, and page requests within the scope of its reporting umbrella, but also extends its reach to InfoPath, the State Service, the Windows Event Log, and even SQL Server performance.
Collecting large quantities of data can potentially have a very significant performance impact on the farm, but fortunately you can enable, disable, and schedule each data category individually. This enables the collection to be distributed across low-usage times and restricted to only the data you want, minimizing the impact to the farm.
It’s great to have a lot of data; but if it were stored in log files only, then trying to extract any kind of useful information from the data set would be unwieldy and frustrating at best. Thankfully, the Usage and Health Data Collection system is capable of aggregating all the collected information into a SQL Server database. Microsoft has explicitly stated that SharePoint databases should never be directly queried or edited. As the saying goes, however, there’s an exception to every rule, and this database is the exception to that rule. It exists solely to allow administrators to query performance and usage data about the farm in order to generate their own reports. How do you configure this amazing database? What is the name of this rule-breaking, renegade database? You’ll plumb all these mysteries and plenty more in this section.
Configuring Usage and Health Data Collection
Like many parts of SharePoint, the Usage and Health Data Collection settings can be modified both in the Central Admin UI and with PowerShell. Each place has things it does better than the other. The following sections cover the options you have with both approaches.
Configuration in Central Admin
Configuration of the Usage and Health data collection process is handled, conveniently enough, on the Configure Usage and Health Data Collection page under the Monitoring section of Central Admin. The first option available is “Enable usage data collection.” Despite its name, this is actually only the first step in enabling usage data collection. It is not fully functional until a timer job that handles the collection is changed from its default state of Disabled, but that is discussed shortly. Figure 20-7 shows some of the events you can log.
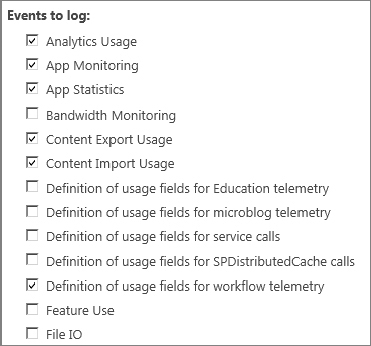
Immediately following the Enable/Disable option is a large block of check boxes for selecting which events should be logged as part of the usage data collection. Again, some of these options can result in a large performance impact on the farm, so only enable the options you truly need. For instance, if your environment seems slow, the SQL IO Usage and SQL Latency Usage options could provide valuable information. If you need to see which features are being used at what times, you can enable the Feature Use option.
Next is a field titled Log File Location, which you might notice is the same location as the default path set for the ULS logs. This is the location where SharePoint stores the collected usage data; and, as with the ULS logs, the specified location must match on all SharePoint servers in the farm. Also like the ULS log, it’s a good idea to move this to a drive other than your Windows system drive. You don’t want Windows and SharePoint fighting for IOPS on that drive. Even worse, you don’t want SharePoint filling it up. SharePoint 2013 differs from SharePoint 2010 in that there was previously a field where you could specify, in GB, the maximum space to be utilized by the logs. However, you can still use PowerShell to modify the value from its default of 5GB.
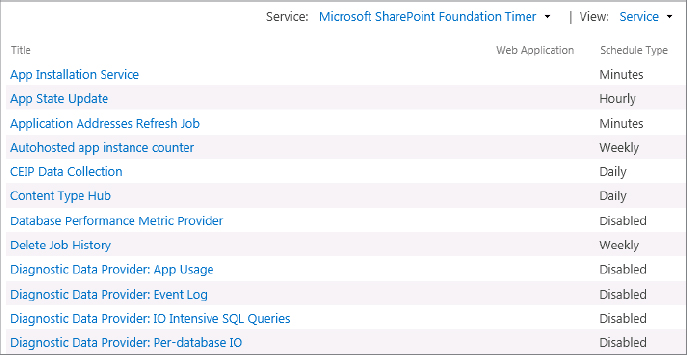
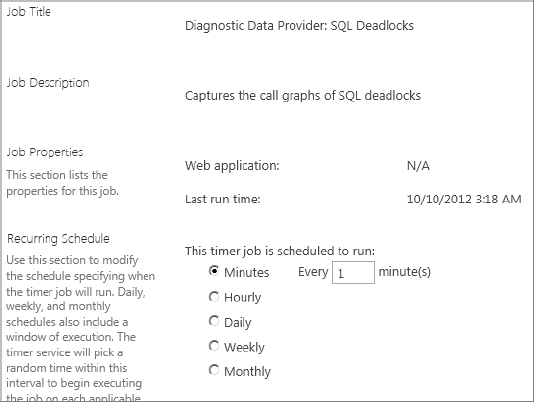
The second function of this service is health data collection. Unlike the usage collection, which gathers information about how various functions are being used, the health data collection periodically captures information about lower-level resources such as blocking reports or deadlocks in SQL Server, timer service-recycling, password management, and much more. You can configure the data collection schedule for each of the gathering categories by clicking Health Logging Schedule. Note that the health logging collection processes are really nothing more than SharePoint timer jobs; and like any other timer job, you can enable, disable, or set a custom schedule for these. Figure 20-8 shows some of the timer jobs that can be changed.
Configuration with PowerShell
As with ULS, some elements of Usage and Health data collection can also be configured via PowerShell, and in fact a few are only accessible through PowerShell. The cmdlet Get-SPUsageService will return information roughly equivalent to the Usage Data Collection and Health Data Collection sections in Central Admin. Of note in the output are two values that are absent from the Central Admin page: UsageLogMaxSpaceGB and UsageLogCutTime. Recall that UsageLogMaxSpaceGB is the value that was accessible through Central Admin in SharePoint 2010 but is hidden in SharePoint 2013, although the default value is still unchanged, at 5GB. UsageLogCutTime specifies how long SharePoint will use the current usage log file before it rotates to a new file. Its default value of five minutes coincides with the log collection import time cycle (covered later), but you can change that. In fact, if the log collection import cycle is increased to an hour or longer, changing UsageLogCutTime to match might result in log files large enough to slow SharePoint down.
You can set UsageLogMaxSpaceGB and UsageLogCutTime, as well as LoggingEnabled and UsageLogLocation, by passing them to the Set-SPUsageService cmdlet.
Log Collection and Processing
The settings thus far have all been related to how each individual SharePoint server handles the collection of its own log data. However, one of the greatest benefits of the Usage and Health data collection service is that it can aggregate the logging information of all the servers in a farm into a single SQL database, and generate reports based on that data. Once again, you can pick your weapon of choice, either Central Admin or PowerShell to change these settings.
Configuration with Central Admin
The final group of options on the “Configure usage and health data collection” page is for the log collection schedule and the logging database configuration.
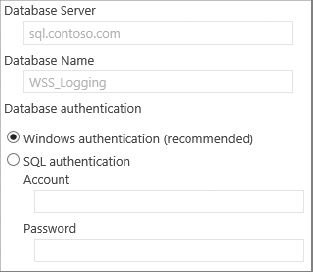
This section looks at the Logging Database Server options first, as they must be properly configured for the log collection to work. Depending on whether or not this service was set up previously, you may find that the Database Server and Database Name fields are disabled, preventing you from editing them. If so, then it is because either the “Enable usage data collection” or the “Enable health data collection” boxes (or both) are checked. When either of these functions is enabled, the service assumes it can use the configured values for the logging database, thus it prevents you from changing them. If you wish to change either the database server or the logging database name, you need to disable both usage and health data collection, change the values, and then enable the collection again. SharePoint will then begin using the newly configured values for all log collection.
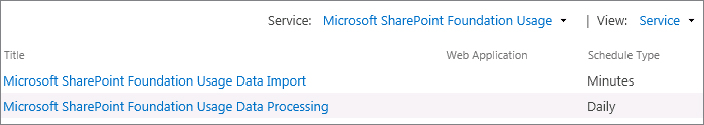
Returning to the Log Collection Schedule section, click the Log Collection Schedule link to access the Timer Job Configuration page, which is filtered down to just two timer jobs: the Microsoft SharePoint Foundation Usage job for Data Import, and for Data Processing. Figure 20-10 shows the two timer jobs as they appear in Central Admin. The Data Import timer job is responsible for collecting the log data stored on each server and merging it into the logging database. In order to prevent massive import jobs that can degrade server performance, the Data Import job is configured to run at a five-minute interval, which prevents the quantity of not yet imported data from getting too large.
The Data Processing timer job’s role is to process the data that has been imported to the logging database throughout the day and generate meaningful reports from it. By default, the timer job is configured to run between 1:00 AM and 3:00 AM, but it also defaults to a disabled state. Therefore, unless you manually enable the timer job, the log data will only be collected in the database; no reports will be generated from it.
Configuration with PowerShell
The enabled/disabled status of logging and the name of the logging database can be retrieved with the cmdlet Get-SPUsageApplication, but in most cases the rest of the information returned is of little use. You can change the logging database server, database name, database login user name, and (if necessary) the database login password with the Set-SPUsageApplication cmdlet. One advantage to changing this information with PowerShell, rather than in Central Admin, is that the change can be made without having to disable the usage and health data collection first! Plus changing it in PowerShell is just cooler than in Central Admin, so you get that added feeling of superiority over people that don’t do it in PowerShell.
TIMER JOBS IN SHAREPOINT 2013
The SharePoint Timer Service is the conductor for all of SharePoint’s automated systems, responsible for everything from workflows to server configuration synchronization to e-mail notifications, making it one of the most critical components that sets SharePoint apart from a basic data-driven website. As a matter of fact, the Timer Service is responsible for executing the Health Analyzer rule-checks and for initiating the creation of the Usage and Health Analysis reports discussed previously.
The various responsibilities of the Timer Service are defined as timer jobs, which are typically a set of instructions to carry out, and these timer jobs are deployed to the farm as solutions, not created in Central Admin. Timer jobs can be scoped at the farm level, or they can be scoped specifically to a web application or SharePoint service. Due to this scoping, it is quite possible to see multiple copies of the same timer job configured in the same farm, but with associations to different web applications or services.
Despite the fact that the Timer Service itself is responsible for running most of the other monitoring processes, the timer jobs themselves must be monitored in case one or more of them begins to fail to complete its set of instructions. Depending on the environment, the failure of some timer jobs, such as Outgoing E-mail Alerts, may not pose an immediate problem; but if a timer job responsible for pushing farm configuration changes out to the SharePoint servers begins to fail, the results could be catastrophic for the farm if the issue isn’t dealt with immediately.
Managing Timer Jobs in Central Admin
You can find the timer job definitions in Central Admin by selecting Monitoring ⇒ Timer Job Definitions. On your first visit, you will be shown all the configured timer jobs, and there are pages and pages of them. You can use the top-right View menu of the dialog to filter the contents to a specific web application or SharePoint service if you wish. Once you’ve found the timer job you’re looking for, clicking it brings up the configuration and details screen for that timer job. Figure 20-11 shows the options that can be changed on a timer job.
The “Last run time” information is quite valuable, as it tells you whether the job is actually being executed according to its schedule. You can use the schedule options to change the execution schedule for timer jobs, but make sure that you are aware of both the impact that changing the schedule may have on the farm’s resources and any requirements that SharePoint or other systems may have in terms of when or how often the jobs run.
The Run Now and Disable buttons were important changes related to timer jobs introduced with SharePoint 2010. Prior to SharePoint 2010, both manually executing and disabling a timer job required writing code that would make calls against the SharePoint API. Now that these functions are available directly, you can disable a timer job before a potentially destructive change, or you can manually run a timer job immediately after deploying new code, or any number of other scenarios.
Aside from the timer job definitions and the timer job details, you will find four additional Timer Links:
- Timer Job Status
- Scheduled Jobs
- Running Jobs
- Job History
As per their names, the last three pages show lists of upcoming jobs to be run, currently running jobs, and recently completed jobs, respectively. The View menu can be used to filter these lists not only by service and web application, but also by the server on which the job is to be executed, or by the job definition. Take a quick hop back to the first link, Timer Job Status. Figure 20-12 is a single-page summary of the three status pages you just looked at.
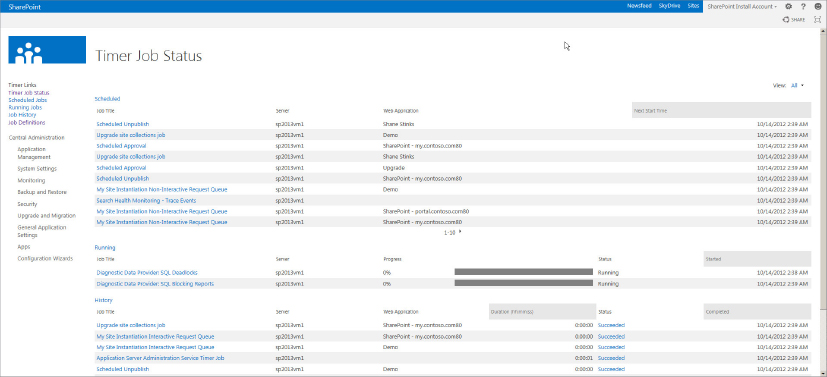
One easy-to-miss detail on both the Job History and Timer Job Status pages is that the job status is a clickable link. Clicking this link not only takes you to a job history list filtered by the status value you clicked (success, failure, etc.), but also provides details about the error encountered if the job failed. This is a great way to start troubleshooting a failed timer job.
Managing Timer Jobs in PowerShell
Several very useful, if not particularly deep, cmdlets are available for working with timer jobs in PowerShell. The basic cmdlet to retrieve timer job entries is Get-SPTimerJob. This will return all timer jobs configured in the farm, so it is wise to do a bit of filtering to only retrieve the job or jobs with which you wish to work. This alone exposes a great deal of information about the timer job(s).
After retrieving the timer job, you can then disable it with Disable-SPTimerJob, enable it with Enable-SPTimerJob, manually launch it with Start-SPTimerJob, or change its schedule with Set-SPTimerJob.
One handy way to use these cmdlets is to manipulate the Health Analyzer Rules, which run at different intervals — some hourly, some daily, some weekly, and some monthly. Some might even run completely randomly, but there’s no proof of that. Because of these intervals, Health Analyzer Rule warnings show up at various times after SharePoint 2013 has been installed. You can use PowerShell to sift through all the timer jobs, pick out the ones that execute the Health Analyzer Rules, and run them all at once. It looks like the following:
Get-SPTimerJob | Where-Object { $_.name -like "*health-analysis*" } | Start
-SPTimerJob
The preceding example gets all the timer jobs in the farm, filters out the ones with “health-analysis” in their name, and then starts each of them. Don’t worry if you don’t understand the exact syntax of that PowerShell command. You can become a virtual PowerShell expert by reading Chapter 7.
If you go back to the Timer Job Status page, you’ll see a whole slew of new running timer jobs in the list, and with any luck in a few minutes you’ll have the familiar red or yellow bar welcoming you at the top of your SharePoint Central Admin page.
SEARCH SERVICE APPLICATION MONITORING
SharePoint 2013 has introduced some truly impressive new capabilities for monitoring the Search service application. The extent of SharePoint 2010’s Search monitoring was a crawl log to report crawl failures, and the rather ambiguously named “Recent crawl rate” and “Recent query rate” metrics. Together this provided only the most basic troubleshooting capability, and almost any search-related issue would land you knee-deep in log files with little clue of what you were looking for.
SharePoint 2013 has completely revamped the Search service application and its monitoring, and it now provides a wealth of information on the current and historical performance of the Search service application. The same crawl log information is still available, but it has now been supplemented with filterable, sortable data that SharePoint can plot out into extremely helpful graphs. Additionally, reports are generated that go beyond evaluating the performance of the search engine and move into evaluating the accuracy and effectiveness of the search results that are generated.
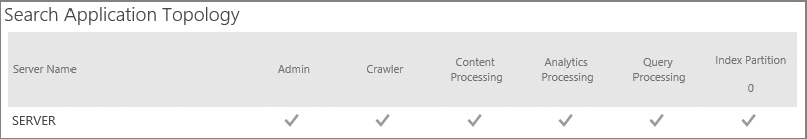
If you browse to the Search Administration page of your farm’s Search service application, the page initially looks almost identical to the 2010 version. However, immediately noticeable is the redesigned Search Application Topology section. It has been reformatted into an icon-based view that makes it easier to quickly identify which search components are running on which servers, and their status. Figure 20-13 shows the different roles in the Search topology as they appear in Central Admin.
The Crawl Log
The second thing you may notice is that the navigation menu to the left now has a dedicated Diagnostics section. Hurray! Starting with the Crawl Log subsection, it also looks almost identical to its counterpart in SharePoint 2010. However, there are some subtle changes that are of exceptional value. Figure 20-14 shows the new Crawl Log screen.
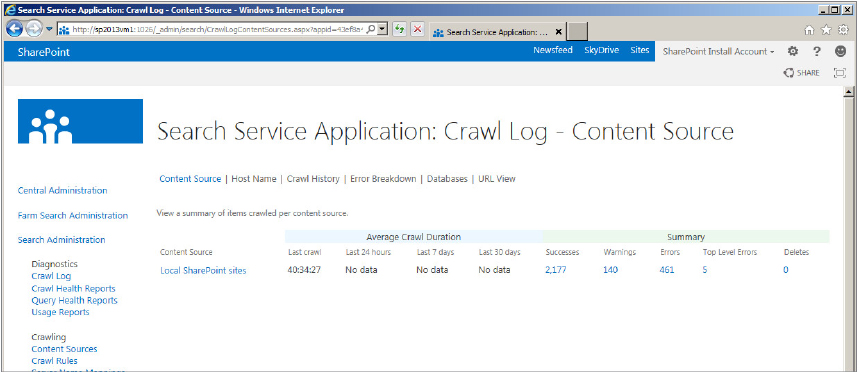
Views you can see from the Crawl Log include:
- As in SharePoint 2010, the Content Source view shows a summary of recent successes, warnings, errors, and deletes as organized by content source. New in SharePoint 2013, it also tracks average crawl durations over three periods of time: the last 24 hours, the last 7 days, and the last 30 days. As in previous versions, the numbers in the columns (e.g., Success, Warning, etc.) can be clicked to see a detailed report of each item that was crawled.
- The Host Name view shows a similar summary of crawl results, but in this case grouped by host name of the items, rather than content source. This page is unchanged from SharePoint 2010; you don’t mess with perfection.
- The Crawl History view arranges the logs according to recently completed crawls, not only showing successes, warnings, errors, and deletes, but also including numbers for items that were not modified, items with security updates, and items with security errors. New to SharePoint 2013 are the additional values of Crawl Rate (in documents per second) and Repository Latency. Both of these new items are clickable links leading to graphs, which are discussed in subsequent sections.
- The Error Breakdown view (called Error Message in SharePoint 2010) enables you to easily view the errors for a specific content source, or a specific host inside of that content source. As with Host Name, this view is unchanged from SharePoint 2010.
- New to SharePoint 2013 is the Databases view. This view offers visibility into the usage of the crawl store databases associated with the Search service application. This information is not likely to be useful in most scenarios, but in an environment that utilizes multiple SQL servers, it could be used to identify load on a given server.
- The URL view enables you to filter crawl logs based not only on host name, but also on other portions of the URL, as well as status, message, and start and end time. The options are the same as those available in SharePoint 2010, but the layout of the dialog has been rearranged a bit, and Content Source was changed from being an alternative to the URL box to now being grouped with the other filters.
Crawl and Query Health Reports
The Crawl Health Reports and Crawl Query Reports sections of Diagnostics are entirely new for SharePoint 2013, and entire chapters could be written on just these two sections alone. They expose a wealth of detailed information about the performance of the Search service application, using a straightforward interface that presents the information in an easily understood format.
Your best bet here is to explore the various reports and consider various scenarios in which they could be useful. For instance, if crawls are taking a long time to complete, you can check the Crawl Rate report to determine whether one content source is crawling slower than the others, or whether the service takes longer to process certain types of updates. If your users are complaining about slowness while a crawl is running, use the CPU and Memory Load report to see how many system resources the crawl is consuming, and which element of the crawling processes is having the greatest impact. If your users are reporting slowness in search results, use the Overall view of the Query Health Reports section to see if there has been a recent spike in latency for the processing of server rendering, object model, or back-end requests. Similarly, you could check the SharePoint Search Provider view to determine whether the delay is related to security trimming.
Usage Reports
The last of the new additions to SharePoint 2013’s search monitoring capabilities are the Usage Reports. These reports move beyond Search service performance, and into the realm of search result accuracy and search trending. From these reports you can pull information about the top queries by day or by month, or track abandoned queries, which could indicate that users are not finding what they’re looking for in the results.
SharePoint 2013 introduces the Query Rule into search as a means of improving the search experience. Query Rules are rules that enable Search administrators to control how results are ordered. They allow content that matches a rule to be promoted or grouped with other results. The Query Rule reports are intended to guide you first in shaping your search design to improve accuracy and usefulness using Query Rules, and then in evaluating the effectiveness of your changes.
Chapter 13, “Configuring and Managing Enterprise Search,” covers these monitoring topics and other search-related topics in more detail.
SUMMARY
SharePoint 2013 is a great product that works remarkably well. To get the most out of it, though, you need to keep an eye on it, using the well-known “trust, but verify” philosophy. SharePoint 2013 offers numerous ways you can look under the hood to see how things are running, in many cases enabling you to address an issue before it becomes a problem (and users interrupting your engrossing game of Spider Solitaire because SharePoint is down). you can peek in on SharePoint by looking at the ULS logs and Event Logs, as well as the Search service application’s reports. You can also let SharePoint do some of the heavy lifting for you by looking at the Health Analyzer to see if any problems are cropping up there. You have many ways to keep SharePoint at the top of its game.