
Chapter 19
Troubleshooting SharePoint
WHAT’S IN THIS CHAPTER?
- The Unified Logging Service
- The Correlation ID
- The Developer Dashboard
- Additional tools and resources
For a product that provides so many options and functions, SharePoint is remarkably stable. That being said, SharePoint isn’t perfect. Sometimes things don’t work the way you might expect, and sometimes they may not work at all. Even a great administrator won’t know everything about a system as complex as a SharePoint farm, so it is important to understand the basics of getting to the root of SharePoint issues. This chapter demonstrates a wide range of ways in which SharePoint speaks to you about its problems. Before digging into the details, however, remember that your brain is your best troubleshooting tool. Find out as much information about the error as possible before you even touch the server. When does the error occur? Does it happen to everyone, or only to certain users? Does the problem occur only in certain scenarios or does it seem to be random? Finally, not to be forgotten, what was the last thing that changed? Did you just add a patch or install a farm solution? Did all your users just upgrade their browser version? Things that are new or things that were old and eliminated are always good places to start when looking for the cause of a problem. If none of the basics give you an idea of what went wrong, have no fear; there are plenty of other places to look.
THE UNIFIED LOGGING SERVICE
The Unified Logging Service (ULS) is the system that drives two of the diagnostic logs in your farm, the trace log, often referred to as the ULS log, and the SharePoint-related errors that surface in the Windows Event Log system. The trace log wasn’t created strictly for troubleshooting. On the one hand, although you can configure the amount of information that is captured by the ULS, generally the service tracks a lot of events, big and small, as they occur and logs them in the trace log. On the other hand, messages that actually are sent to the Windows Event Logs from the ULS are much more likely to be areas of concern for troubleshooting. Because it can become confusing having things logged in two places, SharePoint has tried to make it a bit easier. Every error that is logged in the Windows Event Logs will always have a corresponding entry in the ULS logs. This is a welcome change from earlier versions of SharePoint (I’m looking at you SharePoint 2003 and SharePoint 2007), for which some events would be in the ULS logs and others would be in the Windows Event Logs. Trying to find all the log entries associated with a problem was like looking for Blackbeard’s treasure.
The amount of data provided by the ULS can be overwhelming; and as mentioned earlier, it is possible to configure it to report with more or less detail. However, if you have spent a lot of time and effort configuring the logging for general monitoring purposes, it might not be a great idea to change those settings for a short troubleshooting window, especially if other people use the trace logs for other purposes.
Windows Event Logs
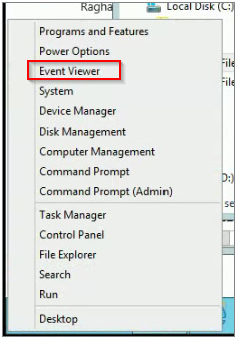
Because the ULS tends to send messages to the Windows Event logs only when something serious happens, they are a good place to start looking for clues. To open the Event Viewer for Windows Server 2012, go to the Start panel that has all the Windows tiles and begin typing Event Viewer until it appears in the apps list; or if you are in the desktop view put your mouse cursor in the lower left-hand corner and click the right mouse key, or press Windows+X. This will open a command menu that includes the Event Viewer, as shown in Figure 19-1.
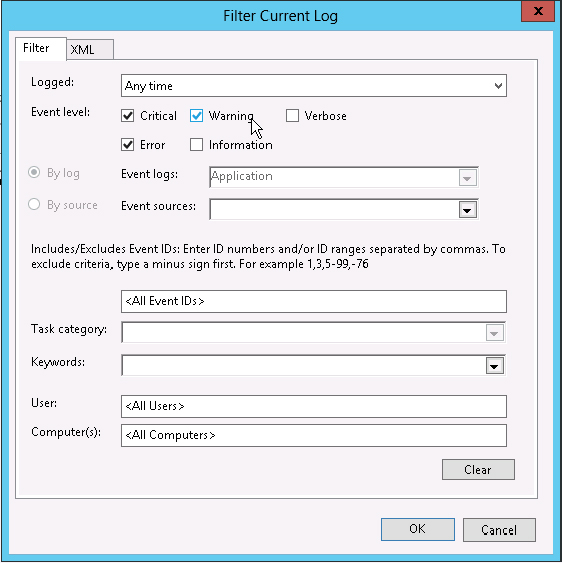
While some strictly informational items for SharePoint might appear in the Event Viewer, typically the event level will be either Critical or Warning if it is of interest to a troubleshooter. To help separate the wheat from the chaff, you can put the Windows Event Viewer into a “bad news only” view that strips out all the events in the Information and Verbose categories, showing only events that are Critical, Warning, or Error. This makes it much easier to find problems when you’re troubleshooting. To experience this nirvana, select a log in Event Viewer, such as the Application log. On the right-hand side of the screen, under Actions, click Filter Current Logs... When the Filter Current Log dialog appears, click the check boxes next to Critical, Warning, and Error. After you click OK, this log will only show errors. Figure 19-2 shows the dialog with the correct boxes checked.
You can take this one step further to filter out events that you don’t care about. As you’re troubleshooting a problem, you may see error events that don’t pertain to the issue you’re currently doing battle with. While you’re certainly welcome to fix other problems too, those errors are just getting in the way for the moment. You can use that same filter to filter out unwanted events. Click the Filter Current Log action again to return to the filter settings. In the box that is populated with “<All Event IDs>“ type a minus sign (-) and then the Event ID of the event you want to filter out. You can filter out multiple events by separating them with commas. After you’ve shown that particular SharePoint problem who’s boss, you can remove the filters by clicking Clear Filter under Actions, or access the Filter Current Log dialog and click Clear.
Figure 19-3 gives you an idea of what a typical SharePoint error looks like in the Event Viewer when no filters are applied.
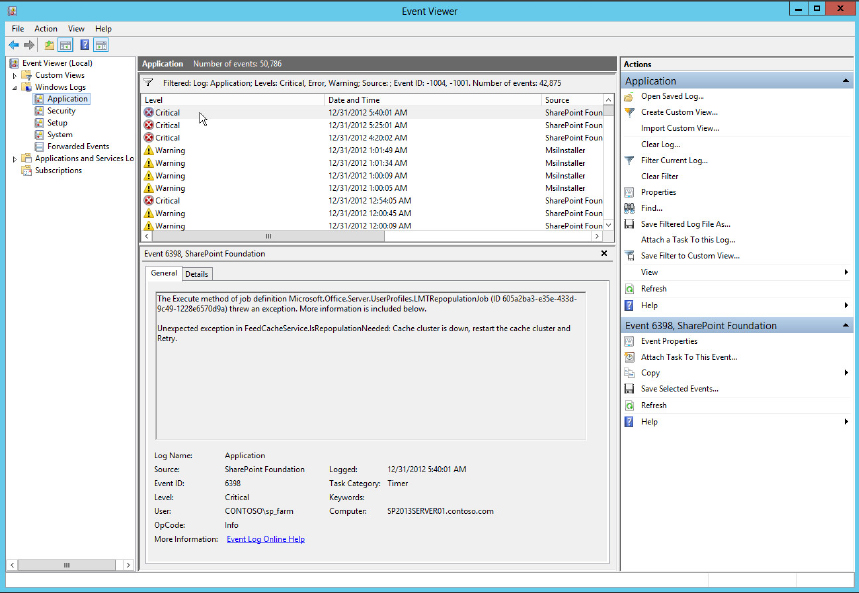
Immediately you can see several pieces of information that will make your troubleshooting easier. The Date and Time column is essential because, as you will see, the SharePoint trace logs contain a lot of information. Having a time column, especially with a section for seconds, can be very handy, as one minute of trace logs can be several pages long.
For example, if a user presents a problem and says, “It happened about lunch time,” that gives you a rough idea of where you need to begin looking in the Event Log. When you see a red Critical error at 12:13:27 with the word SharePoint in the Source column, you now have a specific time to search for even if the rest of the information in that log entry isn’t helpful.
Very often, the Source column of the error will show SharePoint Foundation, SharePoint Server, or make some other direct reference to SharePoint, which helps separate SharePoint errors from other issues on the server.
The Task Category column will sometimes reference a SharePoint service or service application, such as Health (the Usage and Health Data Collection service application) or Timer (the SharePoint Timer Service), so remember to check that column to get an idea of where SharePoint is having the problem. It is also likely that the same category will appear in the corresponding trace log column described in the next section.
The Event ID can be one of the most immediately useful pieces of information you have. The nice thing about having Event IDs in the Event Viewer is that you can easily find more information about each event by doing an Internet search. Referring back to Figure 19-3, note the Critical SharePoint Foundation errors with an Event ID of 6398. An Internet search for “SharePoint Event ID 6398” will return hundreds, if not thousands, of articles. In this particular case, you will find that many different problems may be attached to Event ID 6398 because it is the standard Event ID for SharePoint timer jobs that fail. For this type of error, the Event ID isn’t enough; you have to look at the specifics of the error itself. Figure 19-4 shows the Details tab that is displayed when you double-click on a particular Event Viewer entry.
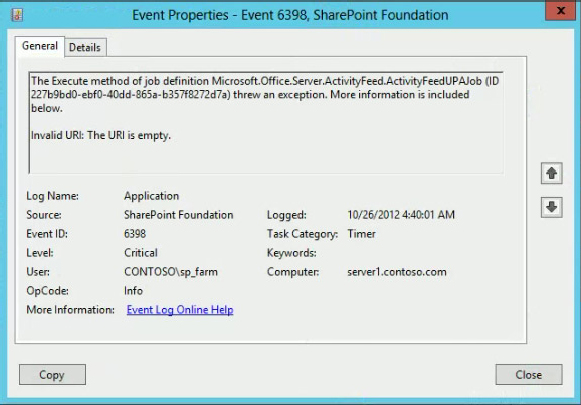
This tab contains a lot of information. In addition to doing an Internet search on the text of the error, you can see the user under whom the error happened — in this case the farm account, because that is usually the user under whom the SharePoint Timer job runs. You also have a handy Copy button that enables you to copy the entire text of the error, both from the General tab and the Details tab, so you can paste the information into a support ticket or your personal notes. Not a bad start for the first log you have looked in! Just in case you are curious, this particular error was caused because the User Profile Synchronization service application was not fully configured. If only all SharePoint problems were this easy to solve.
Although you can find SharePoint-specific issues in the Event Viewer, remember that SharePoint runs in Windows and uses IIS to serve information. Any critical errors in the Event Viewer are worth examining. Windows and IIS are key partners in making SharePoint work, so don’t ignore them when they beg for help. SharePoint-specific errors are a good place to start looking for the answer to a specific problem, but they may not be the only place you need to look.
This also means that you’ll have to venture outside of the Application log and look in the System and Security logs. It’s not uncommon for a Windows issue or a security issue to be the cause of SharePoint misbehaving. It’s not enough to just to poke around in the Application logs and hope for the best. You have to get your junior detective magnifying glass and sniff around in the other logs, too, in order to piece all the clues together.
While you are looking at this stuff, give some thought to managing your Event Logs. By default, Windows saves 20 megabytes of Event Log data, and once that limit is met new events will overwrite the oldest events. In a way that’s nice, the log never gets larger and will never accidently fill your hard drive, and the logs don’t take quite as long to open remotely. Unfortunately, this default setting also means that when there are serious issues, 20 megabytes may only hold a day or two of information and the beginning of your problem may be overwritten before you get a chance to look for it. Microsoft has lots of information about managing the event logs at http://technet.microsoft.com/en-us/library/cc766178.aspx. This link includes information such as how to change log retention settings, clearing and archiving the data, as well as reading archived logs that are no longer in the current Event Log. Consider a retention strategy that allows you to archive and keep logs for a set number of days to avoid losing important troubleshooting data. Every organization has different requirements, but a good general target is to make sure you have Event Logs from the last week copied off of the SharePoint servers on a nightly basis in case of a serious failure.
Trace Logs
Trace logs contain only SharePoint-specific information, but much of it is about normal operations, not specifically errors. By default, the trace logs are found in %CommonProgramFiles%Common Filesmicrosoft sharedWeb Server Extensions15LOGS, and %CommonProgramFiles% is typically the C:Program Files directory. The log files themselves have names like SERVERNAME-20121026-1200.log. Notice 2012, indicating the year; 10, for the tenth month; 26, for the 26th day; 12, for the 12th hour; and so on. This naming convention helps you find the right log to look in if you know the date and time of the event you are looking for. By default, a new log file is created every 30 minutes. The trace logs can be overwhelming even when the ULS is set to collect only moderate amounts of information. At the very least you want to have a specific time or error message to look for in the logs, as each log file may be hundreds of megabytes or more in size. The data in the trace logs is laid out in columns, so it is easily parsed using an Excel spreadsheet or similar tool, but it can also be read with notepad.exe. Because the listings are usually quite lengthy, they would not fit nicely on a printed page in this book, so Table 19-1 summarizes a typical trace log entry.
TABLE 19-1: Trace Log Entries
| COLUMN HEADINGS | EXAMPLE LOG DATA |
| Timestamp | 10/26/2012 12:16:09.21 |
| Process (the process that generated the log entry) | w3wp.exe (0x00F4) |
| TID (Thread ID) | 0x16A8 |
| Area | SharePoint Foundation |
| Category | Topology |
| EventID | e5mc |
| Level | Medium |
| Message | WcfSendRequest: RemoteAddress: ‘http://server:32843/e7560c95030343e08f2ff3e3ed7f70c9/MetadataWebService.svc’ Channel: ‘Microsoft.SharePoint.Taxonomy.IMetadataWebServiceApplication’ Action: ‘http://schemas.microsoft.com/sharepoint/taxonomy/soap/IDataAccessReadOnly/GetChanges2’ MessageId: ‘urn:uuid:18a9aac5-894d-4370-8b2d-95e42caeb137’ |
| Correlation (the Correlation ID) | 6d951f7e-7796-44e5-907a-11f59cf974c6 |
The data shown in Table 19-1 is nothing exciting; in fact, the log it was pulled from had literally hundreds of lines that were nearly identical, representing a normal process that the Metadata service application goes through every day. This is why it is important to use other sources of information such as the Windows Event Log to narrow down your search in the trace log using things like error message text or timestamps.
Powerful PowerShell Tweaks
Just like the Event Logs, the trace logs have certain default settings that may or may not be appropriate for your organization’s needs. Chapter 20 has two sections about configuring the ULS, creatively named Configuring ULS via Central Administration and Configuring ULS via PowerShell. There is no need to repeat everything in those sections here, but a quick overview might be helpful so you don’t have to skip around too much. PowerShell is cooler than Central Administration so that is what the examples will use.
Open the SharePoint 2013 Management Shell, type Get-SPDiagnosticConfig, and hit enter. The output of the cmdlet will be something like this:
PS C:Usersadministrator.CONTOSO> Get-SPDiagnosticConfig


AllowLegacyTraceProviders                   : False
AppAnalyticsAutomaticUploadEnabled          : False
CustomerExperienceImprovementProgramEnabled : True
ErrorReportingEnabled                       : True
ErrorReportingAutomaticUploadEnabled        : True
DownloadErrorReportingUpdatesEnabled        : True
DaysToKeepLogs                              : 14
LogMaxDiskSpaceUsageEnabled                 : False
LogDiskSpaceUsageGB                         : 1000
LogLocation                                 : %CommonProgramFiles%Microsoft
                                              SharedWeb Server
                                              Extensions15LOGS
LogCutInterval                              : 30
EventLogFloodProtectionEnabled              : True
EventLogFloodProtectionThreshold            : 5
EventLogFloodProtectionTriggerPeriod        : 2
EventLogFloodProtectionQuietPeriod          : 2
EventLogFloodProtectionNotifyInterval       : 5
ScriptErrorReportingEnabled                 : True
ScriptErrorReportingRequireAuth             : True
ScriptErrorReportingDelay                   : 60
Remember, the trace logs aren’t just for troubleshooting, so don’t jump straight into changing these settings without giving the results some thought. There are a few settings that could be tweaked, either for convenience or the safety of your farm. First there is LogLocation, the location you see in the preceding code snippet, and %CommonProgramFiles%Microsoft SharedWeb ServerExtensions15LOGS is the default location for the ULS logs. If you prefer the logs to be on a separate drive than the operating system, a quick change is in order. Maybe you want the ULS logs in a new directory on a different drive such as D:. To make things easy to find for anyone else that gets on your server, don’t change the path, just the drive letter. Use the following command to move the ULS logs to the same path, but on the D: drive:
. Set-SPDiagnosticConfig -LogLocation "D: Program FilesCommon Filesmicrosoft sharedWeb Server Extensions15LOGS".This won’t move or copy the existing log files though so be sure to move or delete those manually.
Unlike the Event Logs, the trace logs are set to keep 14 days’ worth of log data by default, not a set number of megabytes. Combined with the fact that the -LogMaxDiskSpaceUsageEnabled parameter is set to False, this means that your logs could use all of the available hard drive space. Even setting -LogMaxDiskSpaceUsageEnabled to True would only limit the logs to 1000 gigabytes of space as defined in the -LogDiskSpaceUsageGB setting. Does that D: drive even have a terabyte free? Settings like this are trouble waiting to happen. If you move the trace logs to the D drive, but it is only a 500GB volume, you will want to change the Set-SPDiagnosticConfig parameters appropriately. To protect your server and still capture as much data as possible, you would use the following commands:
Set-SPDiagnosticConfig -LogDiskSpaceUsage 450
Set-SPDiagnosticConfig -LogMaxDiskSpaceUsageEnabled True
Why use 450 for the disk space usage instead of 500? As a rule of thumb, a minimum of 10% of a disk volume should be free if at all possible to prevent running out of space and causing data loss. A couple of quick changes using Set-SPDiagnosticConfig and you have given yourself easier access to the trace logs and protected yourself from possible data corruption. Not bad for one PowerShell cmdlet.
Set-SPDiagnosticConfig has other options that may be especially useful when troubleshooting. In the output for Get-SPDiagnosticConfig, the LogCutInterval is 30 minutes by default. That means the ULS will spend 30 minutes filling a single trace log file before it creates another. In situations where there are lots of errors, a single trace log file may get very large in half an hour. Later in the “Using PowerShell to Tame the ULS Logs” section, you will see information about the New-SPLogFile cmdlet, but to use it effectively it helps to know when an error happens or how to cause it on demand. If you just want to make sure the logs are smaller so you can open and read them in notepad, it might be enough just to limit the amount of time the ULS spends putting data into each file. For example, changing the LogCutInterval to 5 means that only 5 minutes of data is contained in each trace log file. To make this change use the cmdlet below.
Set-SPDiagnosticConfig -LogCutInterval 5This won’t cause the ULS to capture less data, it just causes it to put the information in 12 trace log files an hour instead of just 2. Each file will be smaller and more manageable.
Once you are finished troubleshooting you probably want to set the -LogCutInterval back to 30 just to cut down on the clutter of generating so many trace logs per hour.
More information about the parameters of the Set-SPDiagnosticConfig cmdlet can be found at http://technet.microsoft.com/en-us/library/ff607575.aspx and there are more examples of its use in the Monitoring SharePoint 2013 chapter ahead.
Another way you may be able to prevent future troubleshooting problems is to encourage your developers to use the trace logs in their project. This is an administration book, not a developer guide, but at very least you can provide http://msdn.microsoft.com/en-us/library/ee535537(v=office.14).aspx as an introduction if they have no idea where to begin.
Viewing the ULS Logs with the ULS Viewer
While the ULS logs are simple, well-formatted text files, trying to look through them with a garden-variety text editor can be maddening. Trying to investigate the problem may end up being worse than the problem itself. Fortunately, however, there is a tool written expressly for the purpose of opening ULS log files and displaying them in such a way that humans can actually make sense of them. Called the ULS Viewer, the best part about this tool is that it’s a completely free download at MSDN: http://archive.msdn.microsoft.com/ULSViewer. This tool should exist on every SharePoint server in your environment; it’s that handy. It’s a mere 500KB in size and doesn’t require any kind of install. When you need it, you just fire it up and bask in its efficiency. (Note that if you download it directly from the Internet to your server, you may need to “unblock” it before you can run it.)
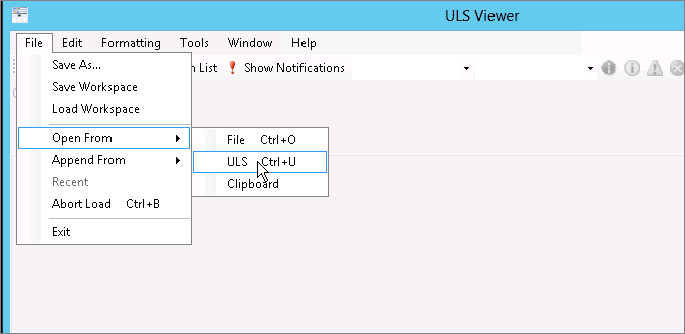
The ULS Viewer can view ULS logs from a couple of different locations, but this chapter focuses on the live logs. To watch the ULS logs in real time, start the ULS Viewer on your server by selecting File ⇒ Open From, as shown in Figure 19-5. Alternately, just select Ctrl+U.
By default, the ULS Viewer opens the logs from SharePoint’s default log directory. In most cases you can just click OK at the File Location dialog that appears. If you want to watch the ULS logs from another server, you can also enter the UNC path to its ULS logs in that dialog. This enables you to monitor the logs from several servers from one location.
If you get an “access denied” error when the ULS Viewer tries to open the logs, make sure the user you’re logged in as has permission to that location. If you’re trying to view the logs on the local server, you need to run the ULS Viewer with the “Run as administrator” option.
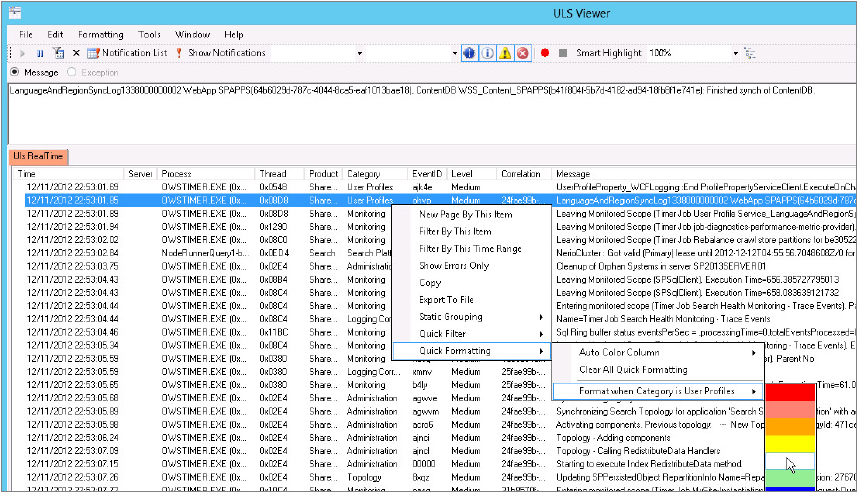
Once the ULS Viewer is open and doing its job, it can be a little intimidating, especially on a busy server, but it provides quite a few methods for slicing and dicing log entries to make it easy to find what you’re looking for. Probably the most helpful is the capability to format log entries based on common criteria. For example, the User Profile Service can be a bugger to work with sometimes, so it often provides the reason to start the ULS Viewer. Figure 19-6 shows how you can format all the lines that pertain to the User Profile Service to the same color, making them easy to identify.
After that’s done, all the events within the User Profile Service category will be highlighted in the chosen color, as shown in Figure 19-7.
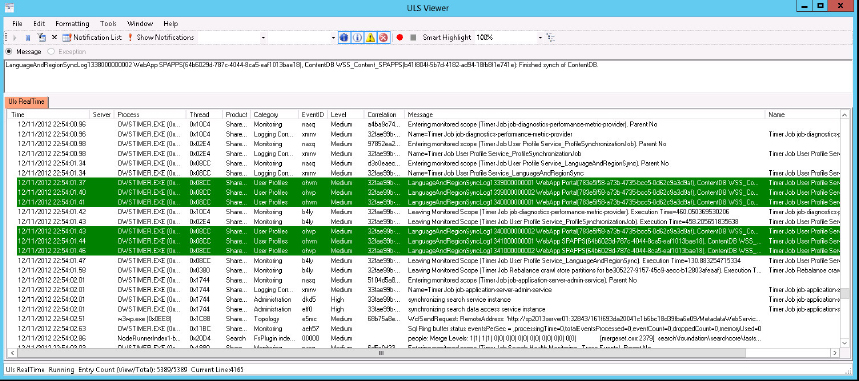
This capability makes it very easy to follow a specific issue without the pertinent log entries getting lost in all the other traffic. It’s very flexible; you can format based on any column, filtering the entries to whatever you’re trying to track down. You can also have multiple formatting statements in place at once. Using formatting to highlight the log entries you want is usually better than filtering out the ones you don’t want. You never know if something unexpected is causing the issue you’re trying to resolve.
For most troubleshooting you should pay special attention to four areas of a log message. The Message column contains text that usually provides specific information. If the text doesn’t get you closer to an answer by itself, you can search the Internet for similar problems. The Process column can help isolate which services, and therefore which service accounts, are involved in the error. As noted earlier, the Category column is also a good one to watch. Finally, the Correlation ID column, which is discussed in more detail in the section “The Correlation ID: Your New Best Friend,” can help you hone in on the exact area of the log relevant to your problem.
Using PowerShell to Tame the ULS Logs
While the ULS Viewer is a fine tool, it’s useful to know other ways of getting the same information. We all have different work preferences, so this section shows you how to reign in those ULS logs with PowerShell. Anytime you find yourself in a position where you need to use PowerShell with SharePoint, you should ensure that the logged-in user meets a few requirements:
- The user should have the securityadmin fixed role in the SQL Server instance(s) where your SharePoint databases reside.
- The user should have the db_owner fixed role on all the databases with which you hope to interact.
- The “Run as Administrator” option should be used when starting the SharePoint 2013 Management Shell.
With those three requirements met you are ready to start. The first cmdlet to discuss is Get-SPLogEvent. This cmdlet pumps the trace log event data into the PowerShell output window faster than you can probably read it, and generally the data is too wide to display in the window. It also won’t stop until it has displayed every single event in your server’s ULS logs. That’s probably not helpful, and will probably result in you falling asleep at your desk before it is finished. Fortunately, Get-SPLogEvent has numerous parameters, as do most PowerShell cmdlets. Chapter 7, “Administering SharePoint 2013 with PowerShell,” contains all the details about how to get the most out of it, but here are a couple of brief examples. The following cmdlet returns all the log events in a time range (using United States date and time formatting):
Get-SPLogEvent -StartTime "10/25/2012 12:00" -EndTime "10/25/2012 13:00"
Because formatting the date and time part can be tricky, there are some shortcuts you can use. The following PowerShell command will return all the events that occurred in the last 10 minutes:
Get-SPLogEvent -StartTime ((Get-Date).addminutes(-10))With this statement we’re being sneaky. The Get-Time cmdlet returns the current date and time. To specify a start time that occurred 10 minutes ago, you add a negative 10 minutes to the current time. Be careful using Get-SPLogEvent without the -StartTime parameter, otherwise it will pull data starting from the first trace log available to it, which may be days or weeks old.
The following line shows how to use PowerShell to view log events from trace logs in a specific location:
Get-SPLogEvent -Directory "C:Logfiles"
This enables you to view only the files you think are relevant to your problem, rather than the entire default log location. If you have multiple servers in your farm, you can copy their ULS logs to one location and use this technique to view them. Later in this section you’ll see another option for dealing with multi-server farms.
Unfortunately, when you use a cmdlet like this in the PowerShell command window, your output is limited by the size of the PowerShell window itself. The same problem exists if you try to use other PowerShell commands to sort the data, such as the following:
Get-SPLogEvent | Where-Object {$_.Level -eq "High"}
This command takes the Get-SPLogEvent cmdlet and pipes it through a loop that examines each line, looking for and then outputting only those trace log events for which the Level (from Table 19-1) equals High. The syntax is perfectly valid, but unfortunately the output looks something like this:
Timestamp   Area                      Category                  EventID  Level
---------   ----                      --------                  -------  -----
08:47:39.93 SharePoint Server         Unified Logging Service   b8fx     High
08:47:40.88 SharePoint Foundation     SQM                       8zn7     High
08:47:42.51 SharePoint Foundation     Unified Logging Service   b8fx     High
08:47:42.58 SharePoint Foundation     SQM                       8zn7     High
08:47:42.60 SharePoint Foundation     Unified Logging Service   b8fx     High
08:47:42.66 SharePoint Foundation     SQM                       8zn7     High
08:47:53.46 SharePoint Foundation     Upgrade                   fbv7     High
No message, no Correlation ID; in short, most of the information you probably want will be chopped off the end. Don’t despair, however; there is one more trick you need to see and it is a good one! The following Out-GridView cmdlet sends the PowerShell output to an interactive table viewer, as shown in Figure 19-8:
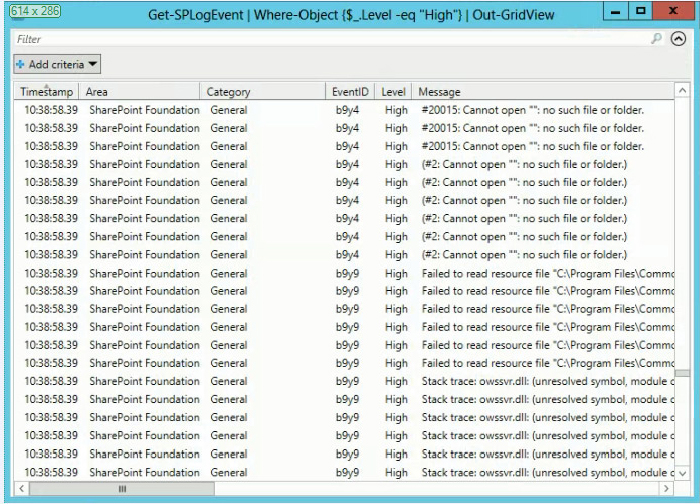
Get-SPLogEvent | Where-Object {$_.Level -eq "High"}|Out-GridViewFirst, notice that this table viewer doesn’t chop off any data you want to see. Even better, this interactive table viewer also includes a number of additional options for sorting the output using the Add criteria button and filter line you see. The Out-GridView view is also a good tool to use for copying data to be pasted into spreadsheets and other applications. You can get the same output shown in Figure 19-8 by using Get-SPLogEvent | Out-GridView and adding a criteria of “and Level equal High” in the interactive grid viewer; but like many graphical tools, the viewer can be slow when sorting through very large amounts of data. Simplifying the output by using PowerShell will give you faster results.
Sometimes all this complex sorting isn’t necessary. Remember that the best time to use the trace logs is when you have some idea of where to look. If you are troubleshooting an issue you can reproduce, there are other ways to narrow down your search using PowerShell, such as the New-SPLogFile cmdlet. New-SPLogFile causes the creation of a new trace log file, making it much easier to search through the entries using Notepad or the ULS Viewer. To use New-SPLogFile you simply issue the cmdlet in a PowerShell session, perform the steps to reproduce your issue, wait a few minutes for everything to get logged, and then run New-SPLogFile again. The resulting log file will contain only the events that are happening around the same time as your error.
In larger SharePoint farms it can be difficult to determine which server an error is occurring on. It could be happening on the search index server, or on one of two web front ends. Rather than trying to reproduce the issue on each server several times and search their individual trace logs, you can use the Merge-SPLogFile cmdlet to create one super trace log file that contains data from all the farm members. Here is one example of using this cmdlet:
Merge-SPLogFile -Path C:LogsSuperlog.txtAfter you run this command, SharePoint will schedule a timer job to run on each server in your farm to copy the last hours’ worth of ULS logs to the file you specified — in this case, c:logsSuperlog.txt on the local system. It might take a few minutes for that file to be completely populated.
If you run this on a farm of any size, you will quickly realize that an hour’s worth of logs from all your servers results in a pretty unwieldy file. There are a few methods to make the merged file a little less comically large. For one, you can restrict the time frame during which it merges. Merge-SPLogFile supports the same –StartTime and –EndTime parameters that Get-SPLogEvent supports. This makes it easy to retrieve only the last few minutes’ worth of events in your merged file. You can also filter the events on many of the fields, such as level, message, and area. That’s not ideal, though. You never know what surrounding events might help you figure out the cause of a problem. It’s better to get all the events during the given time. You can view the merged file with the ULS view described earlier, so consider filtering and formatting inside of that if necessary.
THE CORRELATION ID: YOUR NEW BEST FRIEND
This section could have been called “Correlation ID Love and Appreciation,” as the Correlation ID really is that helpful when it comes to troubleshooting SharePoint. Unfortunately, some users are confused about what exactly Correlation IDs are, so this section has been set aside in order to clear things up.
If you are unfamiliar with Correlation IDs, they are the GUIDs (A Globally Unique Identifier that’s 32 hexadecimal characters long) that sometimes appear when an error occurs, as shown in Figure 19-9.
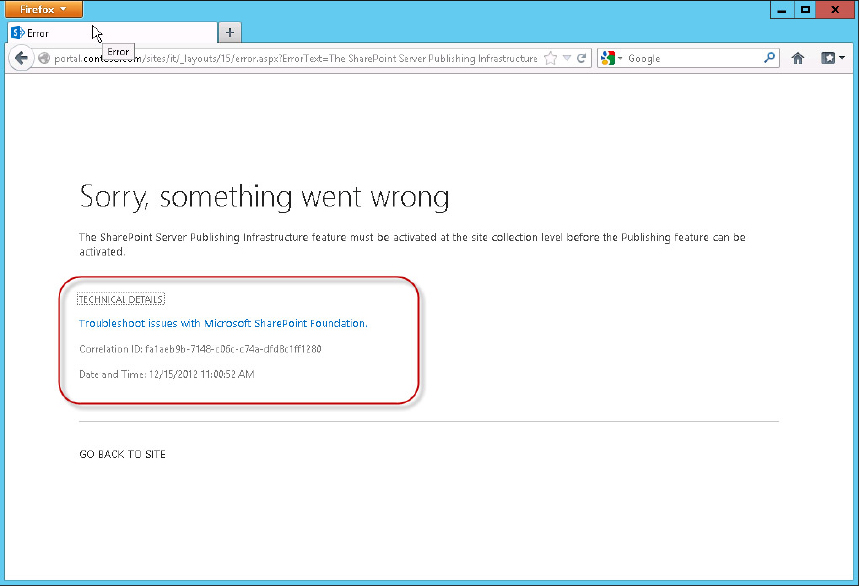
To get to the meat of the error message, you have to click the Technical Details link. When you do, you are rewarded with a Correlation ID as well as the exact time of the error. Both of these details can be used to hone in on all the log events that led up to the error. In this case, you also received an error message indicating exactly what the problem is, but SharePoint isn’t always that generous.
When speaking with SharePoint administrators and users, it is common to hear things like “I searched the Internet for an hour looking for that Correlation ID, and I couldn’t find a single answer.” The reason people can’t find Correlation IDs in an Internet search is because they aren’t error codes like Event ID numbers from the Windows Event Viewer. Instead, the Correlation ID is a GUID that is applied to every “conversation” that SharePoint has with either users or itself. You can think of it as a fingerprint for all events that happen on your farm. You can use Correlation IDs to correlate events that are part of the same conversation.
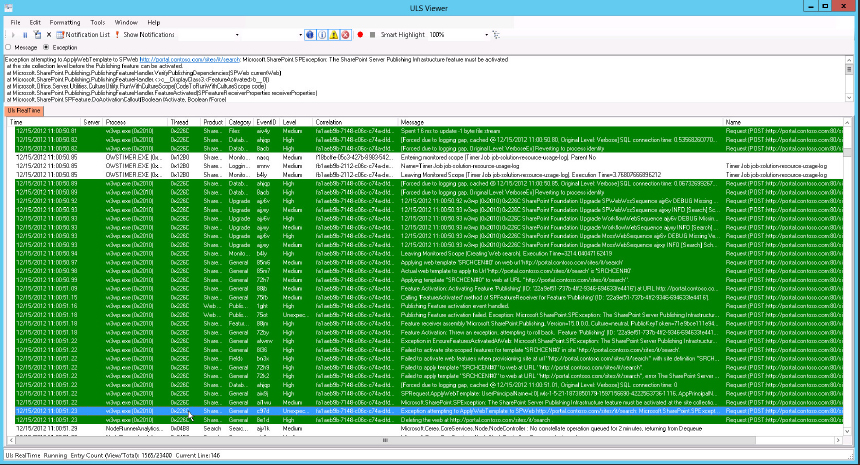
Referring to Table 19-1, note that the Correlation ID is in a column of its own. If you replicate an error that displays an error message like this 10 times, each time you will get a different Correlation ID; and each time the ID will be found in the trace logs associated with the time and server on which the problem occurred. If you are lucky enough to have this ID, it can greatly reduce your troubleshooting time. By paying close attention to the time when a message like this appears, you can go straight to the trace log from that time period, open it in the ULS Viewer, and search for the Correlation ID to get to the exact spot in the log where your problem occurs. Figure 19-10 shows the ULS Viewer displaying the error shown in Figure 19-9, with all the correlated events highlighted. These events were all formatted according to Correlation ID. You can watch the entire process as it happens, culminating with the surprise ending when you get the failure. Although the error in these figures is easy to diagnose, that’s not always the case. Seeing all the events that led up to an error can be important in determining why it occurred.
You can also use some of the PowerShell tricks previously covered to search for the Correlation ID you want to match. This eliminates a lot of effort associated with narrowing down your search of the trace logs. Correlation ID messages are one of the few ways in which SharePoint will make a direct reference to the trace logs and assist you with finding the cause of an issue.
Remind the users of your SharePoint farm that when they are reporting problems, a few key pieces of information can help you resolve the issue more efficiently. Writing down Correlation IDs or providing screen shots will be helpful, but the URL of the page they were accessing and the date and time of the error could be just as important.
THE DEVELOPER DASHBOARD
Administrators and developers of SharePoint 2010 may be familiar with the SharePoint Developer Dashboard. In SharePoint 2013 this tool has been extensively reworked, making it an even more useful and usable addition to your troubleshooting toolbox. The 2010 version of the Developer Dashboard made some design choices that may have prevented it from being widely used as a general troubleshooting tool. Certain configurations created performance problems; and attaching the Dashboard data to the bottom of pages sometimes created problems, rather than help resolve them. The SharePoint 2013 Developer Dashboard has received a promotion, now enjoying its own window. The new window loads a page that’s located at /_layouts/15/devdash.aspx in the web you’re browsing. It no longer changes how the SharePoint pages look when they load.
The Developer Dashboard can’t be activated from SharePoint Central Administration. Instead, the best method is to use PowerShell. To enable the Developer Dashboard, open the SharePoint 2013 Management Shell and enter the following commands:
$devdash = [Microsoft.SharePoint.Administration.SPWebService]::ContentService.

DeveloperDashboardSettings
$devdash.DisplayLevel = "On"
$devdash.Update()
To disable the Dashboard after you are finished using it, simply use the preceding commands but replace $devdash.DisplayLevel = "On" with $devdash.DisplayLevel = "Off".
You can also use the following stsadm commands if you insist on doing things the uncool way:
stsadm -o setproperty -pn developer-dashboard -pv on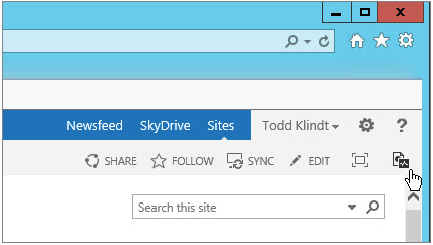
stsadm -o setproperty -pn developer-dashboard -pv offEnabling the Developer Dashboard adds the icon shown in Figure 19-11 to SharePoint pages. It looks like a piece of medical equipment, which isn’t a bad analogy. The Developer Dashboard isn’t displayed to all users, only users who have the AddAndCustomizePages permissions level in that web. This makes sense, as it isn’t useful to show users what’s wrong with a page if they can’t actually do anything to fix it. Because only privileged users can see it, you might be tempted to just leave the Developer Dashboard on all the time. However, don’t forget that users often get all kinds of elevated permissions in their site collections; and if your farm has MySites, all users are the site collection administrator for their own MySite, so they’ll always see it when they go there. To avoid a lot of “What does this icon do?” and “What’s this scary page I get when I click it?” type of questions, only turn the Developer Dashboard on when you’re actively troubleshooting a problem.
$devds = [Microsoft.SharePoint.Administration.SPWebService]::
 ContentService.

DeveloperDashboardSettings
$devds. RequiredPermissions = "EmptyMask"
$devds.Update()When you open the Developer Dashboard you might notice that most of the fields are blank. Only one URL is available in the Requests tab for the Dashboard to analyze. If you load or reload another SharePoint page after the Dashboard is open, the page will appear in this list; and clicking on its URL will populate the Dashboard with information, as shown in Figure 19-12.
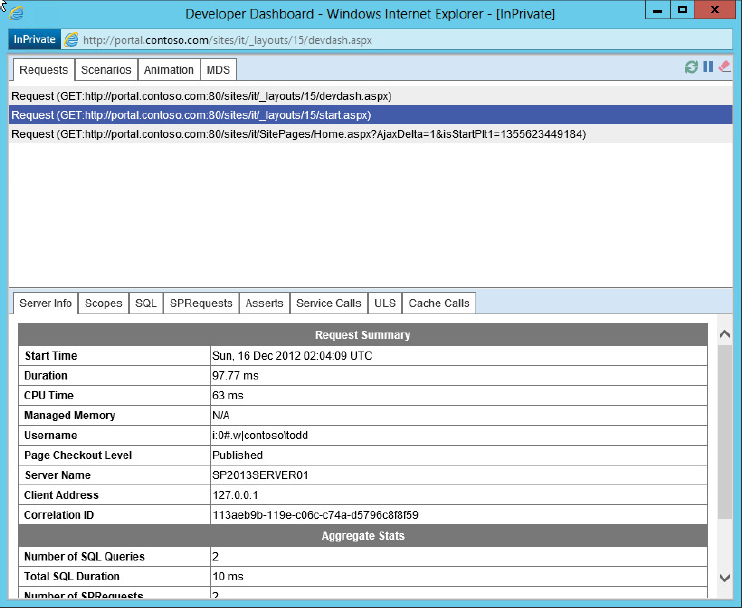
In Figure 19-12 you see three icons in the upper right-hand corner. The circle made of arrows is used to refresh the data in the window. The pause icon appears as two parallel bars and is similar to the pause button on many audio players. If you click on the pause icon it will be replaced by a right-pointing arrow icon similar to the play button on many devices. This right-pointing arrow is the resume button, which enables you to control when pages are captured in the Dashboard. The eraser icon enables you to clear all the current request URLs and their information from the Dashboard window when it starts to look cluttered.
As you can see, several items might be useful almost immediately for troubleshooting or performance tuning, such as Duration (of the page loads) and Page Checkout Level. How often have you heard “SharePoint is slow!” but without any concrete definition of what “slow” really is? Now you can easily get objective numbers that reflect exactly how long a page takes to load. If a page does take a long time to load, you can determine why using the Scopes tab, which shows all the steps that went into building and displaying the page, as well as how long each step took. It isn’t necessary to read through every step, but you can quickly look down the list for outliers, steps that took longer than the rest. If you’re troubleshooting a slow page load, that’s a good place to start. An unpublished page will take longer to load than a published page and may also throw unexpected “Access Denied” errors, so knowing the Page Checkout Level is also good information.
The Server Info page also has another useful bit of information on it — the Correlation ID for the page request. You know that when something fails entirely, SharePoint provides the Correlation ID on the error page; but what if only part of the page fails, such as a web part? You can use the Developer Dashboard to get the Correlation ID to start your troubleshooting.
Speaking of troubleshooting, the Developer Dashboard has another trick up its sleeve. The ULS tab exposes the section of the standard trace logs that pertains to the given page load. This enables you to avoid digging through a large text file and go straight to the information you need. No PowerShell, no ULS Viewer — how handy is that?
The Developer Dashboard does put a little extra demand on the SharePoint farm. If you have problems with the Dashboard not populating with data, there may not be enough memory free on one of the members of your farm. By default you need at least 5% of your memory free to get usable results in the Developer Dashboard so use it sparingly if your servers are under a heavy load.
MORE TROUBLESHOOTING TECHNIQUES
As you spend more time troubleshooting SharePoint, you pick up little techniques here and there that help you get to the bottom of an issue. This section describes a few of the techniques you can add to your troubleshooting toolbox.
Using Fiddler to Watch Your Web Traffic
Fiddler is one of the most unknown and underused tools for troubleshooting SharePoint. It is a web page debugging tool that enables you to watch both incoming and outgoing web traffic and even “fiddle” with it if necessary. Used with SharePoint, it’s a great way to troubleshoot slow page loads, Access Denied errors, Kerberos errors, pages that look wrong, and all kinds of problems. Fiddler is a free tool that can be downloaded at http://www.fiddler2.com. Fiddler works by setting itself as a proxy between the browser and the web server to which you are connecting. If your organization uses a proxy server already you may have to go through some extra steps to get Fiddler working in your environment. Luckily the Fiddler website has videos and documentation to help you out. For most users this isn’t an issue but it was worth the warning. Figure 19-13 shows what a typical Fiddler session looks like once you have everything up and running.
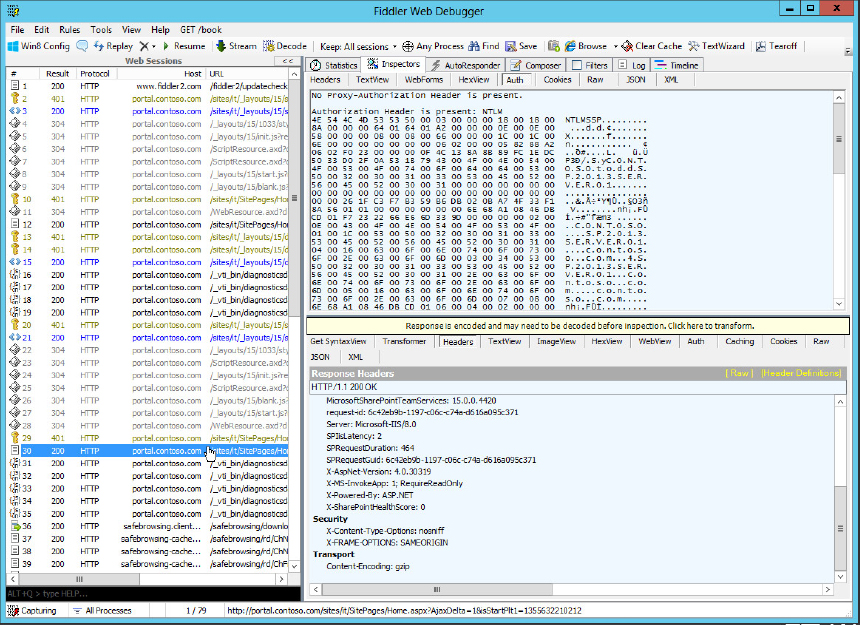
Fiddler has a lot of useful tabs, but Figure 19-13 shows two of the handiest. In the top pane, Inspectors has been selected, followed by Auth, which displays authentication information about this session. You can see that this web application is configured to use NTLM. If you’re having troubles with Kerberos, this tab is a great way to ensure that everything is using it. If you see NTLMSSP here, then the session is not. If you see “this session looks like it’s using Kerberos,” then it probably is.
The bottom pane is showing the HTTP headers for the session. There’s a lot of good information there, but three pieces are especially relevant to troubleshooting:
- SPRequestGUID — Where might you have seen that before? That’s right, it’s the Correlation ID for the current session. This is another good way to discover the Correlation ID so you can jump right to the ULS events that are pertinent to your session.
- X-SharePointHealthScore — This is a number from 0 to 10 that exposes how busy the SharePoint server is. The lower the number, the less stressed the server is. As the Health Score rises, SharePoint will start to shut off functionality in order to save resources for important tasks, such as answering page requests. If you’re getting flaky behavior from SharePoint, make sure the Health Score is low. Your server might just be overworked.
- MicrosoftSharePointTeamServices — This header exposes a SharePoint build number. For a lot of technical reasons involving DLLs, IIS, and various account permissions during patching operations and installations, this number might not always match the build number of your farm or site collection. In fact it might not even be the same on different members of your farm. The best advice is just not to trust this number as anything more than a rough estimate of what build your farm is on.
Fiddler can also allow you to troubleshoot HTTPS secured traffic, but doing so requires some extra configuration. Instructions for decrypting HTTPS encrypted traffic can be found at http://www.fiddler2.com/fiddler/help/httpsdecryption.asp. There are plenty of other things to discover in Fiddler; don’t just limit it to troubleshooting. The timeline tab can be used in troubleshooting by helping you spot resources that are taking a long time to load, but it can also be used to give your designers and programmers feedback on how they are impacting load times. Knowledge is power and Fiddler can serve up a lot of knowledge for the low price of nothing.
Creating a New Web Application
Sometimes a SharePoint problem defies logic. What is completely broken on one system will work everywhere else in the SharePoint farm. When that’s the case, it’s good to know whether your entire farm is broken or only some portion of it. To determine whether it’s only a portion, you can create a new web application. When a new web application is created, a fresh site is created in IIS, and along with that a new web.config file, not to mention all the objects in SharePoint and SQL Server. If something has become corrupted in SharePoint, creating a new web application gives you a blank slate to test with. If whatever was broken is working, then you can start slowly adding pieces back until something breaks. If there were web.config changes, add them. If features were applied to the broken web app, apply them to the new web app. You can also restore site collection or database backups to the new web application to test the content. As you do this, don’t forget to either make a DNS entry for your new web application or manually add it to your HOSTS file so it resolves.
Making All Your Service Accounts Local Administrators
A wise man once said about SharePoint, “It’s always permissions.” Quite often that’s true. If everything looks right but things still don’t work, make all the service accounts local administrators on all the SharePoint servers, and then reboot all around. If the problem you’re troubleshooting was caused by a service account not having enough permissions, this should fix it. If that works, start moving accounts back to see which one needs the extra permissions. You read that correctly. If making the accounts local administrators does work, start moving accounts back out of the local administrators group. Just because it made things work doesn’t mean you have your whole answer. It is still necessary to figure out which specific account didn’t have the permissions it needed and to figure out the lowest permission level it can have and still work correctly. Be sure to reboot between permissions changes. A related technique is to give all your service accounts the SYSADMIN role on your SQL servers. Sometimes a service account doesn’t have access to something in SQL that it needs, which breaks some functionality. Making all the service accounts SYSADMINs gives them access to everything. If global SYSADMIN rights fixes the problem, then you can investigate which account needs access to what.
Checking for Failed Timer Jobs
A lot of things in SharePoint are driven by timer jobs. If the Timer Job service becomes gummed up, a lot of unexpected collateral damage can result. Starting and stopping the SharePoint Timer Service Windows Service that runs the timer jobs is often enough to kick-start things. You can do that in the Services MMC console or with the Restart-Service PowerShell cmdlet. In rare cases, you may have to flush the Timer Job cache. You can find instructions for doing so in the KB article at http://support.microsoft.com/kb/939308.
Starting Fresh with IISReset
Doing an IISReset is sort of like giving SharePoint some flowers and a box of nice chocolates. If you are unfamiliar with IISReset, it is a command-line utility that stops and restarts all the IIS worker processes (w3wp.exe in Task Manager) and lets everything start fresh; all the IIS cache information is dropped as well. Like a good night’s sleep and a cup of coffee, IISReset just puts SharePoint in a better mood. In the name of good performance, SharePoint caches a lot of information. Sometimes all that caching bites you as bad things are cached or corrupted in RAM. Doing an IISReset lets SharePoint take a deep breath and start from a blank slate. It’s amazing how often that clears things up. IISReset has some downsides; for instance, all the existing sessions will be dropped and the sessions state will be cleared. That means if people are filling in a form or editing a list entry, data may be lost, so try to make sure you warn users or perform this step when they aren’t around to bug you. Some articles will advise using the /noforce parameter to avoid losing information that is being entered by users. This might be good advice if you are forced to try a reset on a production farm that is being actively used, but the /noforce option isn’t as complete in clearing things out of IIS so it sometimes doesn’t work as well. IISReset also drops all the cached data IIS is holding, so the first pages loaded after the reset will be slow to load (30 to 60 seconds is not unusual) so have some patience.
Reboots for Everyone!
Rebooting your computer to fix a problem is such a common suggestion it’s almost a cliché. There’s a reason for that: It works! Much like an IISReset helps get IIS’s brain straight; a reboot helps get the whole server’s head straight. Rebooting a server might feel like a cop-out, but its purpose isn’t to fix the problem, but rather to help diagnose the problem. If a reboot reliably fixes the problem, then you can focus your troubleshooting on what is happening that makes things break. Another benefit of the reboot is that it gets things up and running quickly, so users can get back to work. That way, when things are less busy you can troubleshoot the problem.
Shoot Trouble Before It Happens!
Strictly speaking this isn’t a troubleshooting tip as much as it is a tip for preparing for the day something goes wrong. Ideally all SharePoint administrators would know their farm so well they would immediately notice any changes made by someone else. In that world of sunshine and rainbows, administrators would also have perfect memories. In the world you probably live in, things aren’t so easy. Documenting your farm while things are working properly will make finding troublesome changes a lot easier. There are lots of third-party tools available for creating a record of all the services, web applications, and solution packages being utilized in a farm. Microsoft has even provided a PowerShell script for documenting configurations in SharePoint 2013. You can find it at http://technet.microsoft.com/en-us/library/ff645391.aspx. Another tool available to every administrator is notepad. Take notes when you make changes to your farm, especially changes that are supposed to be temporary or for “testing” purposes. Little things tend to accumulate over time and be forgotten in complex systems like SharePoint. Temporary changes become permanent; tests become production. Good documentation will give you a place to look when you are wondering which services should be running, or what accounts they are supposed to be using. Documentation will also help you realize things that looked out of place at first were really changes you made months ago and forgot about.
Along with basic documentation, don’t forget to put important information like the install files and license keys for third party solutions or passwords for important accounts in a safe place.
See the Bigger Picture: IIS and SQL
One of the challenges of SharePoint is that it doesn’t stand alone. Without IIS and SQL, SharePoint can’t function. To your users it doesn’t matter if the problem is SQL Server, IIS, or Active Directory, in their eyes it is SharePoint that isn’t doing what they want. If you have a Database Administrator, hopefully they are aware of tools like SQL Profiler and have experience with using them. If not you might start with a basic overview like the one found at http://msdn.microsoft.com/en-us/library/ff650699.aspx. SQL Server is an important part of your SharePoint farm; if you aren’t lucky enough to have a Database Administrator on staff, you might benefit from some research dedicated to its care and feeding.
IIS is another essential component to getting the most out of SharePoint. Like SharePoint, IIS has logs that may be helpful for troubleshooting. Typically IIS logs are located at %SystemDrive%inetpublogsLogFiles (c:inetpublogsLogFiles for most installations). Also like SharePoint IIS logs can be difficult to read so you might want to look for a tool like Microsoft’s Log Parser at http://www.microsoft.com/en-us/download/details.aspx?id=24659 to help you out.
IIS logs display the time in Coordinated Universal Time (UTC) not your local time zone so be careful to remember that when you are trying to find a specific entry. While IIS logs are typically not as large as SharePoint trace logs, they are not automatically purged over time. Make sure you put it on your “to-do” list to go in and clean them up occasionally, especially if you have a small storage volume.
Windows Server is the operating system that all of these technologies reside within. As you work your way through Event logs and error messages, pay attention to any signs of distress in the operating system itself. The Window Task Manager is the easiest way to look at what is running on your system and what resources it is consuming. If you aren’t very familiar with Task Manager, there is a good Microsoft support article at http://support.microsoft.com/kb/323527.
If you find something in Task Manager that makes you think there is a problem but you can’t quite figure it out, try Perfmon.exe, also known as Performance Monitor. Perfmon is very flexible and can be a little hard to get started with, but a quick Internet search can give you a lot of good tips. One of the major advantages is that you can set it to capture information about specific things at intervals over time. For example you can use Perfmon to collect data processor activity on your system and run that collection overnight to see when the highest and lowest processor load occurs. Perfmon essentially allows you to create your own log files looking specifically at the information you want. Doesn’t that sound handy?
ADDITIONAL TOOLS AND RESOURCES
This chapter contained several references to Internet searches. Troubleshooting SharePoint is sometimes too big of a job for one person to take on alone. Fortunately, there are discussion forums, blogs, and technical documentation from Microsoft to guide your way, so be sure to use them. The following two resources are a good starting place when you are looking for help:
- MSDN Forums: http://social.msdn.microsoft.com/Forums/en-US/category/sharepoint
- SharePoint Stack Exchange: http://sharepoint.stackexchange.com
When asking your question, be sure to provide as much information as possible. This includes the SharePoint build, how many machines are in your farm, what was the last thing that was changed before the problem started, what you’ve already tried, and so on. Also, be respectful to the people trying to help you. In most cases they are unpaid volunteers who are giving you their most valuable resource — their time. You can also take your problem to Twitter, if you want to wade into that pool. There are a lot of SharePoint professionals there willing to help you out. If you want to cast a wide net with your questions, include the hashtag #sphelp.
Also available are many tools to assist in managing and troubleshooting your SharePoint farm; some are free, and some are available for purchase. They range from simple applications that parse and search the ULS logs to complex solutions that completely change how SharePoint works. All of these tools should be evaluated on a test farm first, and some of them can be very helpful.
Don’t overlook the most common tool for troubleshooting any website, the web browser. Almost every modern web browser has some developer tools built in and many have extensions that can add additional debugging features. Even if they aren’t in the same league as something like Fiddler, having them available on every machine makes it worth knowing how to use them. SharePoint 2013 supports Internet Explorer versions 8 through 10 and the most recent versions of Google Chrome, Firefox, and Safari so often you can use the one you are most comfortable with. Just be sure not to forget that some settings for Internet Explorer, especially those around authentication and the network zones (Local Intranet, Trusted sites, Internet, and Restricted sites) can have an influence on how other applications, such as Microsoft Office, interact with SharePoint.
SUMMARY
This chapter described several tools and other resources you can use when you are seeking a solution to a SharePoint problem. As you wade through these sources of information, however, it bears repeating that your brain, at least the parts not devoted to quoting lines from movies and remembering where your car keys are, is your best troubleshooting tool. Keep in mind that SharePoint exists inside of a whole range of technologies and physical requirements. Active Directory, DNS, networking, and even the offices where the cleaning crew unplugs servers to free up a plug for the vacuum can all influence how your SharePoint farm functions.
Although facing a problem may seem daunting, this chapter has outlined several guidelines for troubleshooting. Look for things that have changed, either in the farm or in the general environment. Look for repetition and patterns (does it happen every four hours, every night at 1:44 A.M., etc.), and any common denominators among the people and places where the error occurs. In a world of VPNs, firewalls, bring-your-own-device policies, and different browser updates daily, not all SharePoint problems are related to SharePoint. Another trap administrators sometimes fall into is concentrating on why a problem exists in a production farm. Every administrator would like to know the root cause of an issue, but on a production server the highest priority is getting things working again. If recreating the web application gets everyone back to work, you can look for the cause in the trace logs later. Happy hunting!